| Param | Original file | Final file |
|---|---|---|
| Filename | modeM0/AS1A12_057T01_9000005418_38972cztM0_level2.fits | modeM0/AS1A12_057T01_9000005418_38972cztM0_level2_quad_clean.evt |
| Size (bytes) | 317,352,960 | 88,320,960 |
| Size | 302.7 MB | 84.2 MB |
| Events in quadrant A | 2,637,744 | 596,906 |
| Events in quadrant B | 2,404,547 | 612,692 |
| Events in quadrant C | 3,288,549 | 559,609 |
| Events in quadrant D | 3,008,565 | 538,692 |
| Mode M9 | |||
|---|---|---|---|
| Quadrant | BADHDUFLAG | Total packets | Discarded packets |
| A | 0 | 36 | 0 |
| B | 0 | 36 | 0 |
| C | 0 | 36 | 0 |
| D | 0 | 37 | 0 |
| Mode SS | |||
|---|---|---|---|
| Quadrant | BADHDUFLAG | Total packets | Discarded packets |
| A | 0 | 106 | 0 |
| B | 0 | 106 | 0 |
| C | 0 | 106 | 0 |
| D | 0 | 106 | 0 |
| Mode M0 | |||
|---|---|---|---|
| Quadrant | BADHDUFLAG | Total packets | Discarded packets |
| A | 0 | 11170 | 3 |
| B | 0 | 10834 | 2 |
| C | 0 | 13289 | 2 |
| D | 0 | 12847 | 2 |
| Quadrant | Total seconds | Saturated seconds | Saturation percentage |
|---|---|---|---|
| A | 5232 | 9 | 0.172018% |
| B | 5232 | 17 | 0.324924% |
| C | 5232 | 283 | 5.409021% |
| D | 5232 | 97 | 1.853976% |
Noise dominated data is calculated using 1-second bins in cleaned event files. If a bin has >2000 counts, and if more than 50% of those come from <1% of pixels, then it is considered to be noise-dominated and hence unusable.
| Quadrant | # 1 sec bins | Bins with >0 counts | Bins with >2000 counts | High rate bins dominated by noise | Noise dominated (total time) | Noise dominated (detector-on time) | Marked lightcurve |
|---|---|---|---|---|---|---|---|
| A | 6965 | 5233 | 8 | 8 | 0.11% | 0.15% | 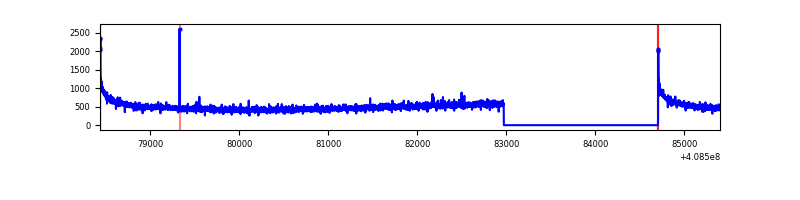 |
| B | 6965 | 5233 | 8 | 8 | 0.11% | 0.15% | 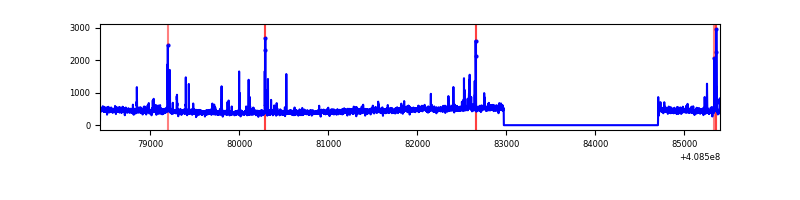 |
| C | 6965 | 5233 | 268 | 268 | 3.85% | 5.12% | 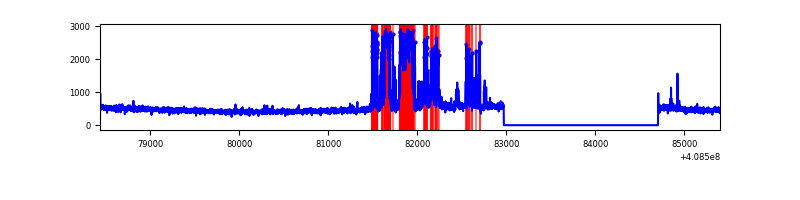 |
| D | 6965 | 5232 | 90 | 90 | 1.29% | 1.72% | 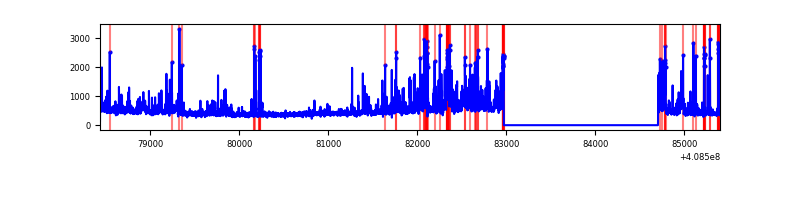 |
Top three noisy pixels from each quadrant. If the there are fewer than three noisy pixels in the level2.evt file, extra rows are filled as -1
| Pixel properties | Quadrant properties | ||||||
|---|---|---|---|---|---|---|---|
| Quadrant | DetID | PixID | Counts | Sigma | Mean | Median | Sigma |
| A | 10 | 83 | 404663 | 3467.31 | 570 | 560 | 116.5 |
| A | 13 | 6 | 14218 | 117.19 | 570 | 560 | 116.5 |
| A | 13 | 254 | 9547 | 77.11 | 570 | 560 | 116.5 |
| B | 5 | 172 | 115164 | 1039.9 | 570 | 556 | 110.2 |
| B | 0 | 230 | 21634 | 191.25 | 570 | 556 | 110.2 |
| B | 12 | 111 | 13884 | 120.93 | 570 | 556 | 110.2 |
| C | 14 | 254 | 925151 | 7282.84 | 546 | 551 | 127.0 |
| C | 15 | 214 | 225314 | 1770.4 | 546 | 551 | 127.0 |
| C | 13 | 61 | 3578 | 23.84 | 546 | 551 | 127.0 |
| D | 12 | 227 | 436549 | 3224.82 | 554 | 538 | 135.2 |
| D | 2 | 249 | 116211 | 855.54 | 554 | 538 | 135.2 |
| D | 2 | 250 | 86395 | 635.02 | 554 | 538 | 135.2 |
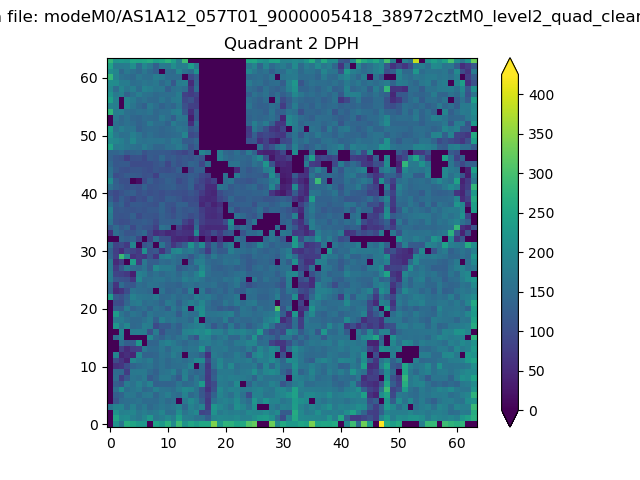
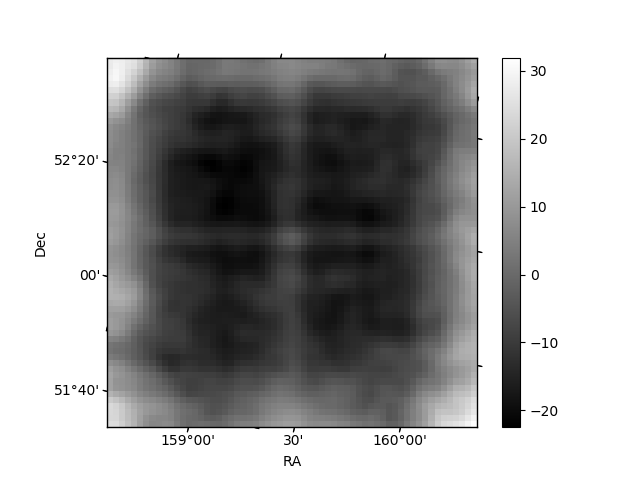
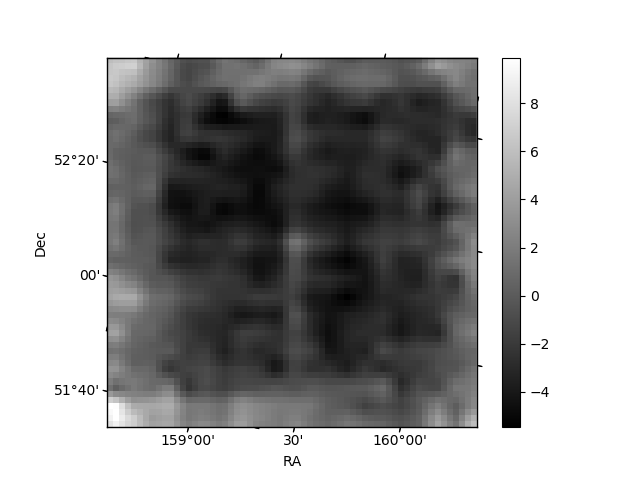
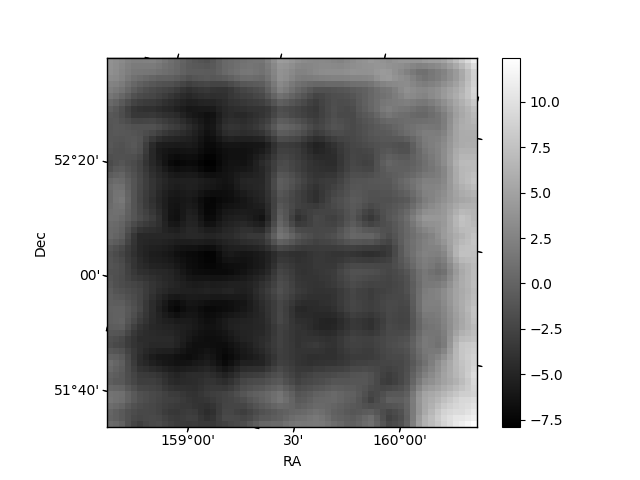
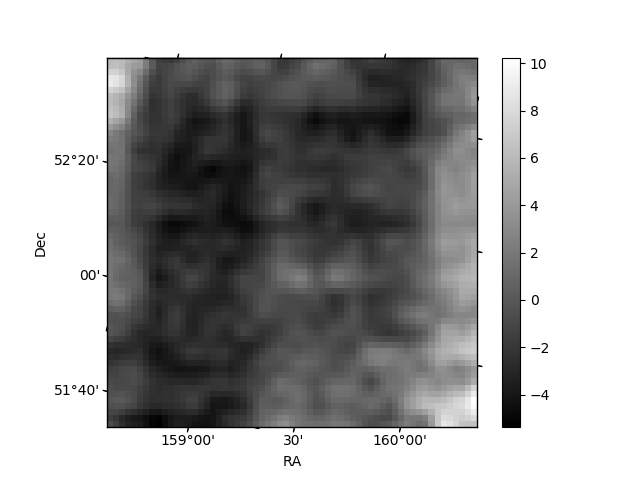
Histogram calculated using DETX and DETY for each event in the final _common_clean file
| Quadrant A | 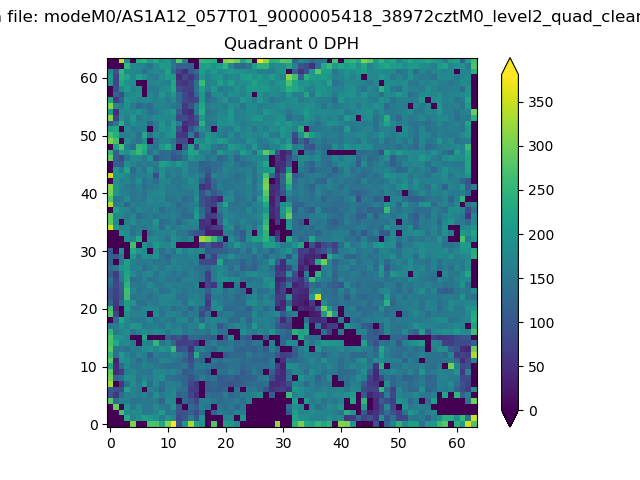 |
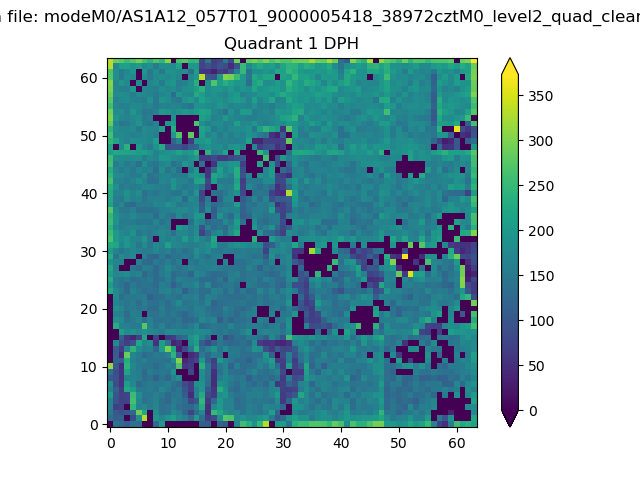 |
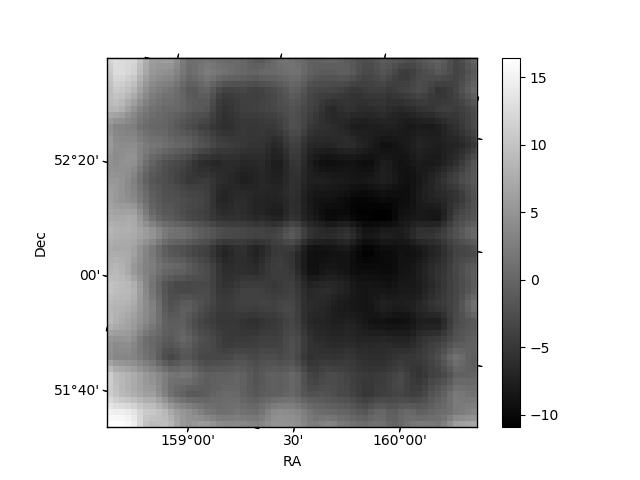
Quadrant B |
|---|---|---|---|
| Quadrant D | 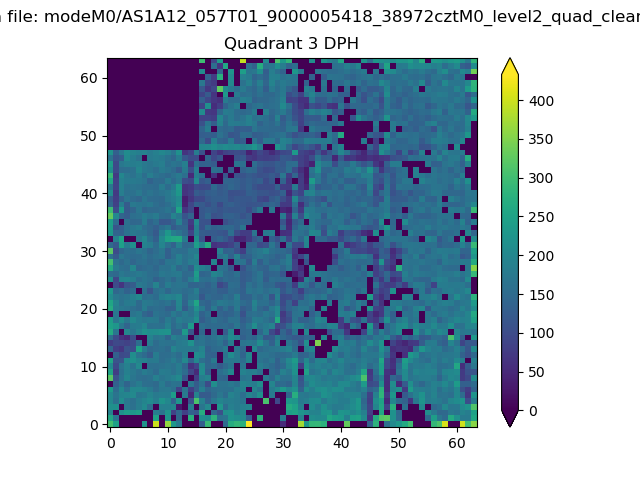 |
 |
Quadrant C |
| Plot type | Count rate plots | Images |
|---|---|---|
| Comparison with Poisson distribution Blue bars denote a histogram of data divided into 1 sec bins. Red curve is a Poisson curve with rate = median count rate of data. |
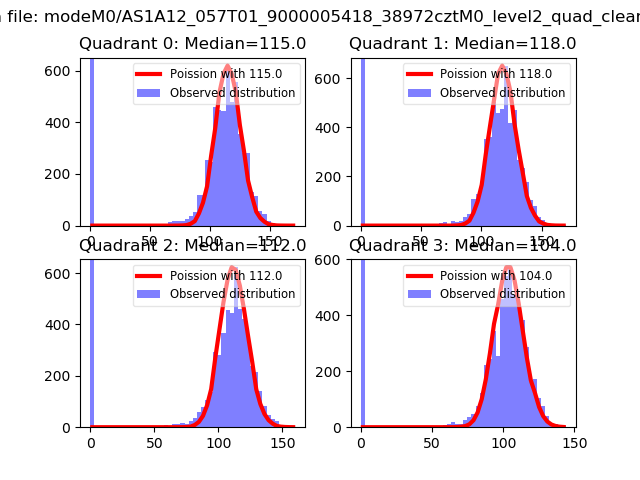 |
 |
| Quadrant-wise count rates Data is divided into 100 sec bins |
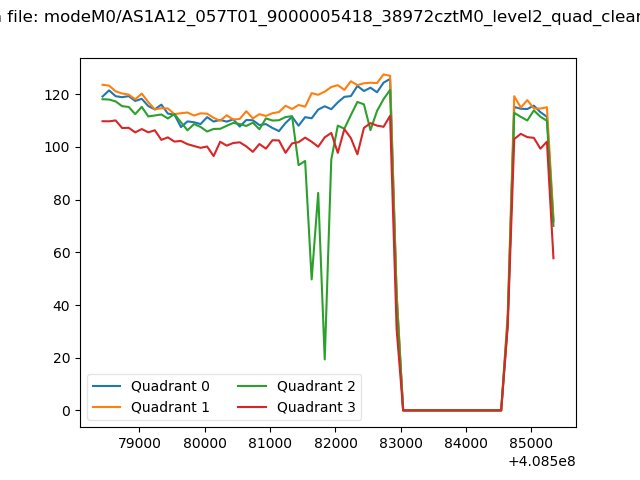 |
|
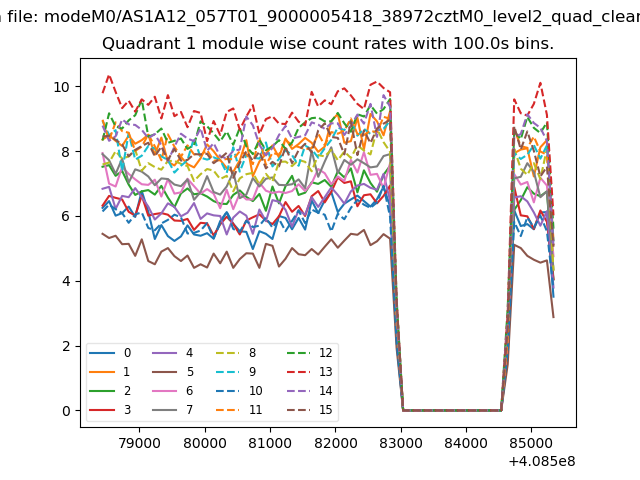
| Module-wise count rates for Quadrant A Data is divided into 100 sec bins |
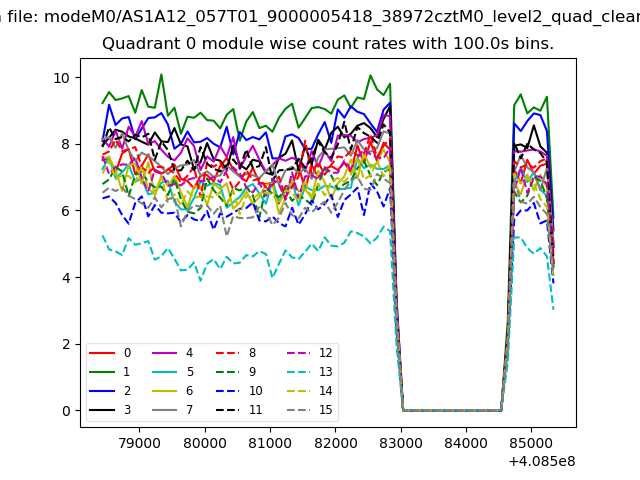 |
 |
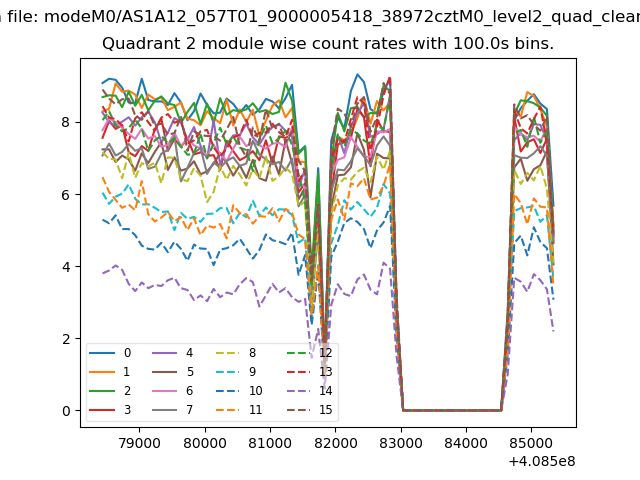
| Module-wise count rates for Quadrant B Data is divided into 100 sec bins |
 |
 |
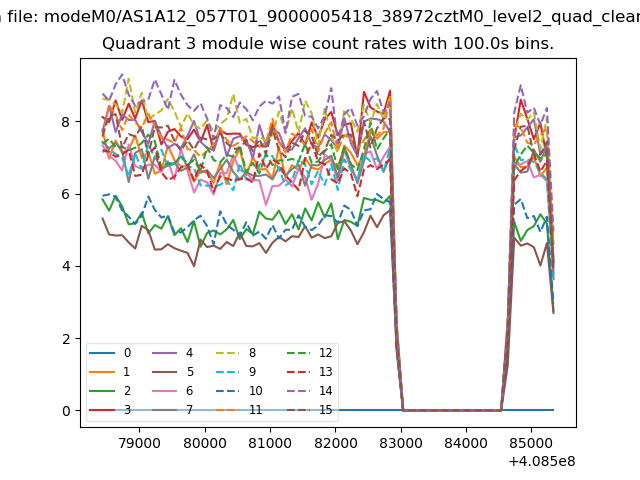
| Module-wise count rates for Quadrant C Data is divided into 100 sec bins |
 |
 |
| Module-wise count rates for Quadrant D Data is divided into 100 sec bins |
 |
 |
| Parameter | Plot |
|---|---|
| CZT HV Monitor | 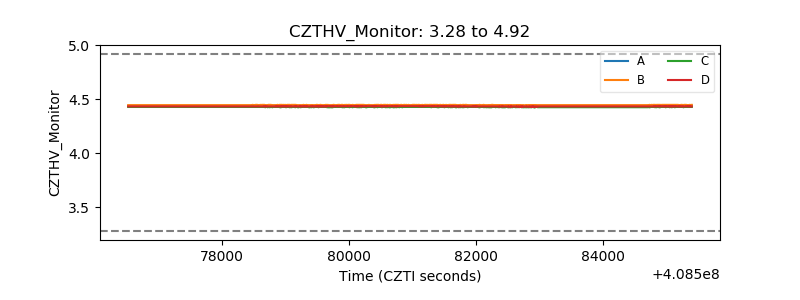 |
| D_VDD | 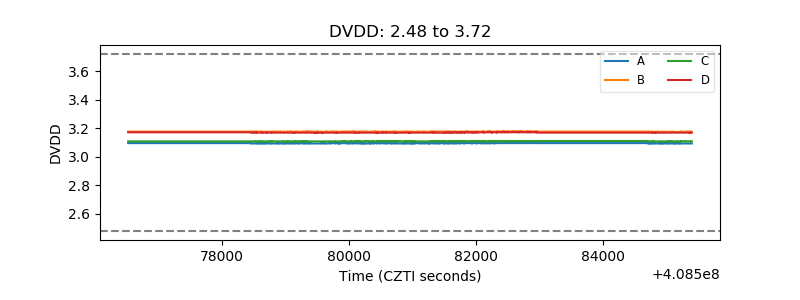 |
| Temperature 1 | 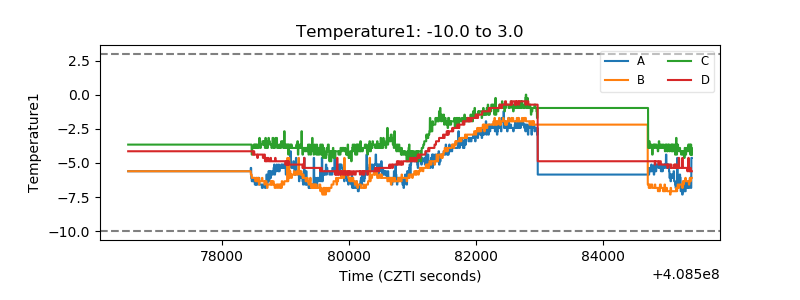 |
| Veto HV Monitor | 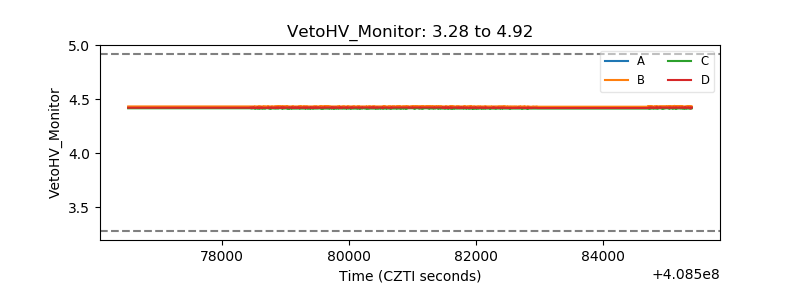 |
| Veto LLD | 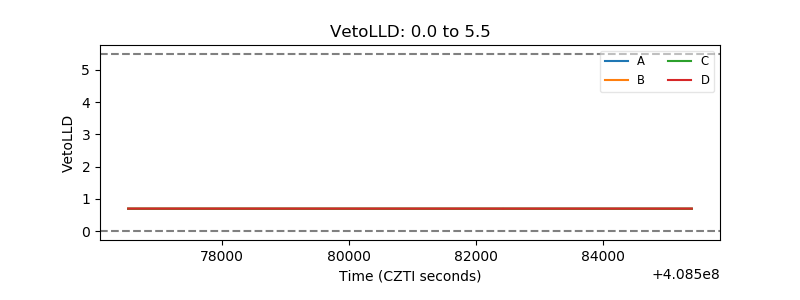 |
| Alpha Counter | 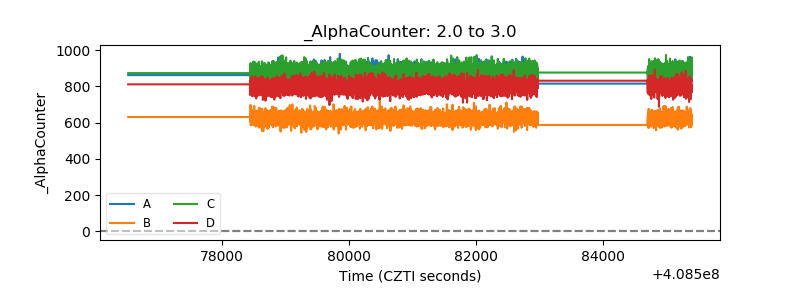 |
| _CPM_Rate | 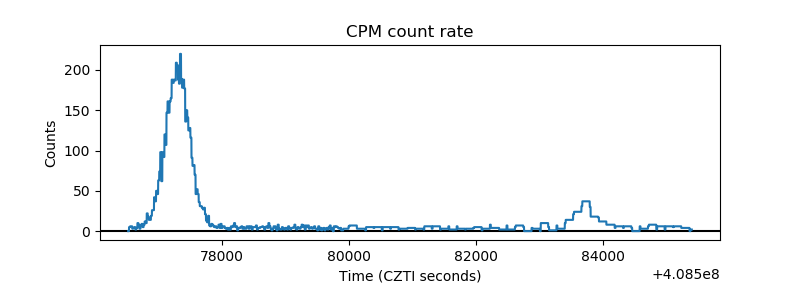 |
| CZT Counter | 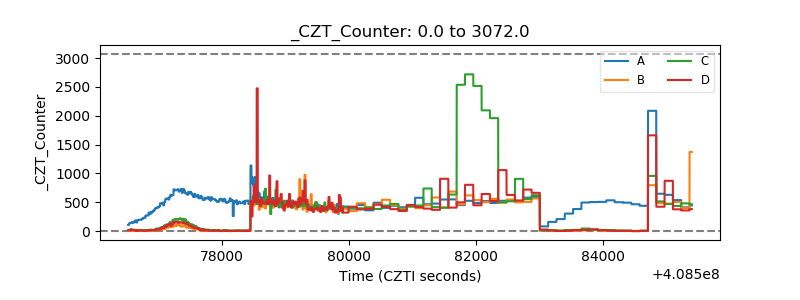 |
| +2.5 Volts monitor | 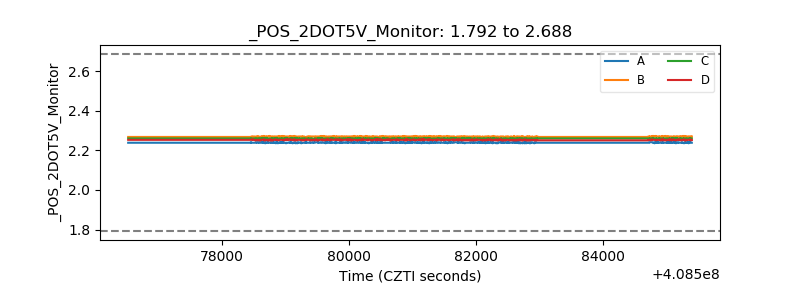 |
| +5 Volts monitor |  |
| _ROLL_ROT | 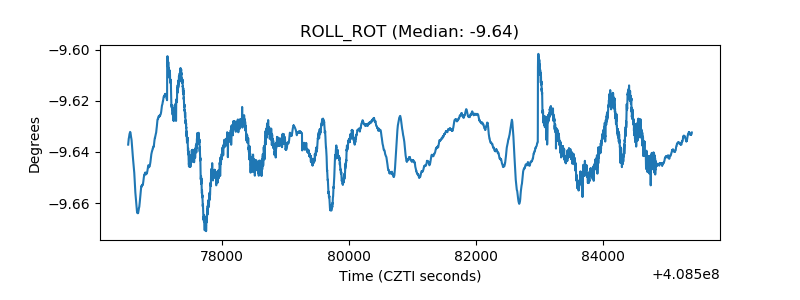 |
| _Roll_DEC | 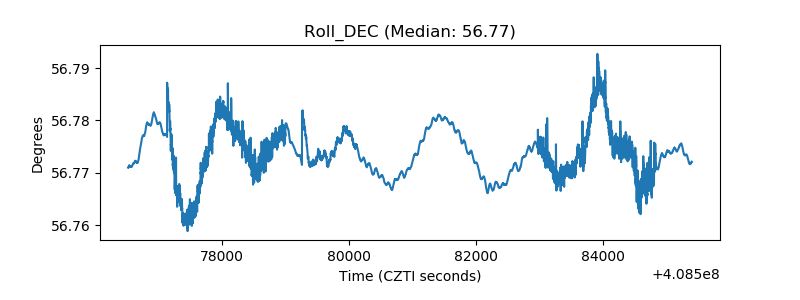 |
| _Roll_RA |  |
| Veto Counter | 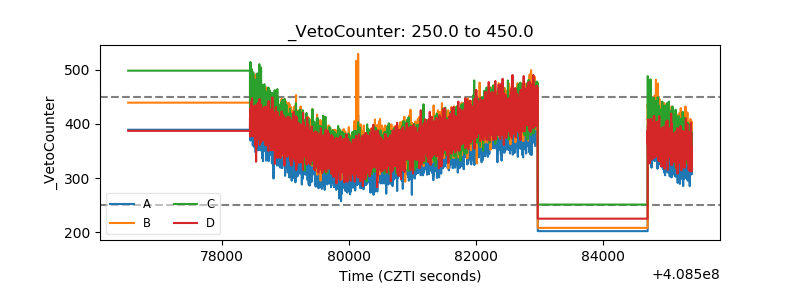 |