| Param | Original file | Final file |
|---|---|---|
| Filename | modeM0/AS1A12_057T01_9000005418_38973cztM0_level2.fits | modeM0/AS1A12_057T01_9000005418_38973cztM0_level2_quad_clean.evt |
| Size (bytes) | 407,761,920 | 100,123,200 |
| Size | 388.9 MB | 95.5 MB |
| Events in quadrant A | 3,053,054 | 683,634 |
| Events in quadrant B | 3,002,318 | 698,667 |
| Events in quadrant C | 3,960,304 | 639,471 |
| Events in quadrant D | 4,606,204 | 585,359 |
| Mode M9 | |||
|---|---|---|---|
| Quadrant | BADHDUFLAG | Total packets | Discarded packets |
| A | 0 | 31 | 0 |
| B | 0 | 31 | 0 |
| C | 0 | 31 | 0 |
| D | 0 | 31 | 0 |
| Mode SS | |||
|---|---|---|---|
| Quadrant | BADHDUFLAG | Total packets | Discarded packets |
| A | 0 | 128 | 0 |
| B | 0 | 128 | 0 |
| C | 0 | 128 | 0 |
| D | 0 | 128 | 0 |
| Mode M0 | |||
|---|---|---|---|
| Quadrant | BADHDUFLAG | Total packets | Discarded packets |
| A | 0 | 12933 | 3 |
| B | 0 | 13219 | 2 |
| C | 0 | 15758 | 2 |
| D | 0 | 18194 | 2 |
| Quadrant | Total seconds | Saturated seconds | Saturation percentage |
|---|---|---|---|
| A | 6070 | 9 | 0.148270% |
| B | 6070 | 51 | 0.840198% |
| C | 6070 | 293 | 4.827018% |
| D | 6070 | 463 | 7.627677% |
Noise dominated data is calculated using 1-second bins in cleaned event files. If a bin has >2000 counts, and if more than 50% of those come from <1% of pixels, then it is considered to be noise-dominated and hence unusable.
| Quadrant | # 1 sec bins | Bins with >0 counts | Bins with >2000 counts | High rate bins dominated by noise | Noise dominated (total time) | Noise dominated (detector-on time) | Marked lightcurve |
|---|---|---|---|---|---|---|---|
| A | 9237 | 6072 | 7 | 7 | 0.08% | 0.12% | 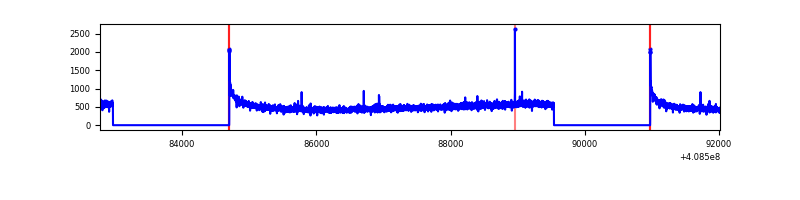 |
| B | 9237 | 6072 | 30 | 30 | 0.32% | 0.49% | 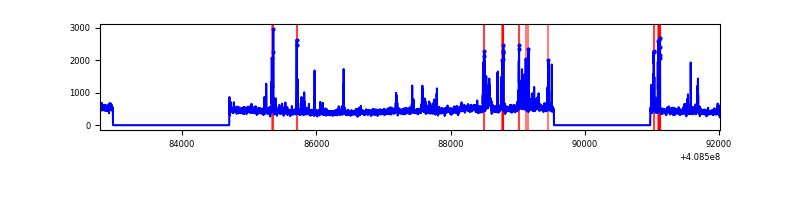 |
| C | 9237 | 6072 | 206 | 206 | 2.23% | 3.39% | 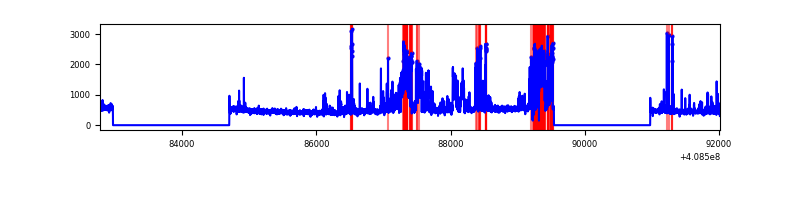 |
| D | 9237 | 6070 | 445 | 445 | 4.82% | 7.33% | 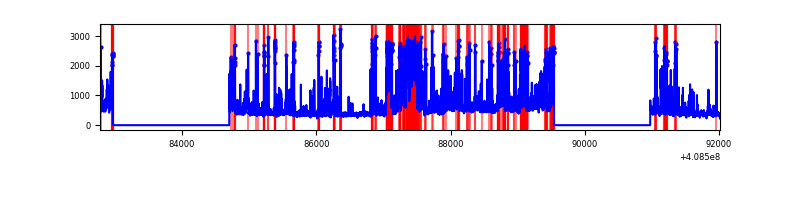 |
Top three noisy pixels from each quadrant. If the there are fewer than three noisy pixels in the level2.evt file, extra rows are filled as -1
| Pixel properties | Quadrant properties | ||||||
|---|---|---|---|---|---|---|---|
| Quadrant | DetID | PixID | Counts | Sigma | Mean | Median | Sigma |
| A | 10 | 83 | 455312 | 3380.92 | 665 | 651 | 134.5 |
| A | 13 | 6 | 11549 | 81.04 | 665 | 651 | 134.5 |
| A | 9 | 143 | 10222 | 71.17 | 665 | 651 | 134.5 |
| B | 5 | 172 | 347583 | 2726.11 | 661 | 642 | 127.3 |
| B | 0 | 230 | 43477 | 336.58 | 661 | 642 | 127.3 |
| B | 12 | 111 | 16207 | 122.3 | 661 | 642 | 127.3 |
| C | 14 | 254 | 1235228 | 8506.54 | 628 | 631 | 145.1 |
| C | 15 | 214 | 259247 | 1781.9 | 628 | 631 | 145.1 |
| C | 15 | 208 | 6868 | 42.97 | 628 | 631 | 145.1 |
| D | 12 | 227 | 1012618 | 6623.65 | 630 | 613 | 152.8 |
| D | 13 | 249 | 359654 | 2349.95 | 630 | 613 | 152.8 |
| D | 2 | 250 | 345579 | 2257.83 | 630 | 613 | 152.8 |
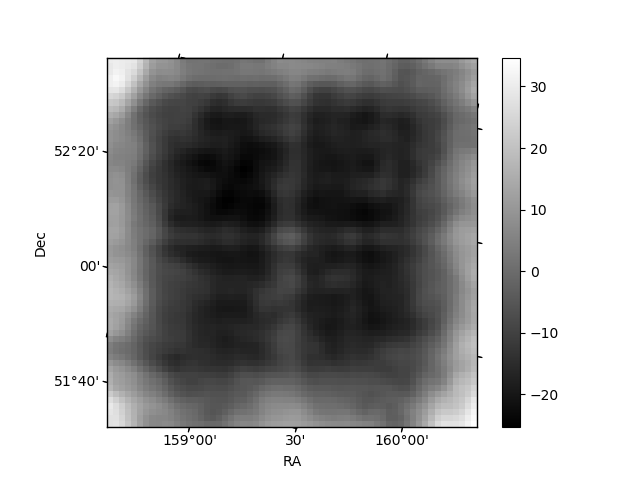
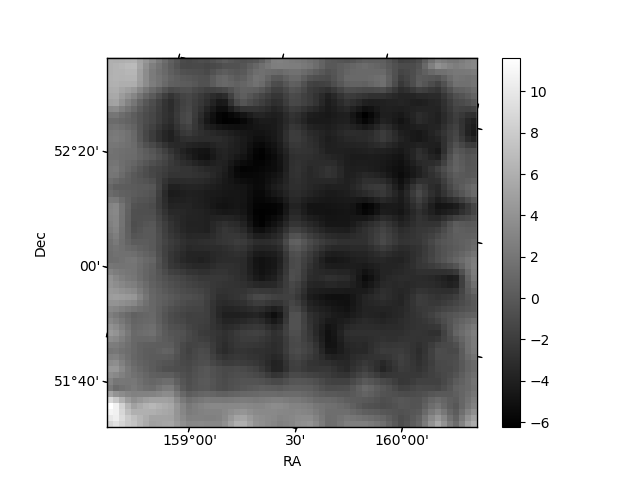
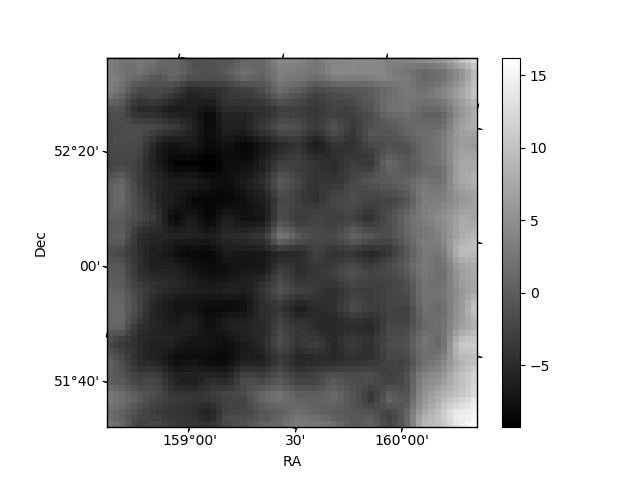
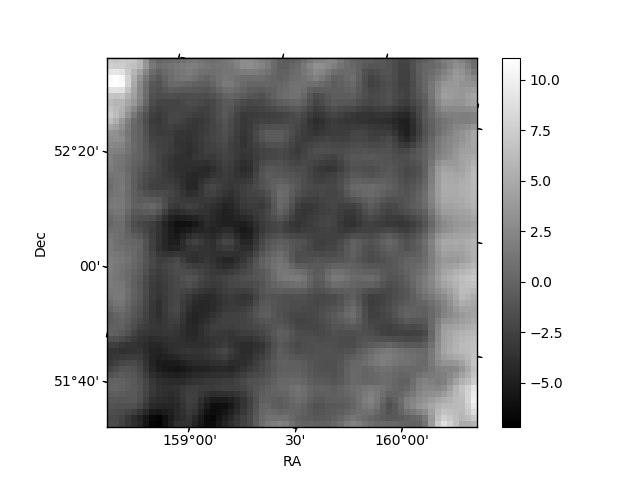
Histogram calculated using DETX and DETY for each event in the final _common_clean file
| Quadrant A | 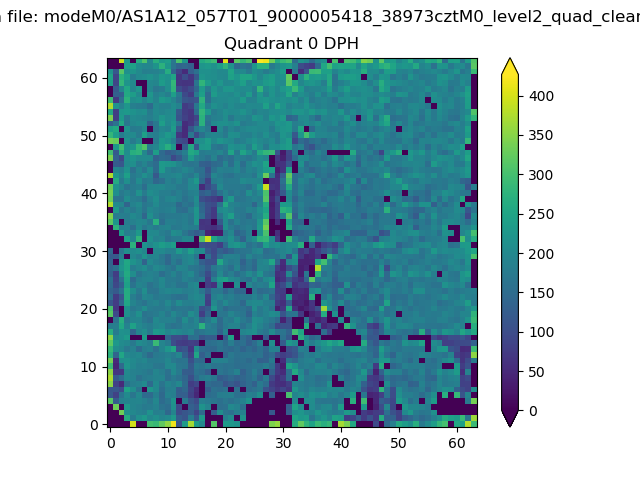 |
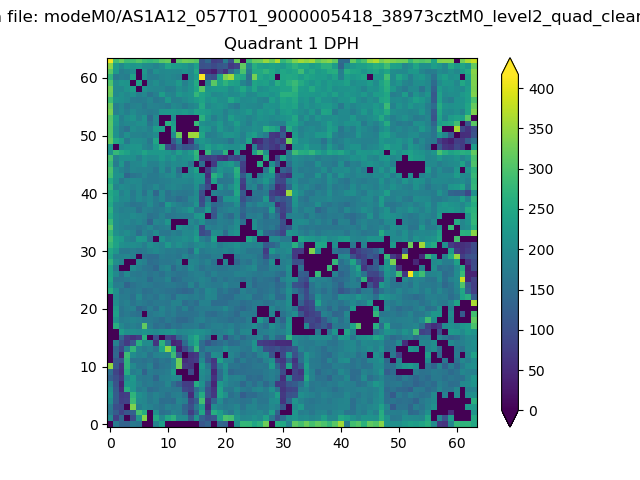 |
Quadrant B |
|---|---|---|---|
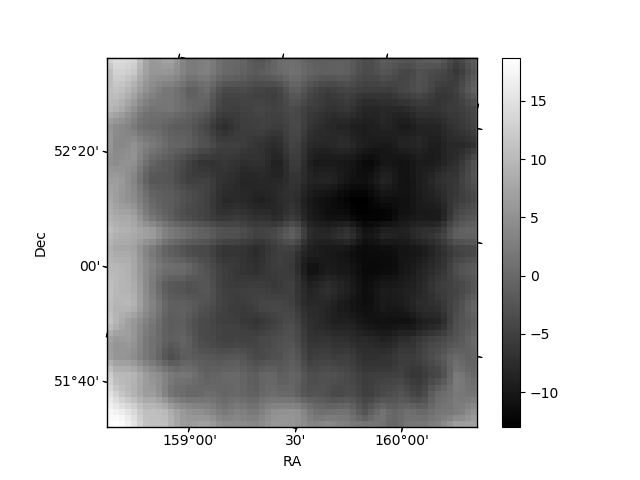
| Quadrant D | 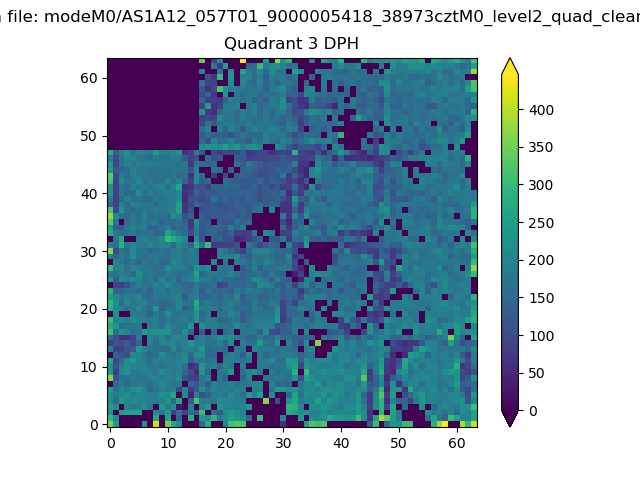 |
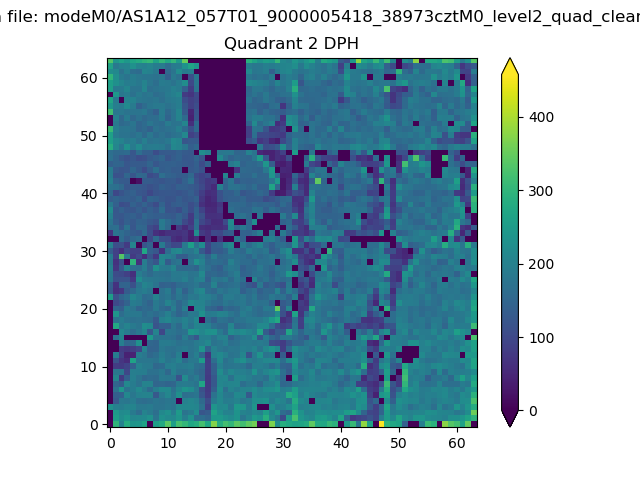 |
Quadrant C |
| Plot type | Count rate plots | Images |
|---|---|---|
| Comparison with Poisson distribution Blue bars denote a histogram of data divided into 1 sec bins. Red curve is a Poisson curve with rate = median count rate of data. |
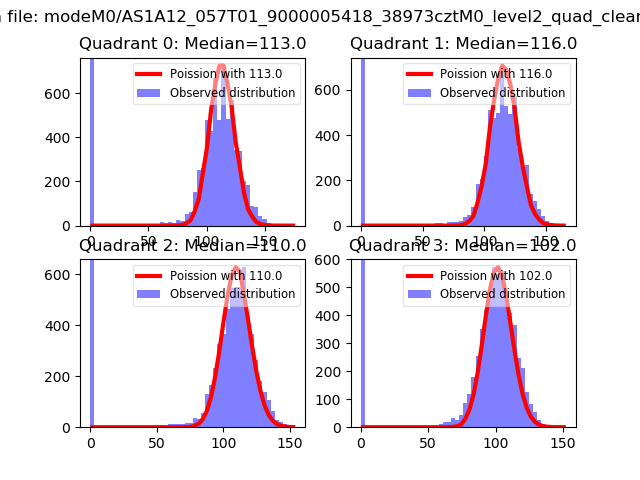 |
 |
| Quadrant-wise count rates Data is divided into 100 sec bins |
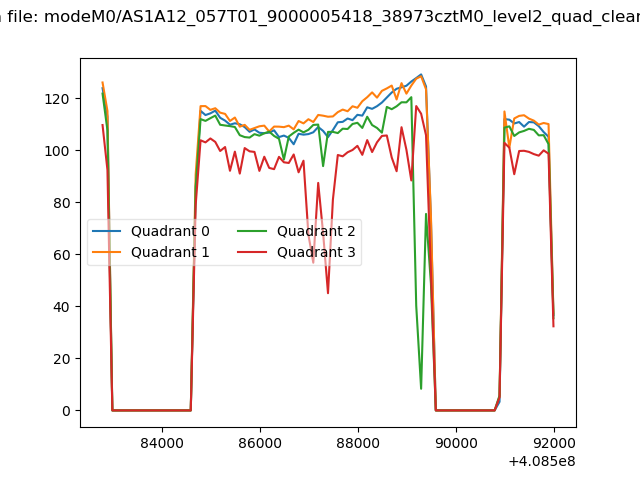 |
|
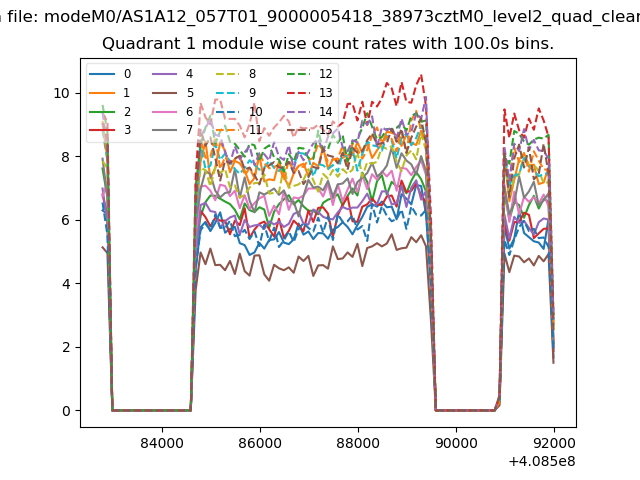
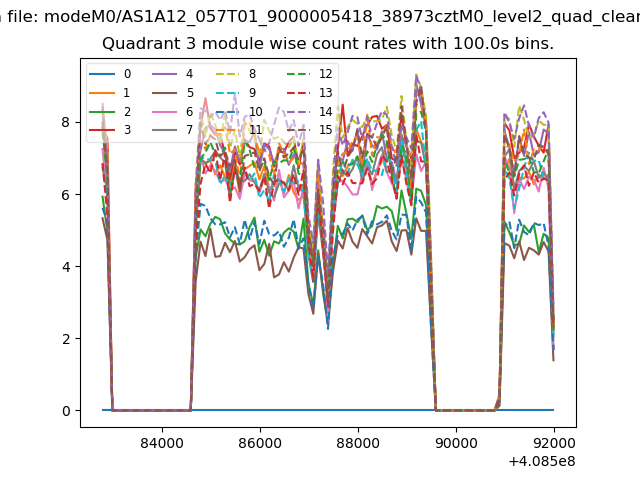
| Module-wise count rates for Quadrant A Data is divided into 100 sec bins |
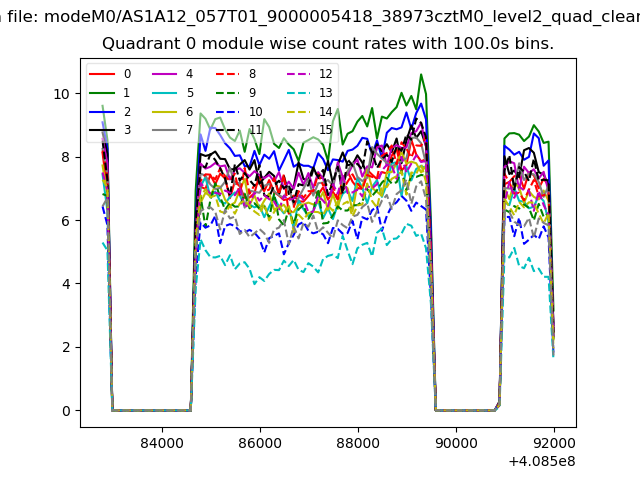 |
 |
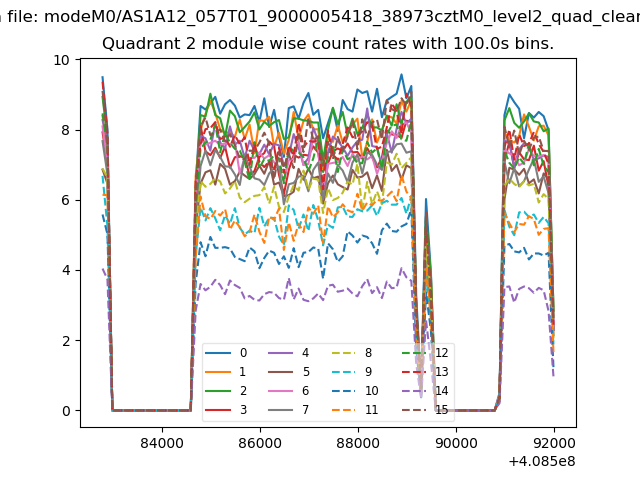
| Module-wise count rates for Quadrant B Data is divided into 100 sec bins |
 |
 |
| Module-wise count rates for Quadrant C Data is divided into 100 sec bins |
 |
 |
| Module-wise count rates for Quadrant D Data is divided into 100 sec bins |
 |
 |
| Parameter | Plot |
|---|---|
| CZT HV Monitor | 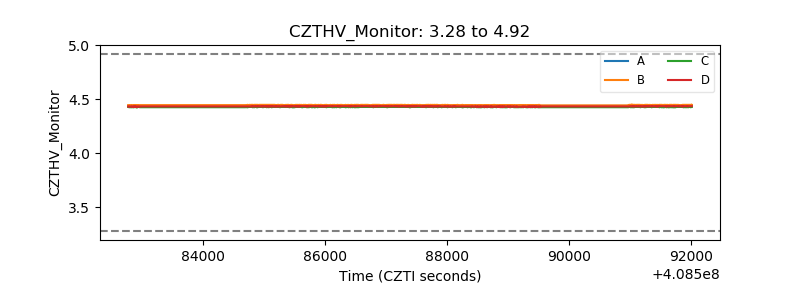 |
| D_VDD | 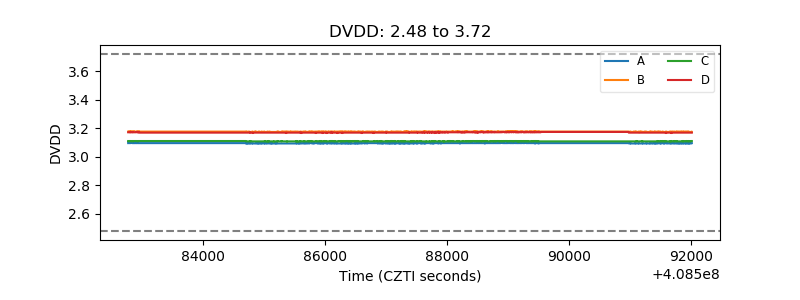 |
| Temperature 1 | 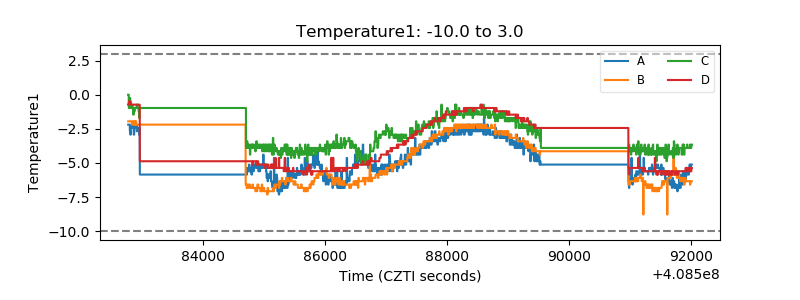 |
| Veto HV Monitor | 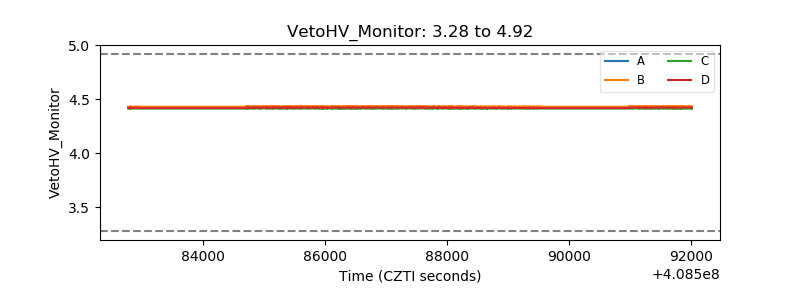 |
| Veto LLD | 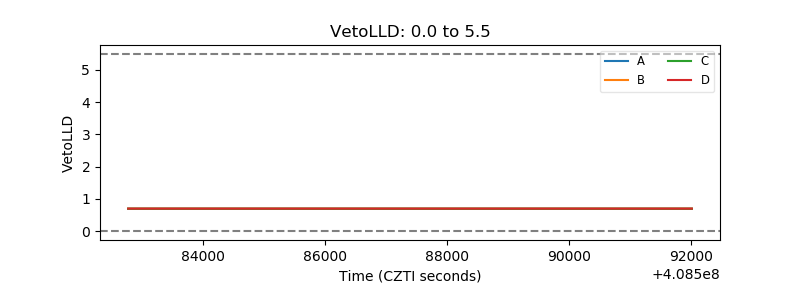 |
| Alpha Counter | 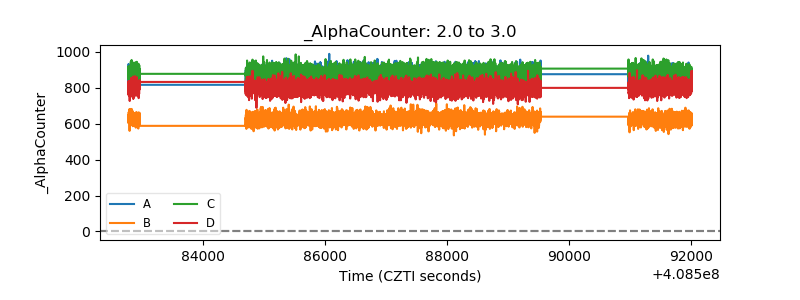 |
| _CPM_Rate | 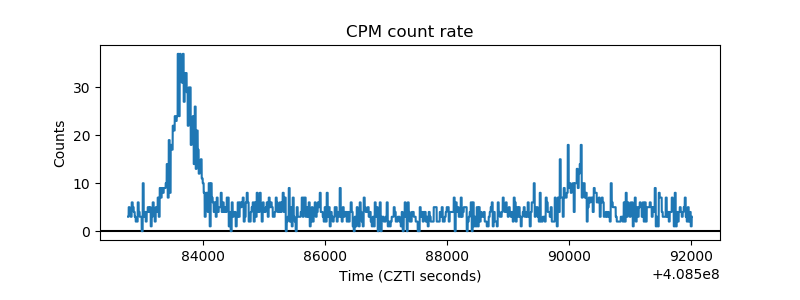 |
| CZT Counter | 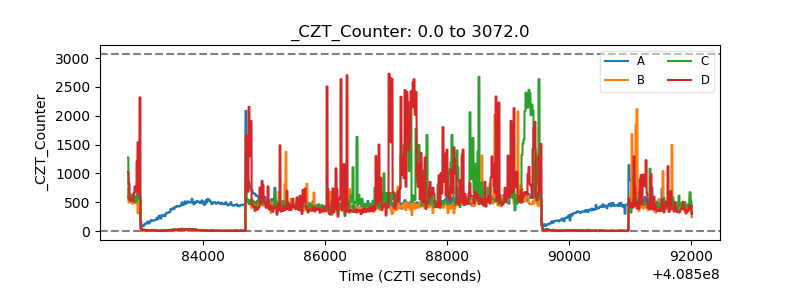 |
| +2.5 Volts monitor | 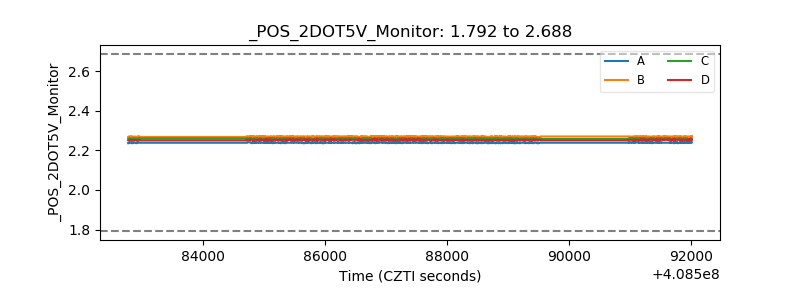 |
| +5 Volts monitor | 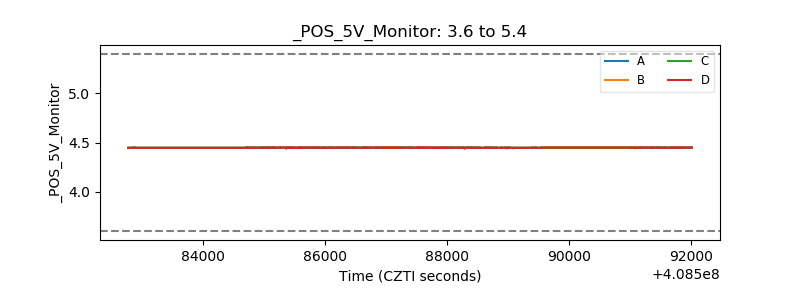 |
| _ROLL_ROT | 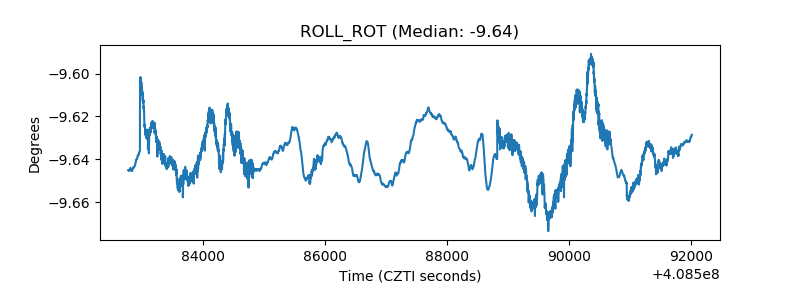 |
| _Roll_DEC | 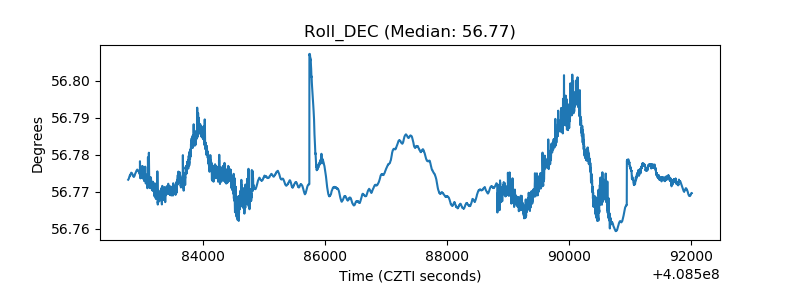 |
| _Roll_RA | 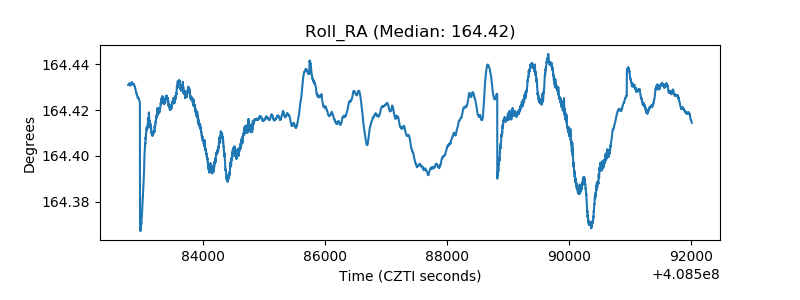 |
| Veto Counter | 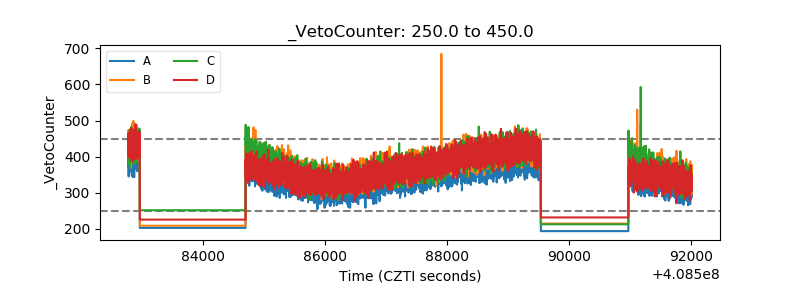 |