| Param | Original file | Final file |
|---|---|---|
| Filename | modeM0/AS1A12_057T01_9000005418_38974cztM0_level2.fits | modeM0/AS1A12_057T01_9000005418_38974cztM0_level2_quad_clean.evt |
| Size (bytes) | 392,212,800 | 95,863,680 |
| Size | 374.0 MB | 91.4 MB |
| Events in quadrant A | 3,007,770 | 661,190 |
| Events in quadrant B | 2,868,385 | 674,585 |
| Events in quadrant C | 3,102,090 | 643,993 |
| Events in quadrant D | 5,078,390 | 508,612 |
| Mode M9 | |||
|---|---|---|---|
| Quadrant | BADHDUFLAG | Total packets | Discarded packets |
| A | 0 | 19 | 0 |
| B | 0 | 19 | 0 |
| C | 0 | 19 | 0 |
| D | 0 | 20 | 0 |
| Mode SS | |||
|---|---|---|---|
| Quadrant | BADHDUFLAG | Total packets | Discarded packets |
| A | 0 | 120 | 0 |
| B | 0 | 120 | 0 |
| C | 0 | 120 | 0 |
| D | 0 | 120 | 0 |
| Mode M0 | |||
|---|---|---|---|
| Quadrant | BADHDUFLAG | Total packets | Discarded packets |
| A | 0 | 12574 | 2 |
| B | 0 | 12651 | 1 |
| C | 0 | 13066 | 1 |
| D | 0 | 19516 | 1 |
| Quadrant | Total seconds | Saturated seconds | Saturation percentage |
|---|---|---|---|
| A | 5929 | 13 | 0.219261% |
| B | 5929 | 62 | 1.045708% |
| C | 5929 | 16 | 0.269860% |
| D | 5929 | 916 | 15.449486% |
Noise dominated data is calculated using 1-second bins in cleaned event files. If a bin has >2000 counts, and if more than 50% of those come from <1% of pixels, then it is considered to be noise-dominated and hence unusable.
| Quadrant | # 1 sec bins | Bins with >0 counts | Bins with >2000 counts | High rate bins dominated by noise | Noise dominated (total time) | Noise dominated (detector-on time) | Marked lightcurve |
|---|---|---|---|---|---|---|---|
| A | 7212 | 5930 | 8 | 8 | 0.11% | 0.13% | 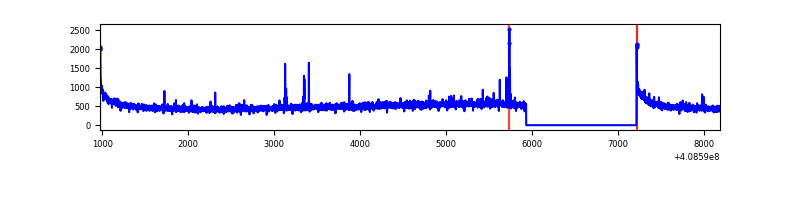 |
| B | 7212 | 5930 | 36 | 36 | 0.50% | 0.61% | 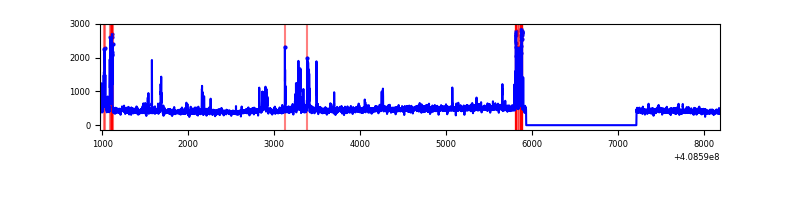 |
| C | 7212 | 5930 | 10 | 10 | 0.14% | 0.17% | 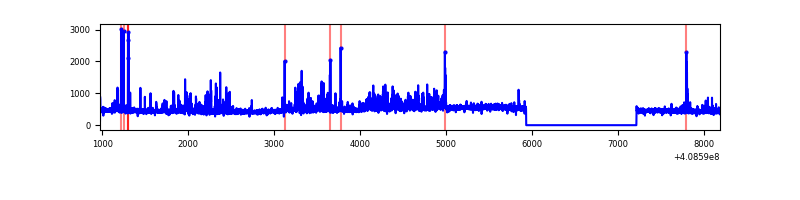 |
| D | 7212 | 5930 | 866 | 866 | 12.01% | 14.60% | 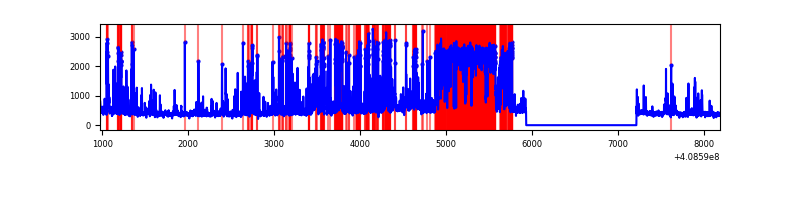 |
Top three noisy pixels from each quadrant. If the there are fewer than three noisy pixels in the level2.evt file, extra rows are filled as -1
| Pixel properties | Quadrant properties | ||||||
|---|---|---|---|---|---|---|---|
| Quadrant | DetID | PixID | Counts | Sigma | Mean | Median | Sigma |
| A | 10 | 83 | 458678 | 3482.61 | 647 | 634 | 131.5 |
| A | 9 | 143 | 36025 | 269.09 | 647 | 634 | 131.5 |
| A | 13 | 254 | 9212 | 65.22 | 647 | 634 | 131.5 |
| B | 5 | 172 | 281945 | 2268.35 | 643 | 626 | 124.0 |
| B | 0 | 230 | 37472 | 297.1 | 643 | 626 | 124.0 |
| B | 12 | 111 | 15716 | 121.67 | 643 | 626 | 124.0 |
| C | 14 | 254 | 362313 | 2463.03 | 631 | 635 | 146.8 |
| C | 15 | 214 | 262009 | 1779.96 | 631 | 635 | 146.8 |
| C | 15 | 208 | 6577 | 40.47 | 631 | 635 | 146.8 |
| D | 2 | 249 | 1545204 | 10894.65 | 575 | 559 | 141.8 |
| D | 12 | 227 | 768728 | 5418.03 | 575 | 559 | 141.8 |
| D | 1 | 47 | 159025 | 1117.69 | 575 | 559 | 141.8 |
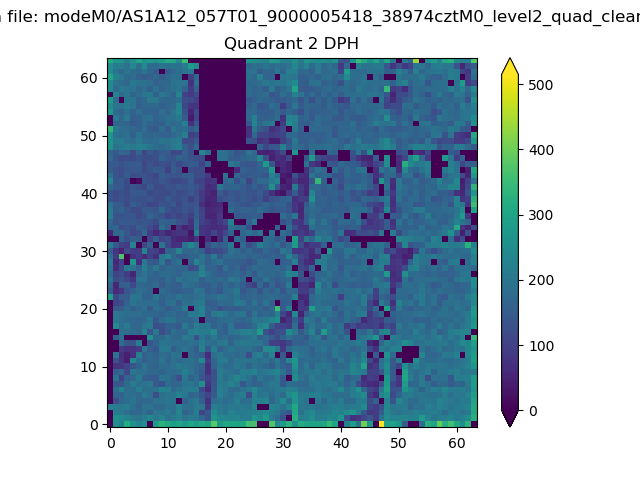
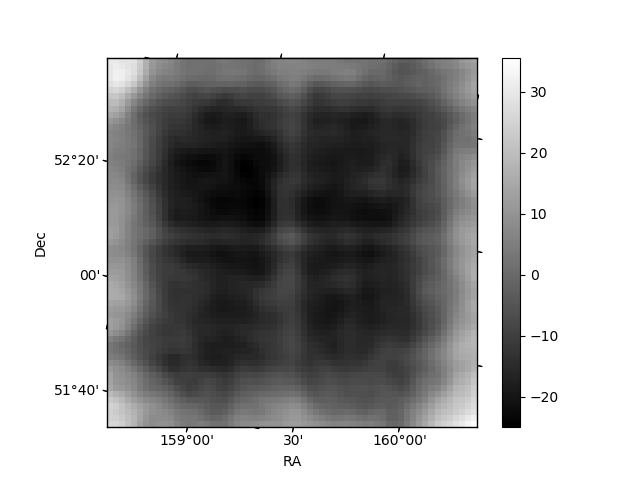
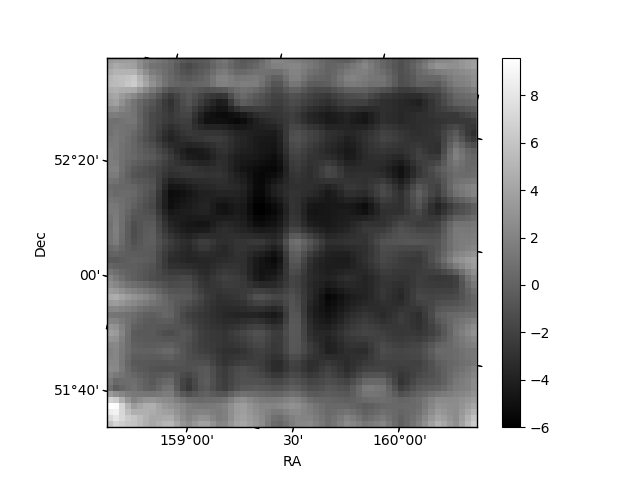
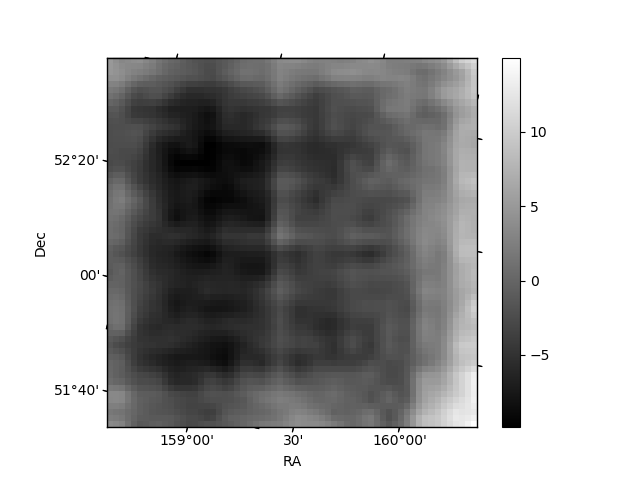
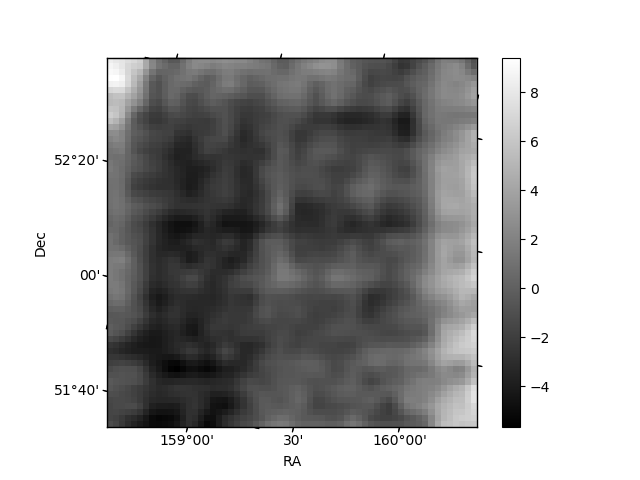
Histogram calculated using DETX and DETY for each event in the final _common_clean file
| Quadrant A | 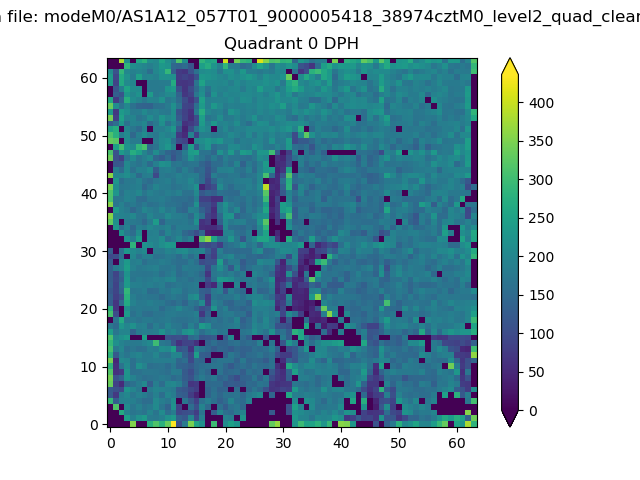 |
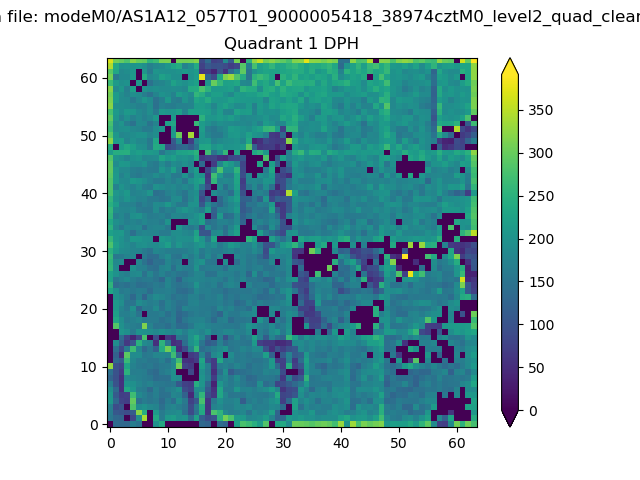 |
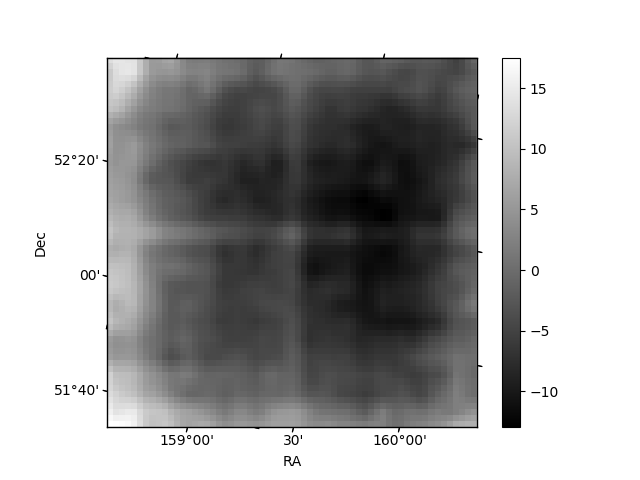
Quadrant B |
|---|---|---|---|
| Quadrant D | 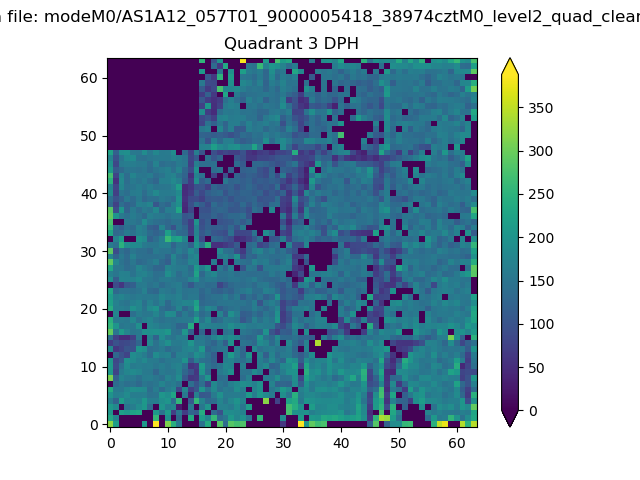 |
 |
Quadrant C |
| Plot type | Count rate plots | Images |
|---|---|---|
| Comparison with Poisson distribution Blue bars denote a histogram of data divided into 1 sec bins. Red curve is a Poisson curve with rate = median count rate of data. |
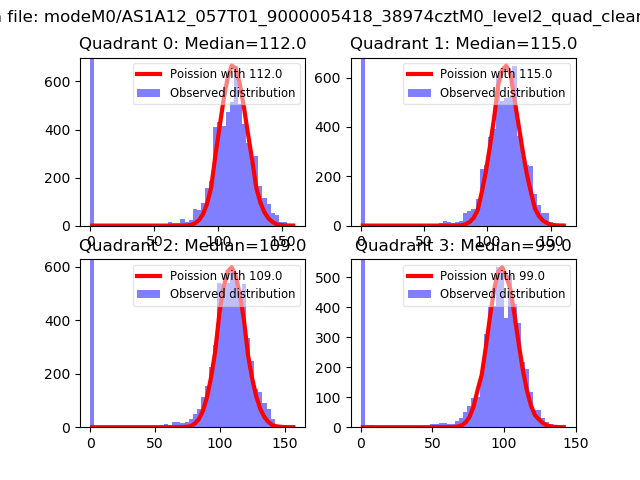 |
 |
| Quadrant-wise count rates Data is divided into 100 sec bins |
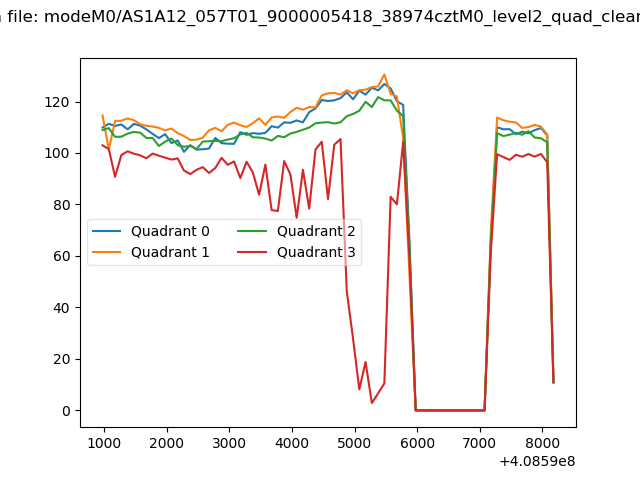 |
|
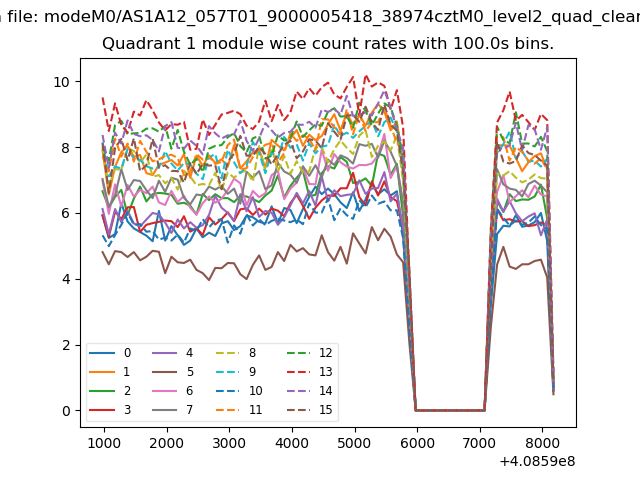
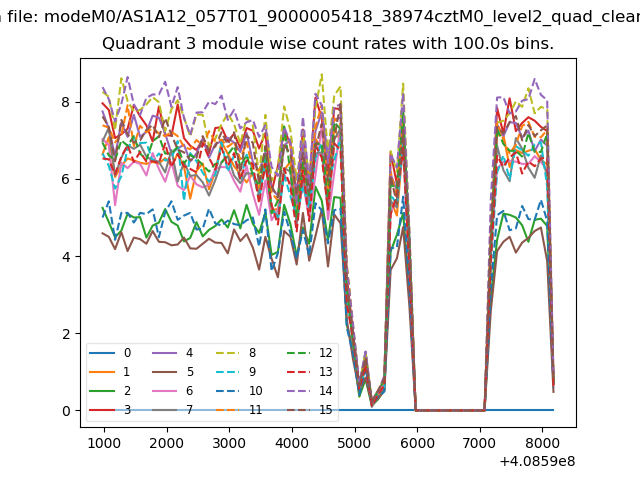
| Module-wise count rates for Quadrant A Data is divided into 100 sec bins |
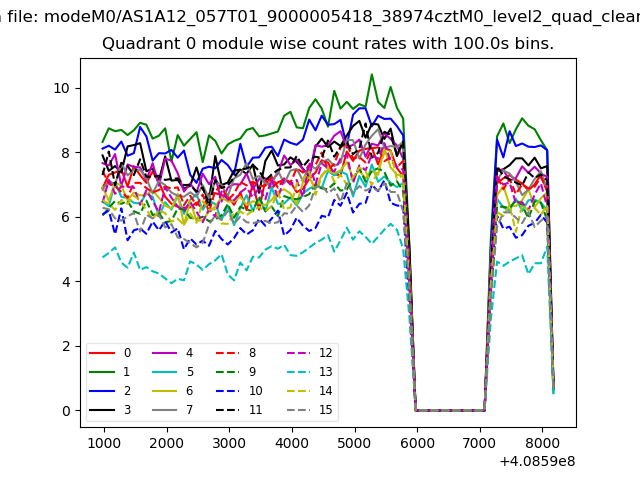 |
 |
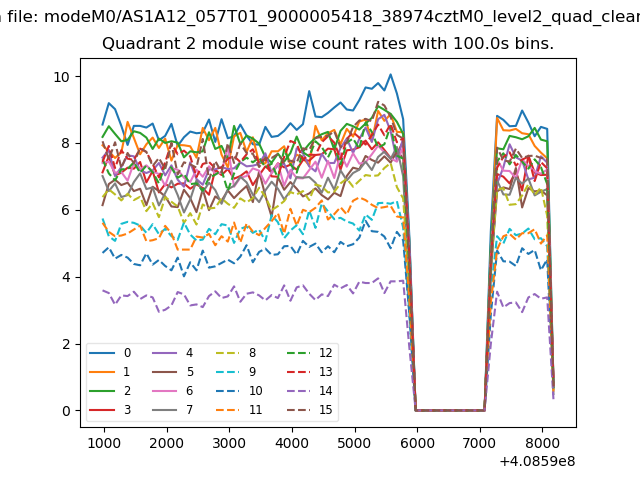
| Module-wise count rates for Quadrant B Data is divided into 100 sec bins |
 |
 |
| Module-wise count rates for Quadrant C Data is divided into 100 sec bins |
 |
 |
| Module-wise count rates for Quadrant D Data is divided into 100 sec bins |
 |
 |
| Parameter | Plot |
|---|---|
| CZT HV Monitor | 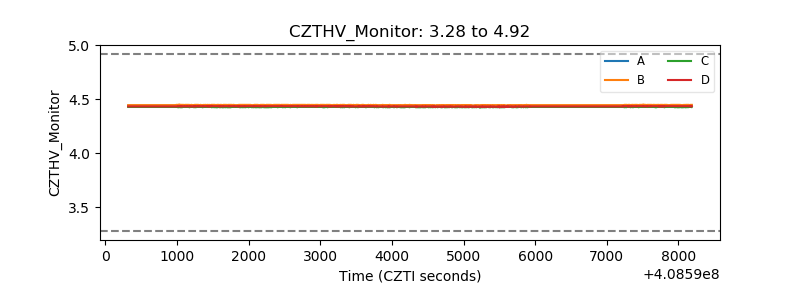 |
| D_VDD | 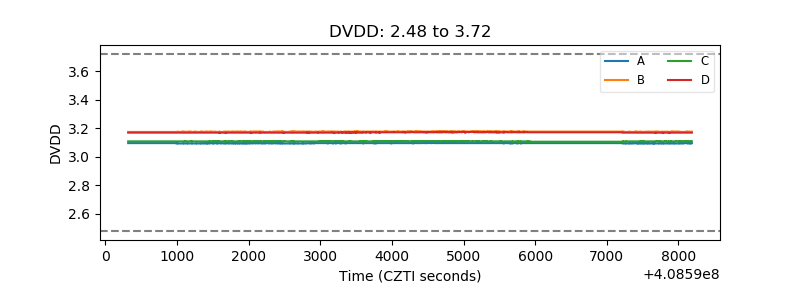 |
| Temperature 1 | 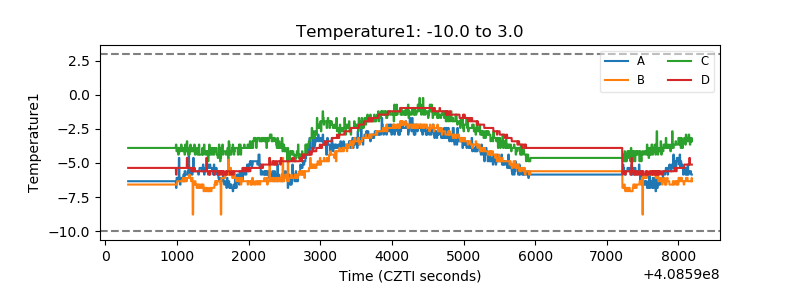 |
| Veto HV Monitor | 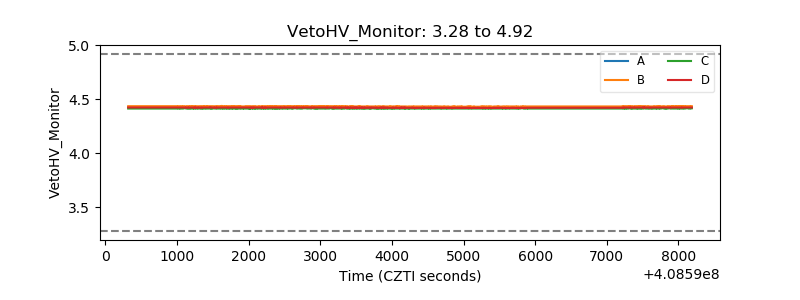 |
| Veto LLD | 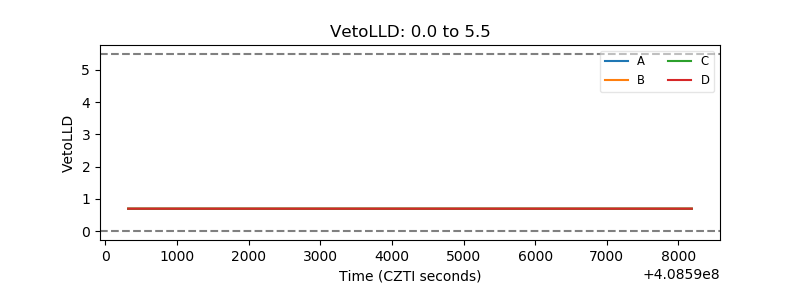 |
| Alpha Counter | 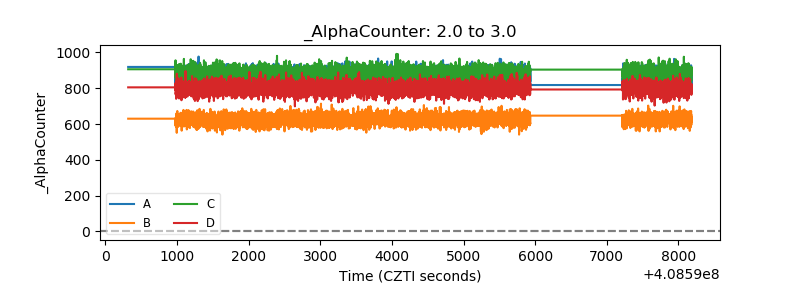 |
| _CPM_Rate | 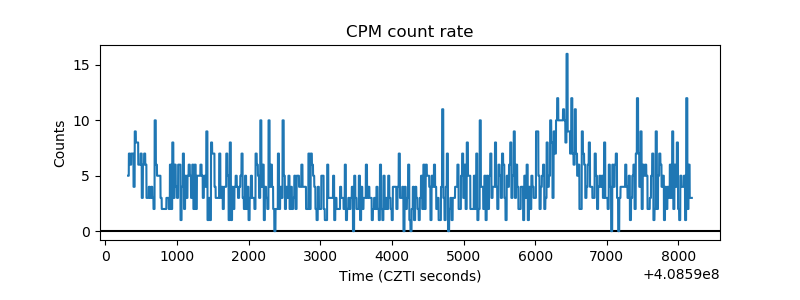 |
| CZT Counter | 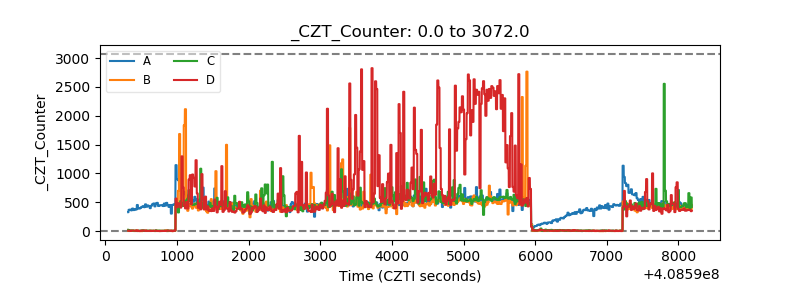 |
| +2.5 Volts monitor | 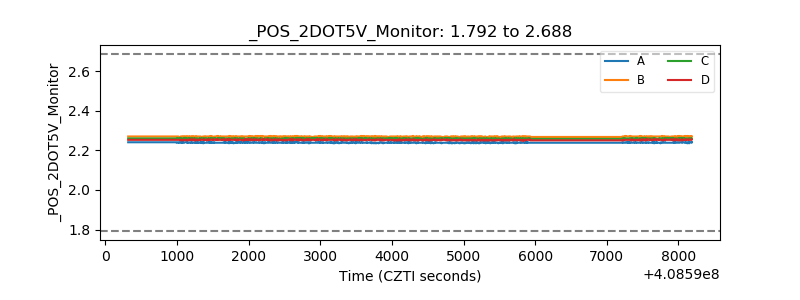 |
| +5 Volts monitor | 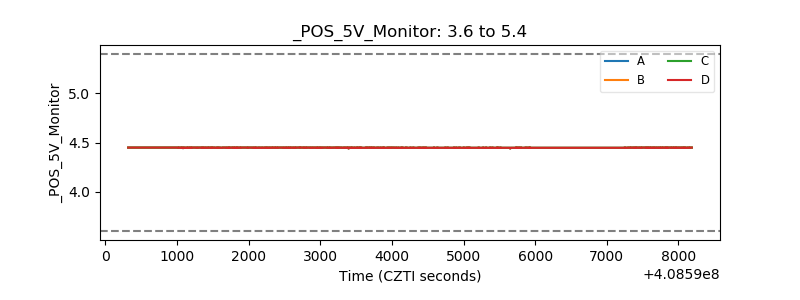 |
| _ROLL_ROT | 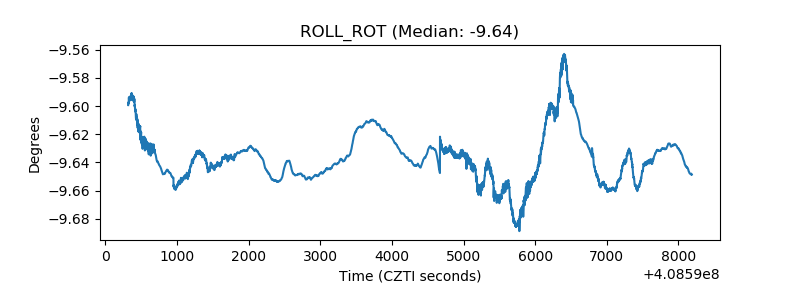 |
| _Roll_DEC | 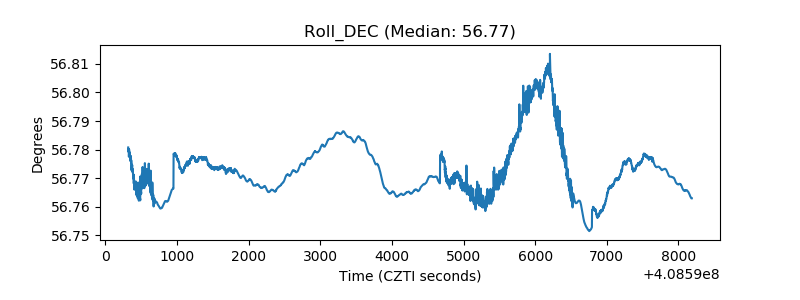 |
| _Roll_RA | 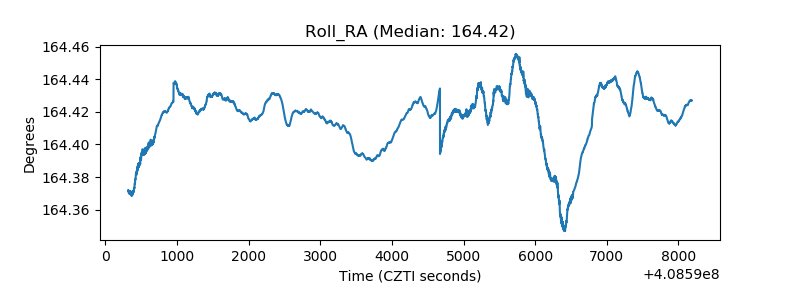 |
| Veto Counter | 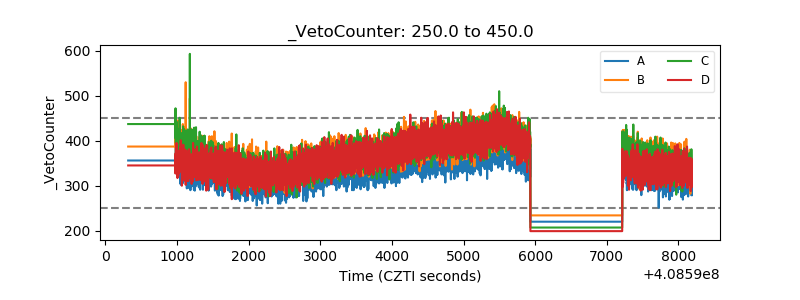 |