| Param | Original file | Final file |
|---|---|---|
| Filename | modeM0/AS1A12_057T01_9000005418_38977cztM0_level2.fits | modeM0/AS1A12_057T01_9000005418_38977cztM0_level2_quad_clean.evt |
| Size (bytes) | 999,216,000 | 259,009,920 |
| Size | 952.9 MB | 247.0 MB |
| Events in quadrant A | 8,332,825 | 1,746,748 |
| Events in quadrant B | 8,102,394 | 1,774,876 |
| Events in quadrant C | 9,030,289 | 1,681,277 |
| Events in quadrant D | 10,291,949 | 1,543,237 |
| Mode M9 | |||
|---|---|---|---|
| Quadrant | BADHDUFLAG | Total packets | Discarded packets |
| A | 0 | 55 | 0 |
| B | 0 | 55 | 0 |
| C | 0 | 55 | 0 |
| D | 0 | 55 | 0 |
| Mode SS | |||
|---|---|---|---|
| Quadrant | BADHDUFLAG | Total packets | Discarded packets |
| A | 0 | 326 | 0 |
| B | 0 | 326 | 0 |
| C | 0 | 326 | 0 |
| D | 0 | 326 | 0 |
| Mode M0 | |||
|---|---|---|---|
| Quadrant | BADHDUFLAG | Total packets | Discarded packets |
| A | 0 | 34126 | 4 |
| B | 0 | 34873 | 3 |
| C | 0 | 36848 | 3 |
| D | 0 | 41584 | 3 |
| Quadrant | Total seconds | Saturated seconds | Saturation percentage |
|---|---|---|---|
| A | 15887 | 50 | 0.314723% |
| B | 15887 | 296 | 1.863159% |
| C | 15887 | 327 | 2.058287% |
| D | 15887 | 462 | 2.908038% |
Noise dominated data is calculated using 1-second bins in cleaned event files. If a bin has >2000 counts, and if more than 50% of those come from <1% of pixels, then it is considered to be noise-dominated and hence unusable.
| Quadrant | # 1 sec bins | Bins with >0 counts | Bins with >2000 counts | High rate bins dominated by noise | Noise dominated (total time) | Noise dominated (detector-on time) | Marked lightcurve |
|---|---|---|---|---|---|---|---|
| A | 21349 | 15891 | 29 | 29 | 0.14% | 0.18% | 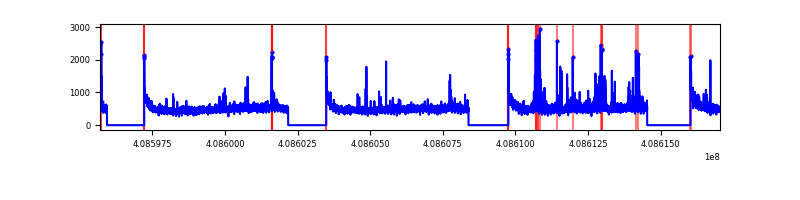 |
| B | 21349 | 15891 | 219 | 219 | 1.03% | 1.38% | 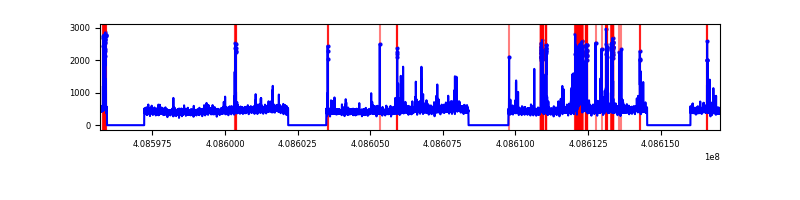 |
| C | 21349 | 15891 | 298 | 298 | 1.40% | 1.88% | 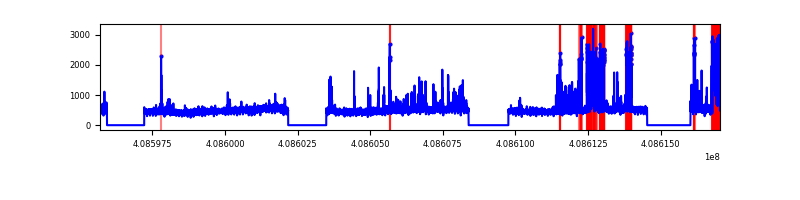 |
| D | 21349 | 15891 | 445 | 445 | 2.08% | 2.80% | 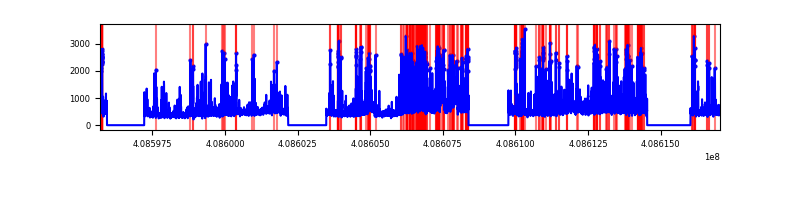 |
Top three noisy pixels from each quadrant. If the there are fewer than three noisy pixels in the level2.evt file, extra rows are filled as -1
| Pixel properties | Quadrant properties | ||||||
|---|---|---|---|---|---|---|---|
| Quadrant | DetID | PixID | Counts | Sigma | Mean | Median | Sigma |
| A | 10 | 83 | 1084896 | 3030.75 | 1777 | 1745 | 357.4 |
| A | 9 | 143 | 137848 | 380.83 | 1777 | 1745 | 357.4 |
| A | 13 | 248 | 134041 | 370.18 | 1777 | 1745 | 357.4 |
| B | 5 | 172 | 944865 | 2789.37 | 1757 | 1706 | 338.1 |
| B | 15 | 85 | 73089 | 211.11 | 1757 | 1706 | 338.1 |
| B | 0 | 230 | 59208 | 170.06 | 1757 | 1706 | 338.1 |
| C | 14 | 254 | 1570368 | 3956.29 | 1719 | 1727 | 396.5 |
| C | 15 | 214 | 690015 | 1735.94 | 1719 | 1727 | 396.5 |
| C | 12 | 249 | 19849 | 45.7 | 1719 | 1727 | 396.5 |
| D | 12 | 227 | 1035106 | 2496.75 | 1710 | 1664 | 413.9 |
| D | 12 | 235 | 682866 | 1645.75 | 1710 | 1664 | 413.9 |
| D | 2 | 249 | 651434 | 1569.81 | 1710 | 1664 | 413.9 |
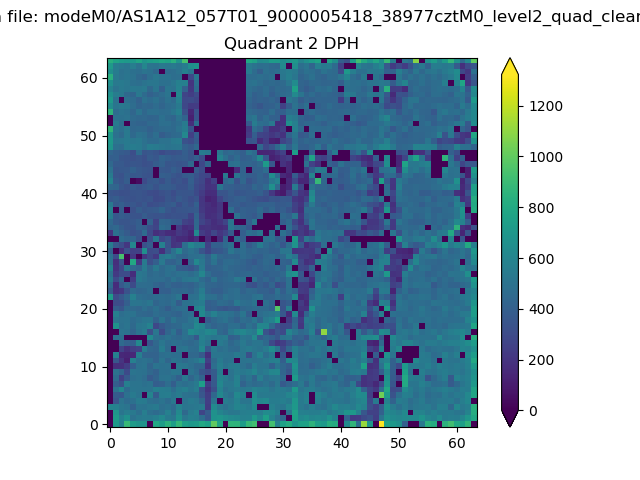
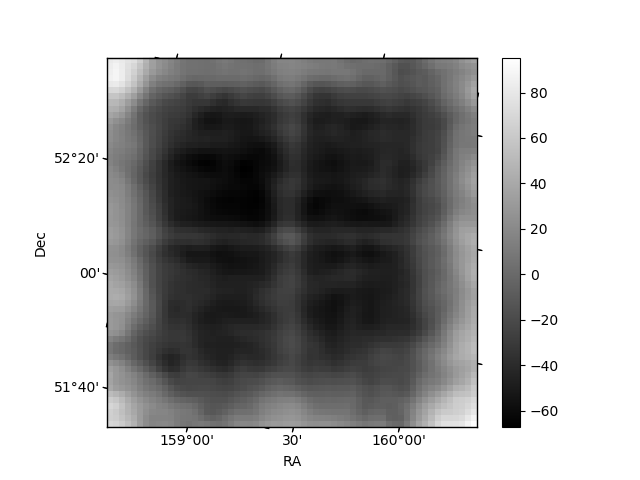
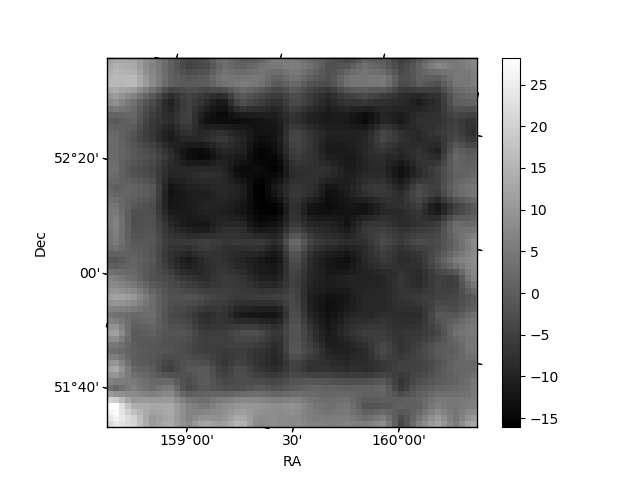
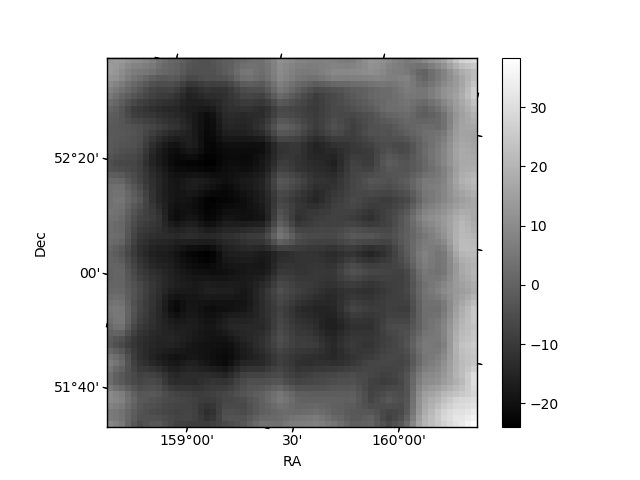
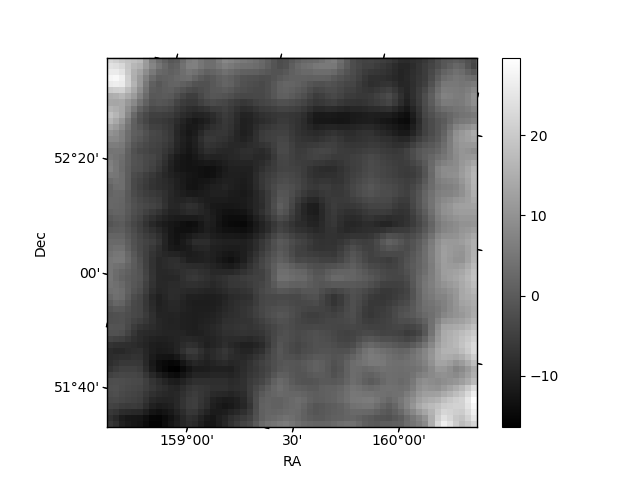
Histogram calculated using DETX and DETY for each event in the final _common_clean file
| Quadrant A | 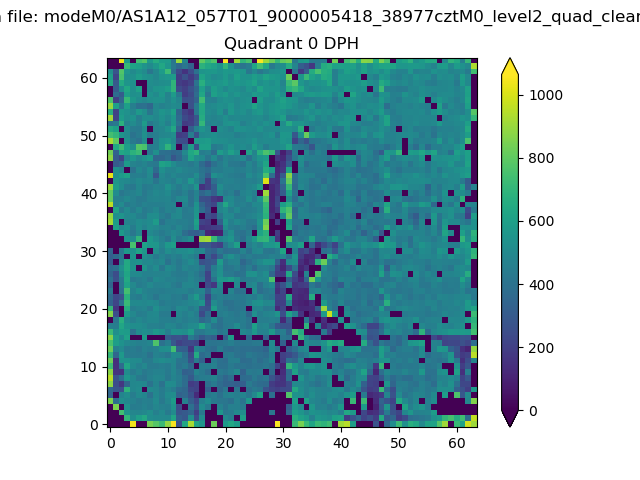 |
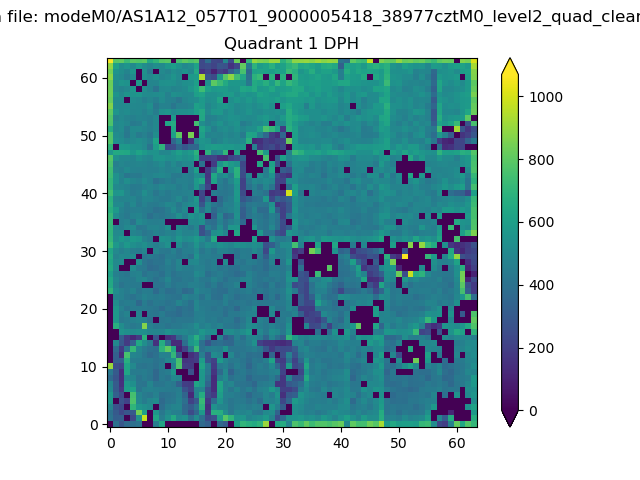 |
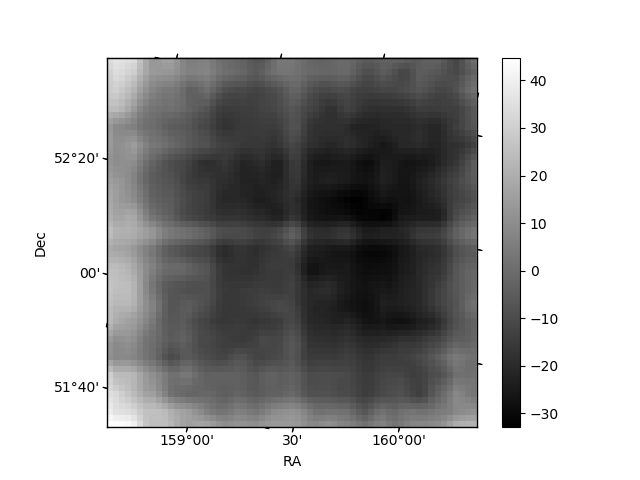
Quadrant B |
|---|---|---|---|
| Quadrant D | 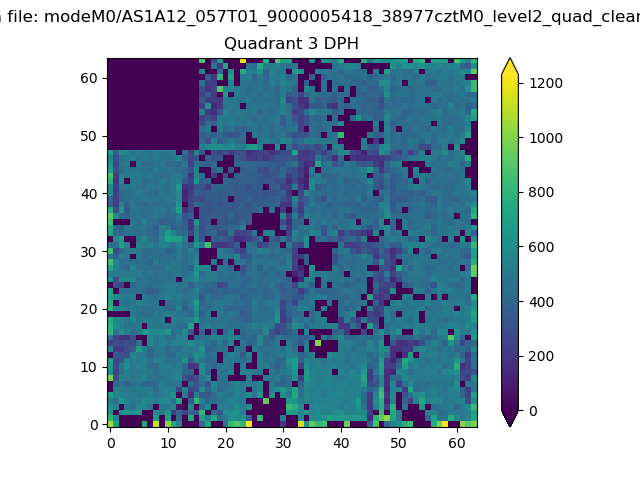 |
 |
Quadrant C |
| Plot type | Count rate plots | Images |
|---|---|---|
| Comparison with Poisson distribution Blue bars denote a histogram of data divided into 1 sec bins. Red curve is a Poisson curve with rate = median count rate of data. |
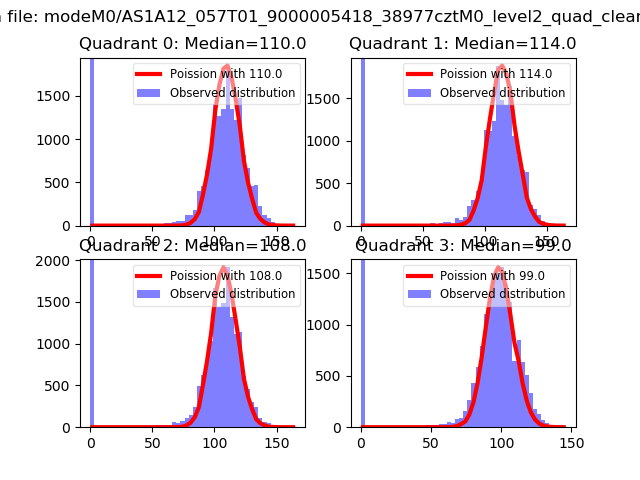 |
 |
| Quadrant-wise count rates Data is divided into 100 sec bins |
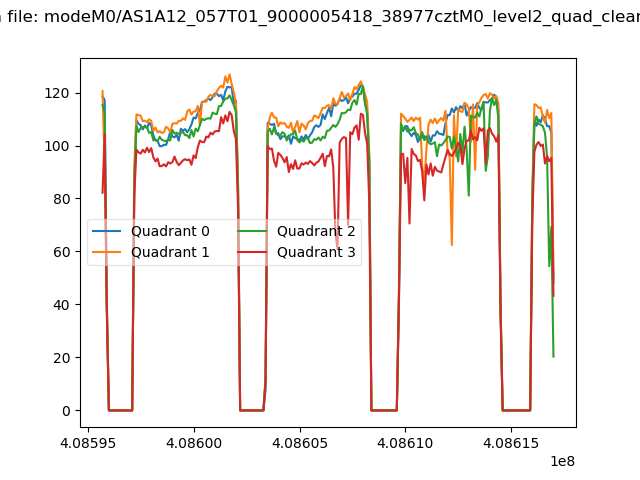 |
|
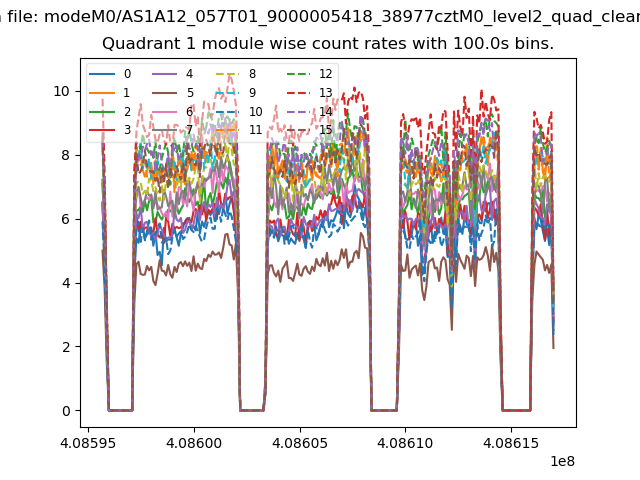
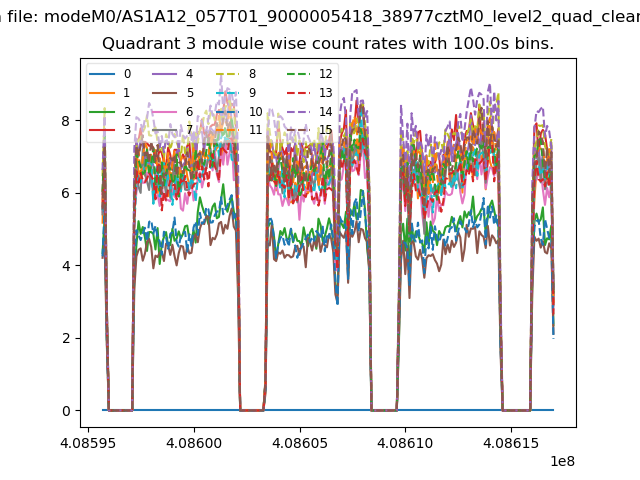
| Module-wise count rates for Quadrant A Data is divided into 100 sec bins |
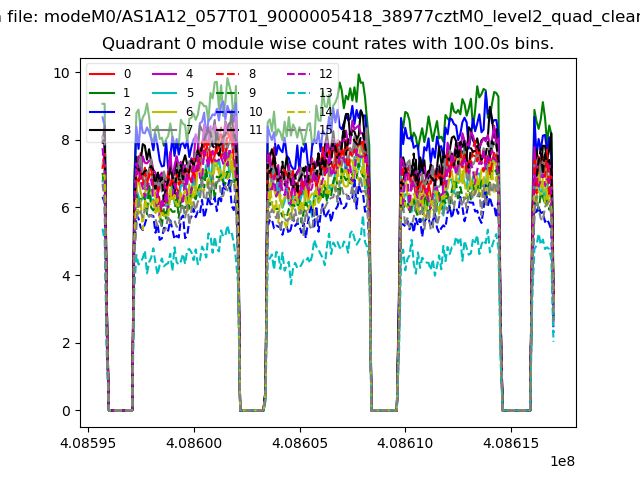 |
 |
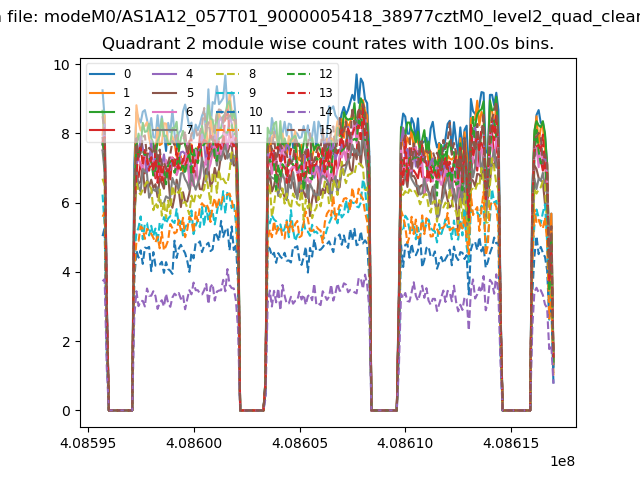
| Module-wise count rates for Quadrant B Data is divided into 100 sec bins |
 |
 |
| Module-wise count rates for Quadrant C Data is divided into 100 sec bins |
 |
 |
| Module-wise count rates for Quadrant D Data is divided into 100 sec bins |
 |
 |
| Parameter | Plot |
|---|---|
| CZT HV Monitor | 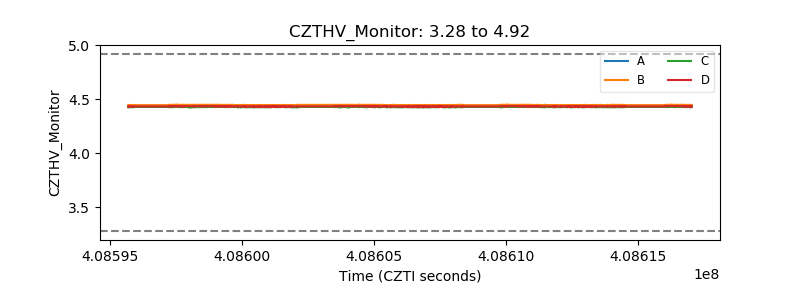 |
| D_VDD | 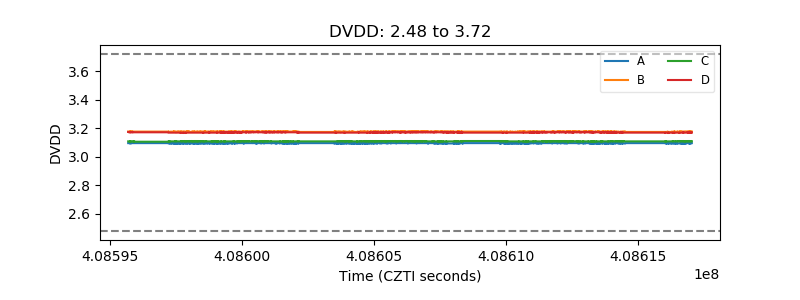 |
| Temperature 1 | 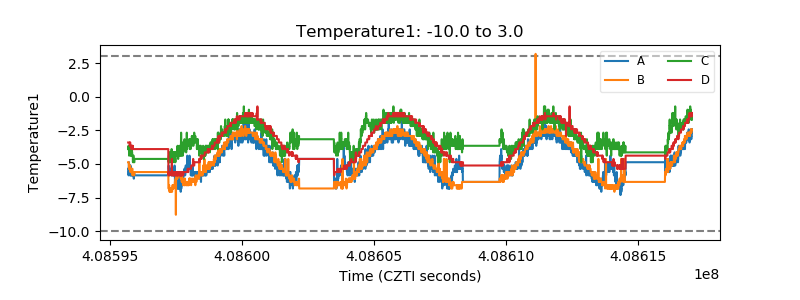 |
| Veto HV Monitor | 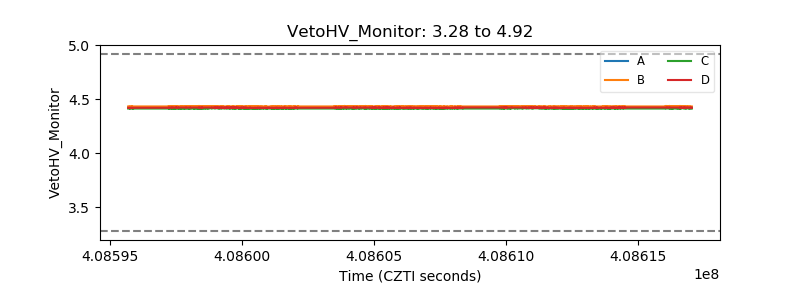 |
| Veto LLD | 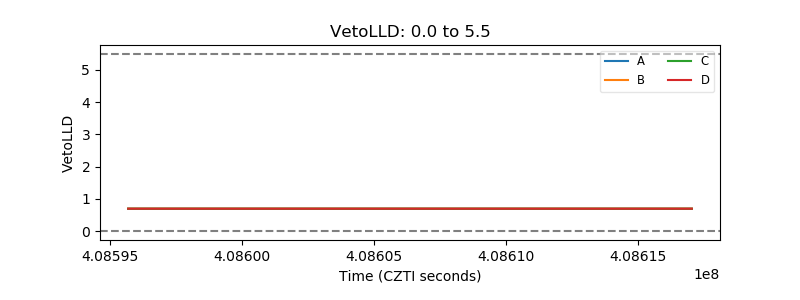 |
| Alpha Counter | 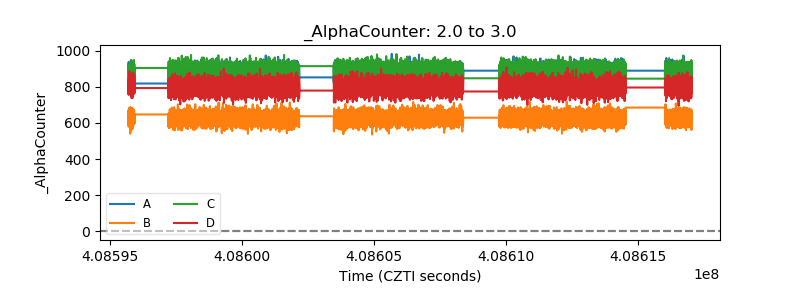 |
| _CPM_Rate | 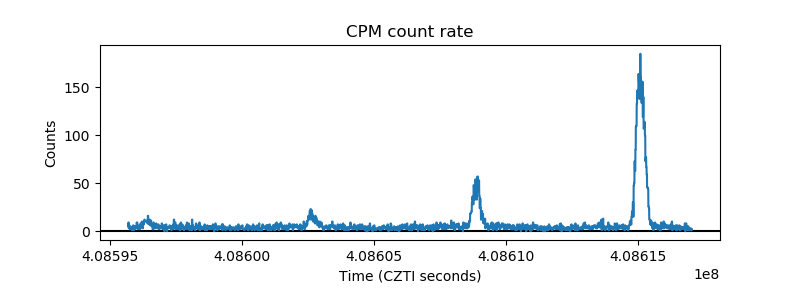 |
| CZT Counter | 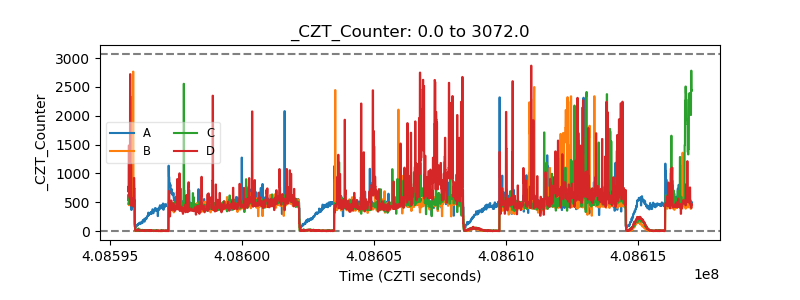 |
| +2.5 Volts monitor | 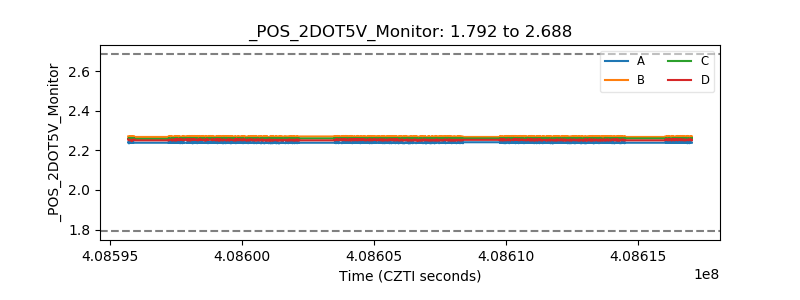 |
| +5 Volts monitor | 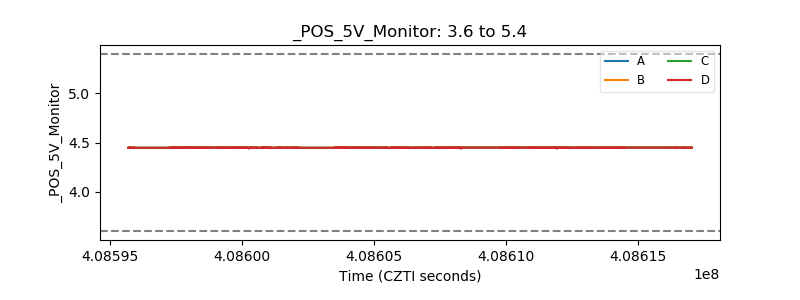 |
| _ROLL_ROT | 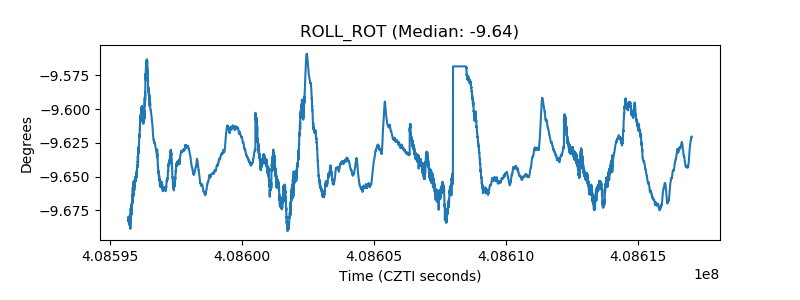 |
| _Roll_DEC | 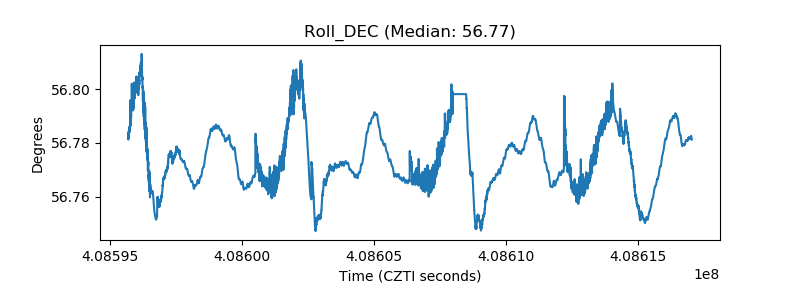 |
| _Roll_RA | 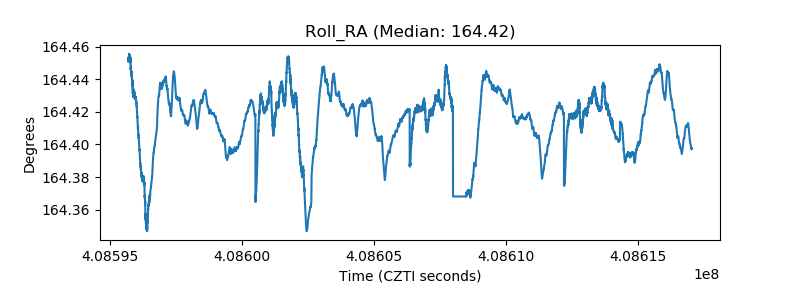 |
| Veto Counter | 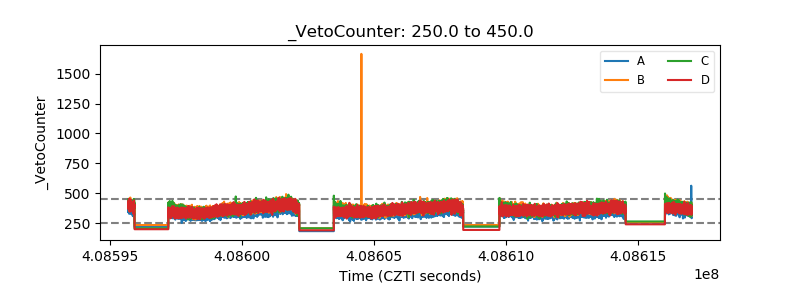 |