| Param | Original file | Final file |
|---|---|---|
| Filename | modeM0/AS1A12_057T01_9000005418_38978cztM0_level2.fits | modeM0/AS1A12_057T01_9000005418_38978cztM0_level2_quad_clean.evt |
| Size (bytes) | 417,836,160 | 88,706,880 |
| Size | 398.5 MB | 84.6 MB |
| Events in quadrant A | 3,299,791 | 606,752 |
| Events in quadrant B | 2,870,867 | 618,703 |
| Events in quadrant C | 3,960,987 | 572,087 |
| Events in quadrant D | 4,912,908 | 507,625 |
| Mode M9 | |||
|---|---|---|---|
| Quadrant | BADHDUFLAG | Total packets | Discarded packets |
| A | 0 | 16 | 0 |
| B | 0 | 16 | 0 |
| C | 0 | 16 | 0 |
| D | 0 | 16 | 0 |
| Mode SS | |||
|---|---|---|---|
| Quadrant | BADHDUFLAG | Total packets | Discarded packets |
| A | 0 | 112 | 0 |
| B | 0 | 112 | 0 |
| C | 0 | 112 | 0 |
| D | 0 | 112 | 0 |
| Mode M0 | |||
|---|---|---|---|
| Quadrant | BADHDUFLAG | Total packets | Discarded packets |
| A | 0 | 13129 | 2 |
| B | 0 | 12053 | 1 |
| C | 0 | 15207 | 1 |
| D | 0 | 18398 | 1 |
| Quadrant | Total seconds | Saturated seconds | Saturation percentage |
|---|---|---|---|
| A | 5434 | 91 | 1.674641% |
| B | 5434 | 102 | 1.877070% |
| C | 5434 | 271 | 4.987118% |
| D | 5434 | 498 | 9.164520% |
Noise dominated data is calculated using 1-second bins in cleaned event files. If a bin has >2000 counts, and if more than 50% of those come from <1% of pixels, then it is considered to be noise-dominated and hence unusable.
| Quadrant | # 1 sec bins | Bins with >0 counts | Bins with >2000 counts | High rate bins dominated by noise | Noise dominated (total time) | Noise dominated (detector-on time) | Marked lightcurve |
|---|---|---|---|---|---|---|---|
| A | 7047 | 5435 | 90 | 90 | 1.28% | 1.66% | 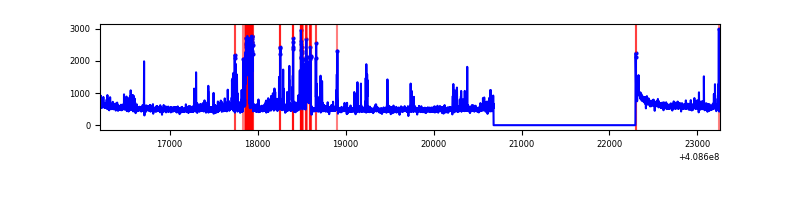 |
| B | 7047 | 5435 | 82 | 82 | 1.16% | 1.51% |  |
| C | 7047 | 5435 | 281 | 281 | 3.99% | 5.17% | 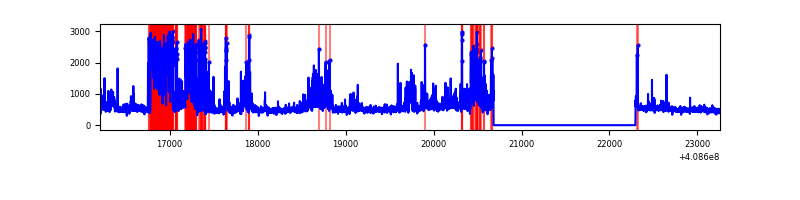 |
| D | 7047 | 5435 | 508 | 508 | 7.21% | 9.35% |  |
Top three noisy pixels from each quadrant. If the there are fewer than three noisy pixels in the level2.evt file, extra rows are filled as -1
| Pixel properties | Quadrant properties | ||||||
|---|---|---|---|---|---|---|---|
| Quadrant | DetID | PixID | Counts | Sigma | Mean | Median | Sigma |
| A | 13 | 248 | 390509 | 3116.95 | 612 | 598 | 125.1 |
| A | 10 | 83 | 371859 | 2967.86 | 612 | 598 | 125.1 |
| A | 15 | 222 | 139730 | 1112.22 | 612 | 598 | 125.1 |
| B | 5 | 172 | 420327 | 3554.64 | 605 | 589 | 118.1 |
| B | 0 | 230 | 47523 | 397.47 | 605 | 589 | 118.1 |
| B | 12 | 111 | 14710 | 119.59 | 605 | 589 | 118.1 |
| C | 14 | 254 | 1391761 | 10132.64 | 588 | 591 | 137.3 |
| C | 15 | 214 | 235978 | 1714.45 | 588 | 591 | 137.3 |
| C | 12 | 249 | 26849 | 191.25 | 588 | 591 | 137.3 |
| D | 12 | 233 | 544653 | 3877.84 | 577 | 560 | 140.3 |
| D | 12 | 235 | 537506 | 3826.9 | 577 | 560 | 140.3 |
| D | 14 | 52 | 515272 | 3668.44 | 577 | 560 | 140.3 |
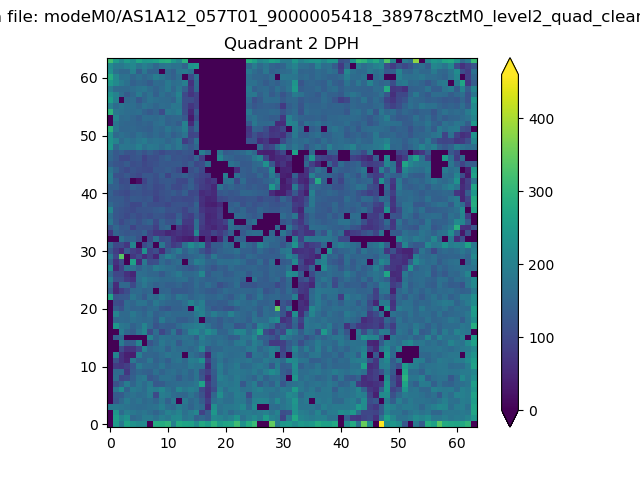
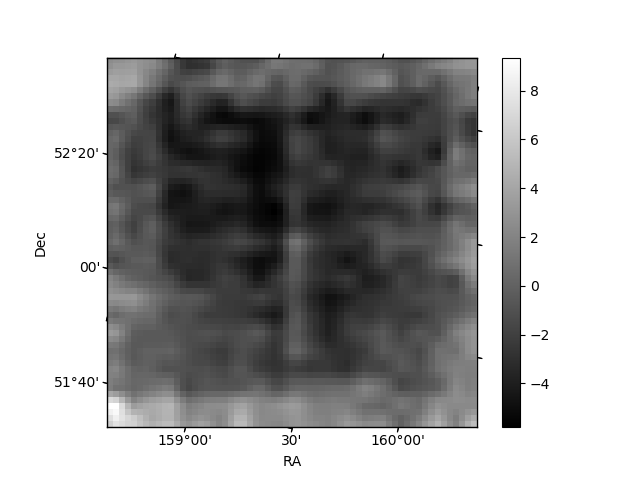
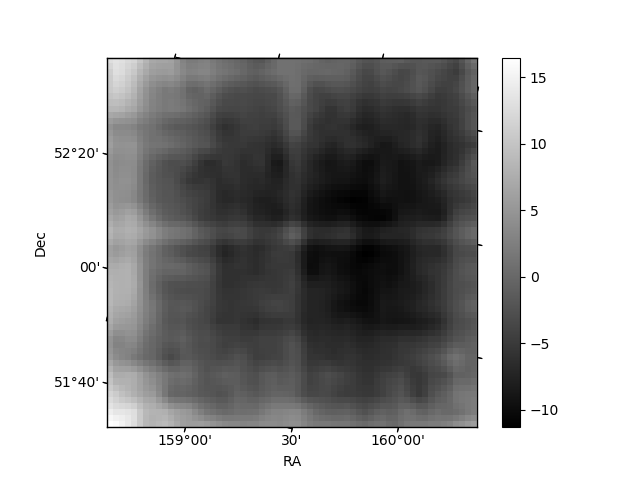
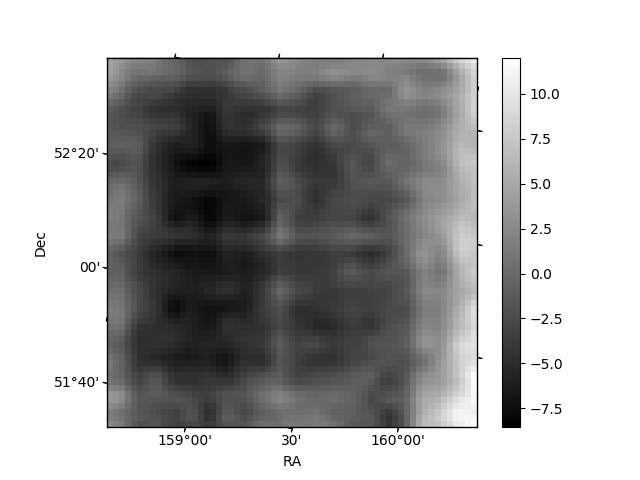
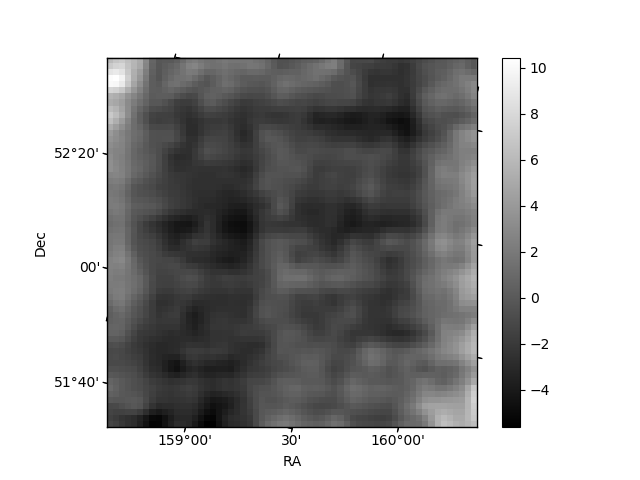
Histogram calculated using DETX and DETY for each event in the final _common_clean file
| Quadrant A | 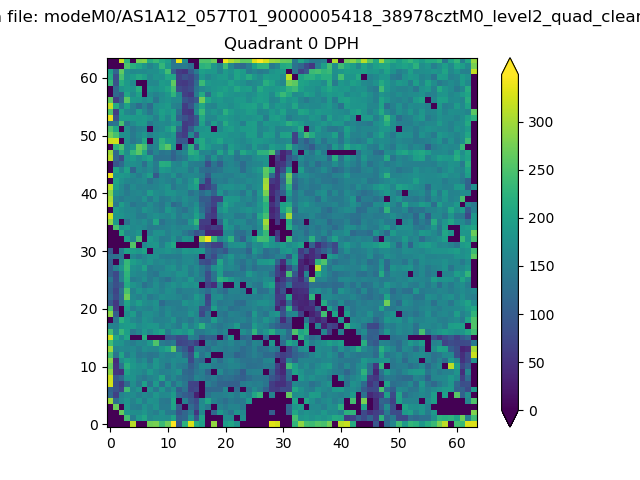 |
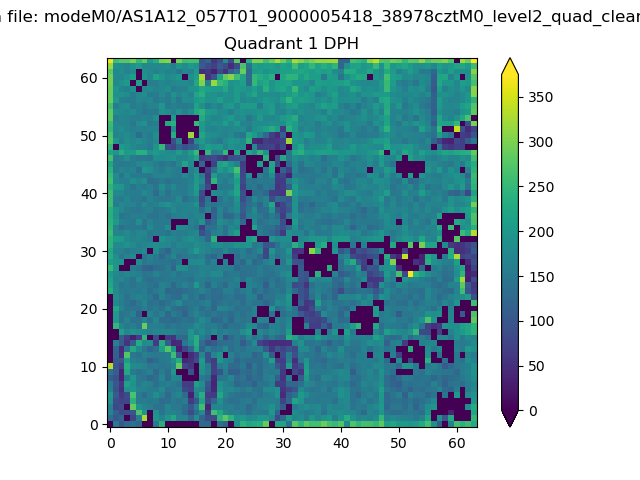 |
Quadrant B |
|---|---|---|---|
| Quadrant D | 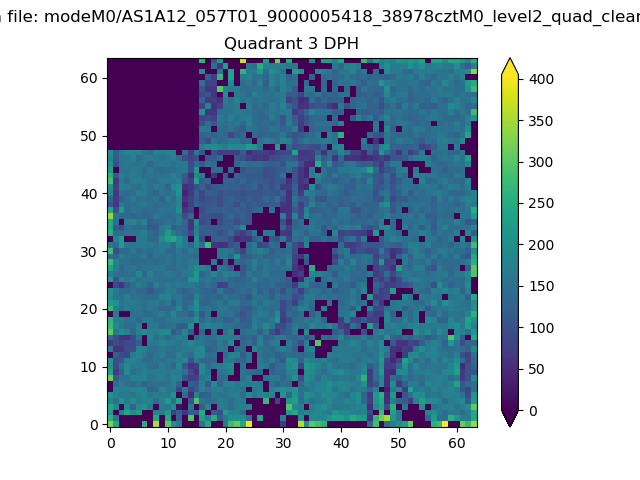 |
 |
Quadrant C |
| Plot type | Count rate plots | Images |
|---|---|---|
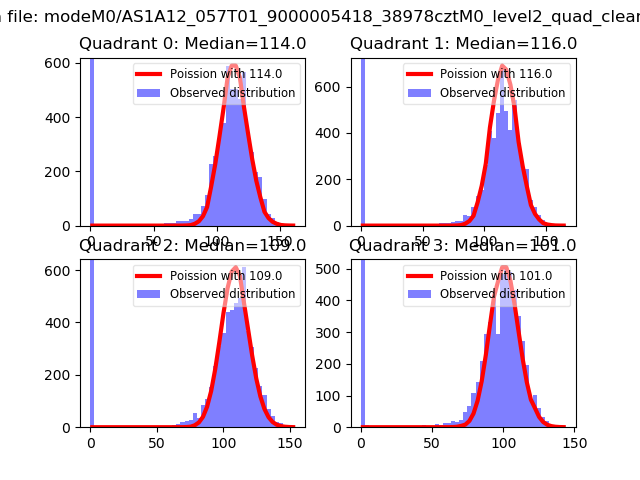
| Comparison with Poisson distribution Blue bars denote a histogram of data divided into 1 sec bins. Red curve is a Poisson curve with rate = median count rate of data. |
 |
 |
| Quadrant-wise count rates Data is divided into 100 sec bins |
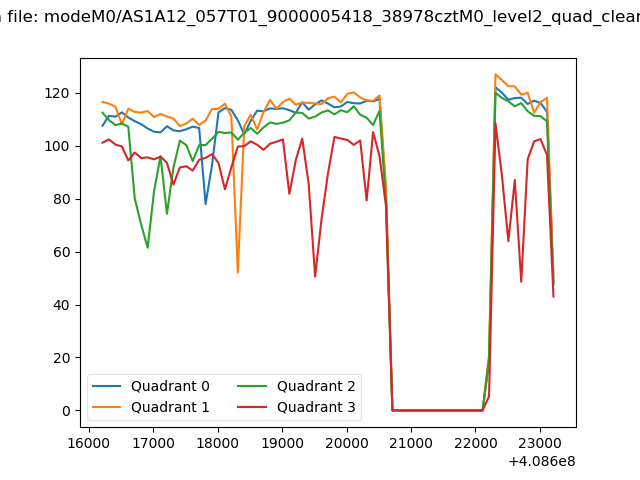 |
|
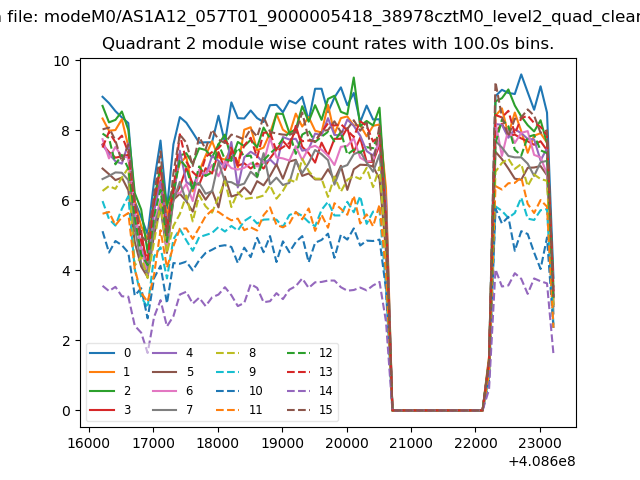
| Module-wise count rates for Quadrant A Data is divided into 100 sec bins |
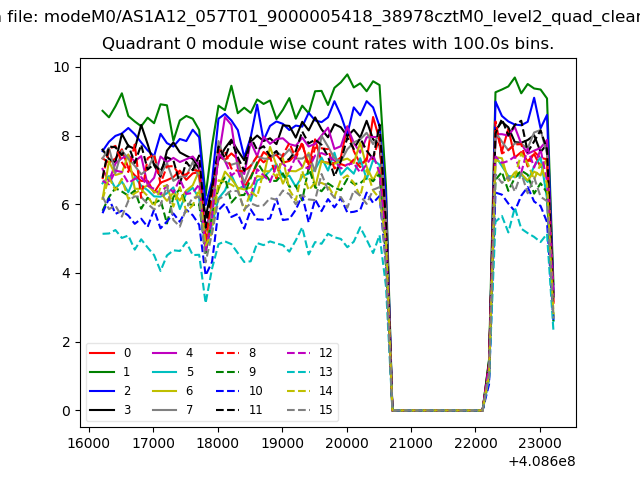 |
 |
| Module-wise count rates for Quadrant B Data is divided into 100 sec bins |
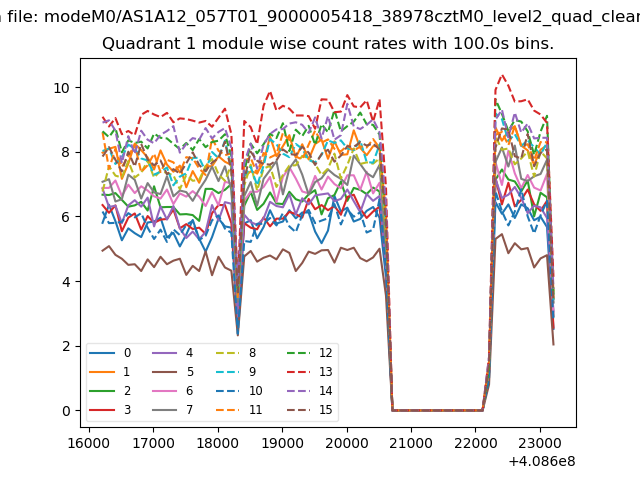 |
 |
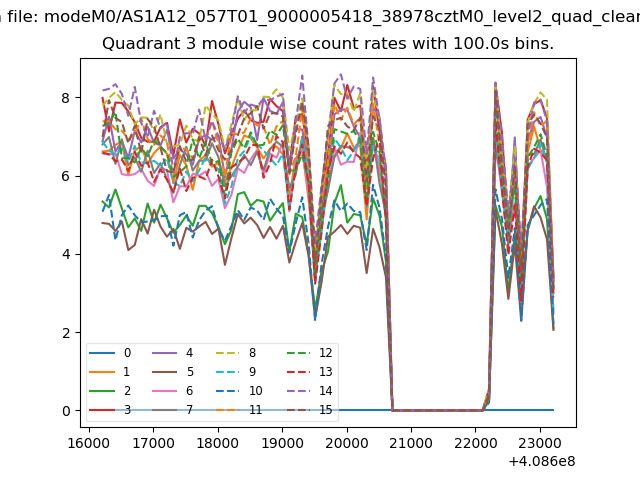
| Module-wise count rates for Quadrant C Data is divided into 100 sec bins |
 |
 |
| Module-wise count rates for Quadrant D Data is divided into 100 sec bins |
 |
 |
| Parameter | Plot |
|---|---|
| CZT HV Monitor | 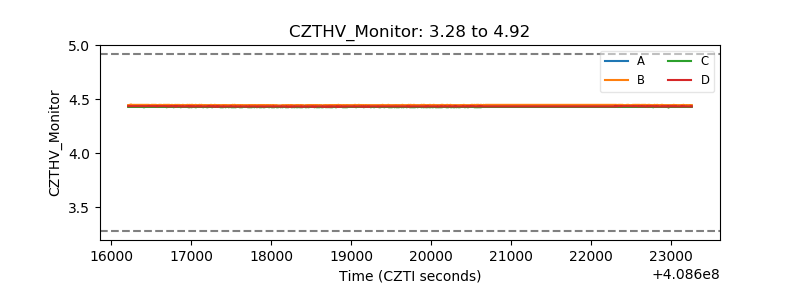 |
| D_VDD | 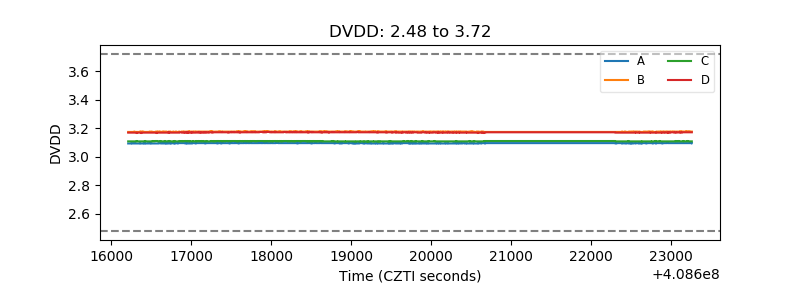 |
| Temperature 1 | 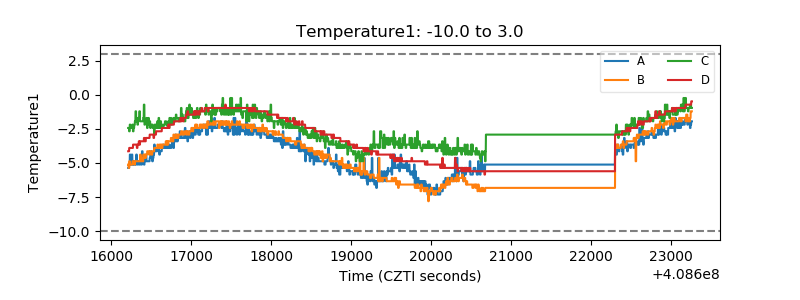 |
| Veto HV Monitor | 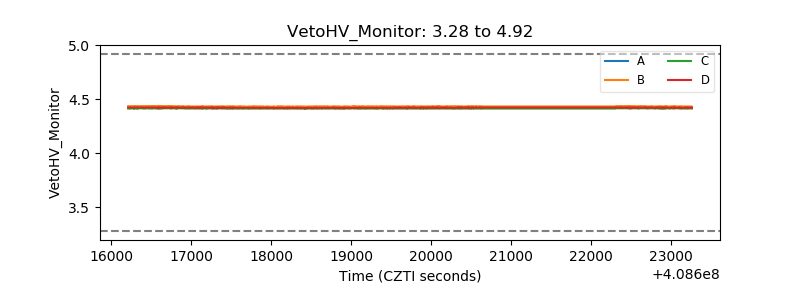 |
| Veto LLD | 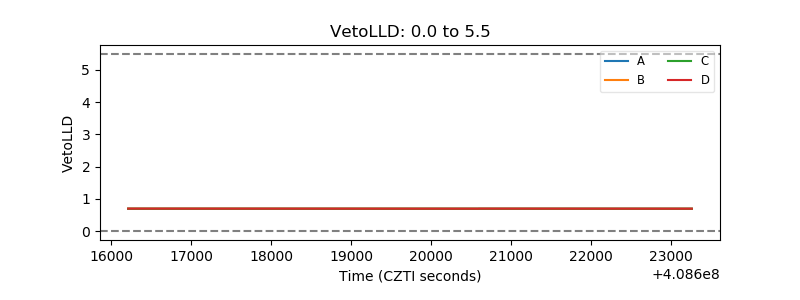 |
| Alpha Counter | 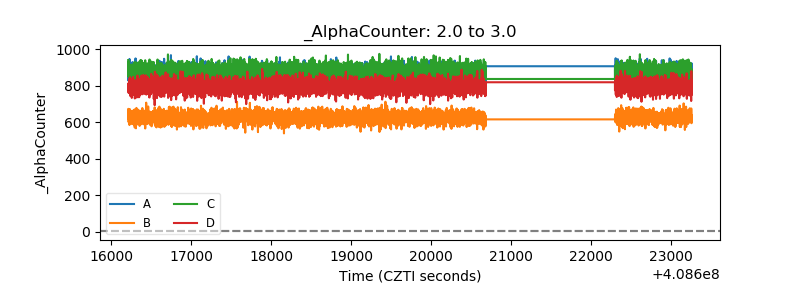 |
| _CPM_Rate | 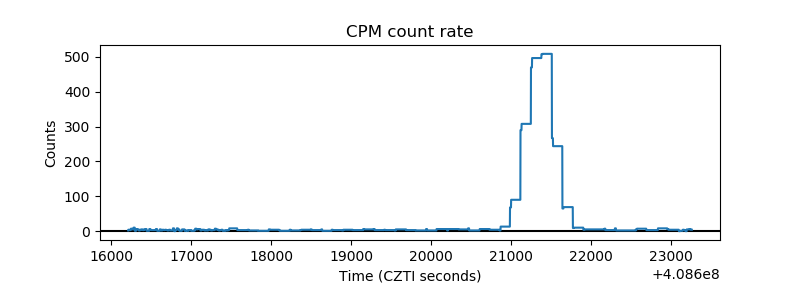 |
| CZT Counter | 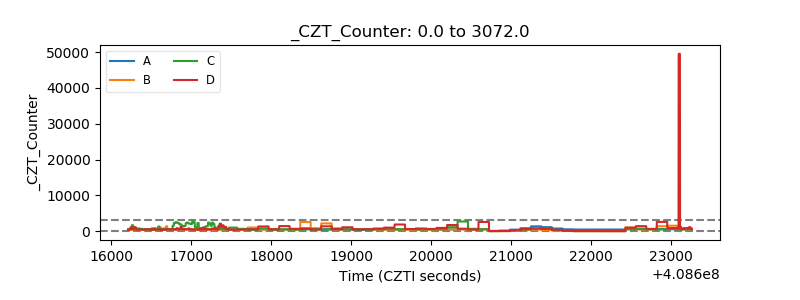 |
| +2.5 Volts monitor | 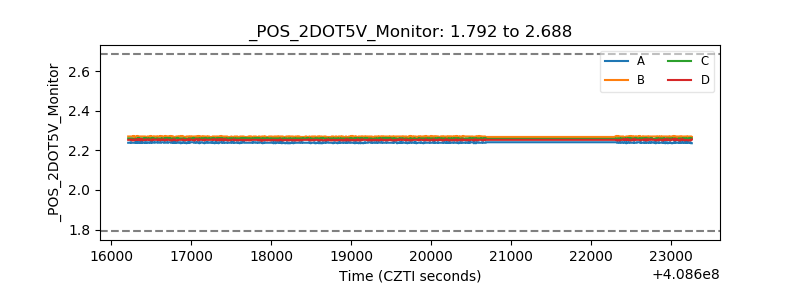 |
| +5 Volts monitor |  |
| _ROLL_ROT | 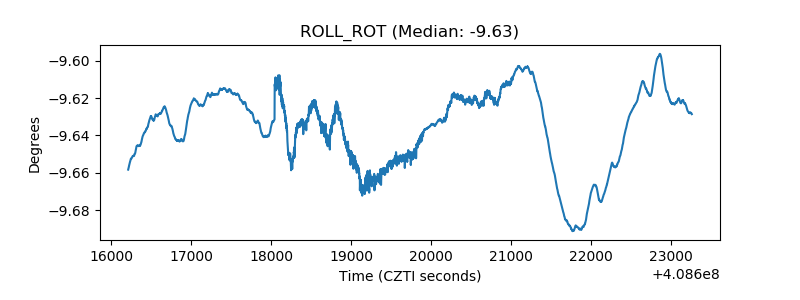 |
| _Roll_DEC | 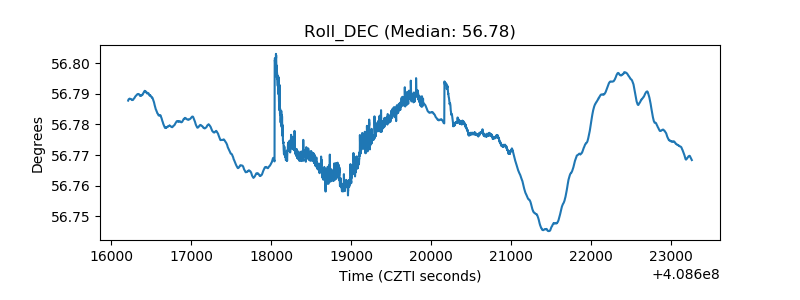 |
| _Roll_RA | 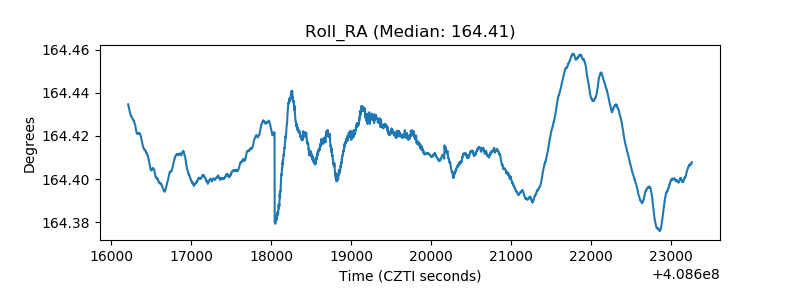 |
| Veto Counter | 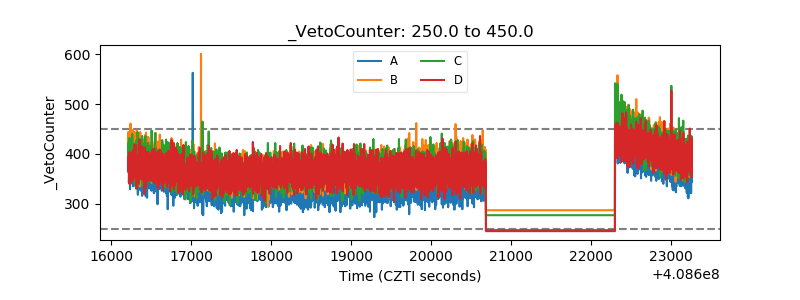 |