| Param | Original file | Final file |
|---|---|---|
| Filename | modeM0/AS1A12_057T01_9000005418_38980cztM0_level2.fits | modeM0/AS1A12_057T01_9000005418_38980cztM0_level2_quad_clean.evt |
| Size (bytes) | 409,985,280 | 93,602,880 |
| Size | 391.0 MB | 89.3 MB |
| Events in quadrant A | 3,072,842 | 650,514 |
| Events in quadrant B | 2,936,955 | 651,640 |
| Events in quadrant C | 2,717,207 | 623,735 |
| Events in quadrant D | 6,018,966 | 520,674 |
| Mode M9 | |||
|---|---|---|---|
| Quadrant | BADHDUFLAG | Total packets | Discarded packets |
| A | 0 | 19 | 0 |
| B | 0 | 19 | 0 |
| C | 0 | 19 | 0 |
| D | 0 | 20 | 0 |
| Mode SS | |||
|---|---|---|---|
| Quadrant | BADHDUFLAG | Total packets | Discarded packets |
| A | 0 | 114 | 0 |
| B | 0 | 114 | 0 |
| C | 0 | 114 | 0 |
| D | 0 | 114 | 0 |
| Mode M0 | |||
|---|---|---|---|
| Quadrant | BADHDUFLAG | Total packets | Discarded packets |
| A | 0 | 12507 | 3 |
| B | 0 | 12386 | 2 |
| C | 0 | 11298 | 2 |
| D | 0 | 21834 | 2 |
| Quadrant | Total seconds | Saturated seconds | Saturation percentage |
|---|---|---|---|
| A | 5538 | 21 | 0.379198% |
| B | 5538 | 114 | 2.058505% |
| C | 5538 | 3 | 0.054171% |
| D | 5538 | 693 | 12.513543% |
Noise dominated data is calculated using 1-second bins in cleaned event files. If a bin has >2000 counts, and if more than 50% of those come from <1% of pixels, then it is considered to be noise-dominated and hence unusable.
| Quadrant | # 1 sec bins | Bins with >0 counts | Bins with >2000 counts | High rate bins dominated by noise | Noise dominated (total time) | Noise dominated (detector-on time) | Marked lightcurve |
|---|---|---|---|---|---|---|---|
| A | 7271 | 5539 | 10 | 10 | 0.14% | 0.18% | 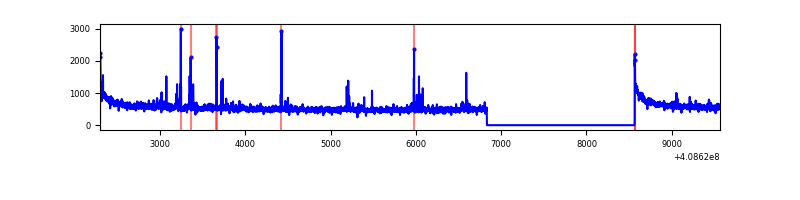 |
| B | 7271 | 5539 | 78 | 78 | 1.07% | 1.41% | 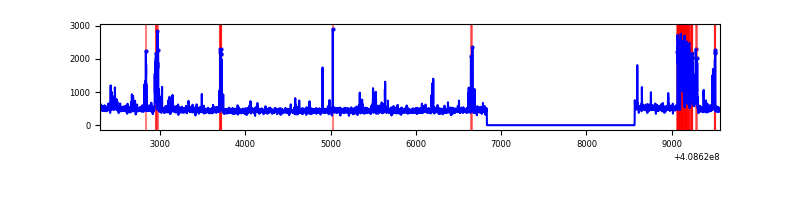 |
| C | 7271 | 5539 | 2 | 2 | 0.03% | 0.04% | 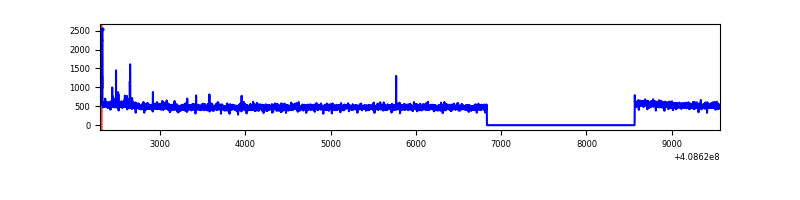 |
| D | 7271 | 5539 | 689 | 689 | 9.48% | 12.44% | 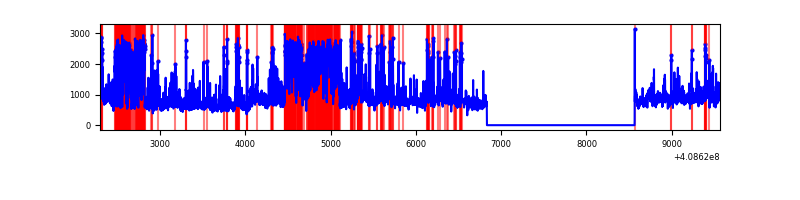 |
Top three noisy pixels from each quadrant. If the there are fewer than three noisy pixels in the level2.evt file, extra rows are filled as -1
| Pixel properties | Quadrant properties | ||||||
|---|---|---|---|---|---|---|---|
| Quadrant | DetID | PixID | Counts | Sigma | Mean | Median | Sigma |
| A | 10 | 83 | 446841 | 3455.23 | 638 | 626 | 129.1 |
| A | 15 | 222 | 64971 | 498.25 | 638 | 626 | 129.1 |
| A | 13 | 248 | 51679 | 395.32 | 638 | 626 | 129.1 |
| B | 5 | 172 | 416021 | 3417.42 | 628 | 611 | 121.6 |
| B | 15 | 32 | 22589 | 180.8 | 628 | 611 | 121.6 |
| B | 12 | 111 | 14961 | 118.05 | 628 | 611 | 121.6 |
| C | 15 | 214 | 247662 | 1711.95 | 621 | 624 | 144.3 |
| C | 14 | 254 | 27137 | 183.73 | 621 | 624 | 144.3 |
| C | 12 | 249 | 5540 | 34.07 | 621 | 624 | 144.3 |
| D | 12 | 235 | 1396925 | 9592.83 | 596 | 580 | 145.6 |
| D | 12 | 233 | 1271616 | 8731.96 | 596 | 580 | 145.6 |
| D | 12 | 227 | 362873 | 2488.94 | 596 | 580 | 145.6 |
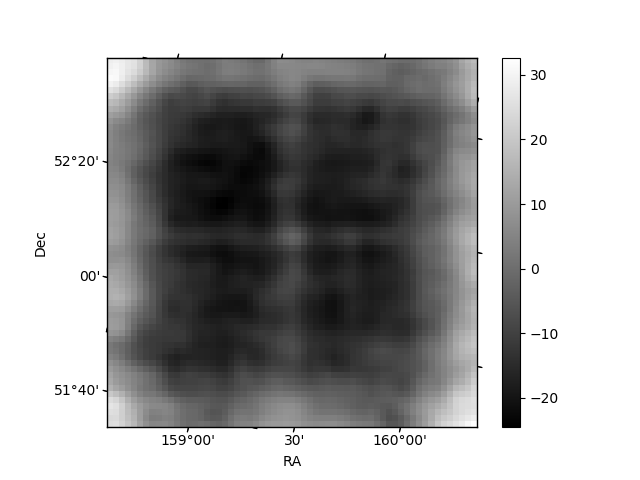
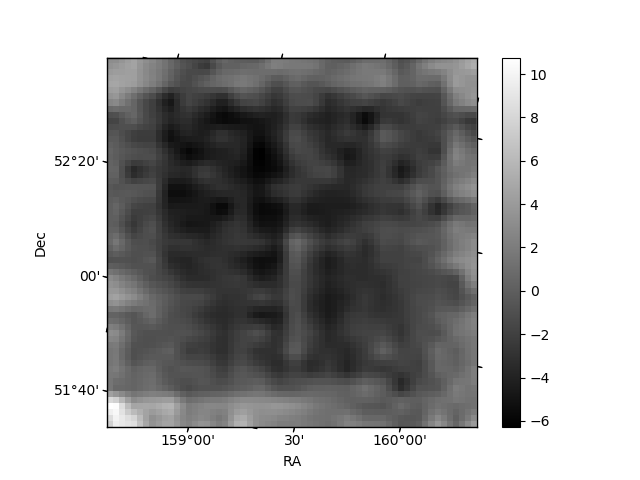
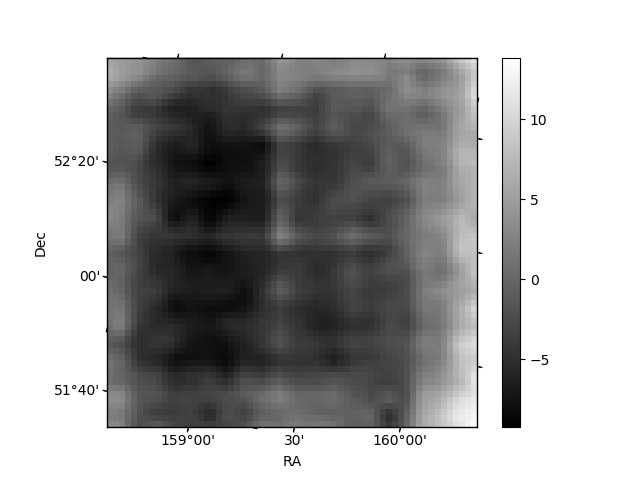
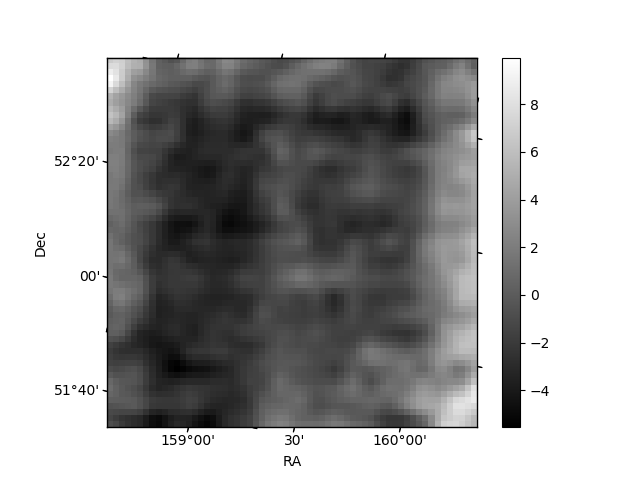
Histogram calculated using DETX and DETY for each event in the final _common_clean file
| Quadrant A | 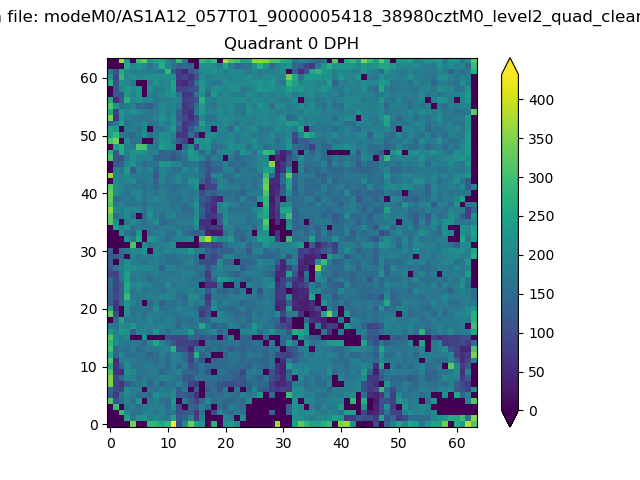 |
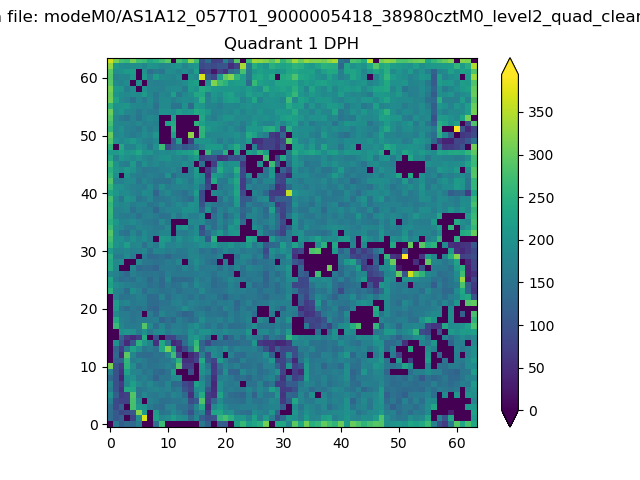 |
Quadrant B |
|---|---|---|---|
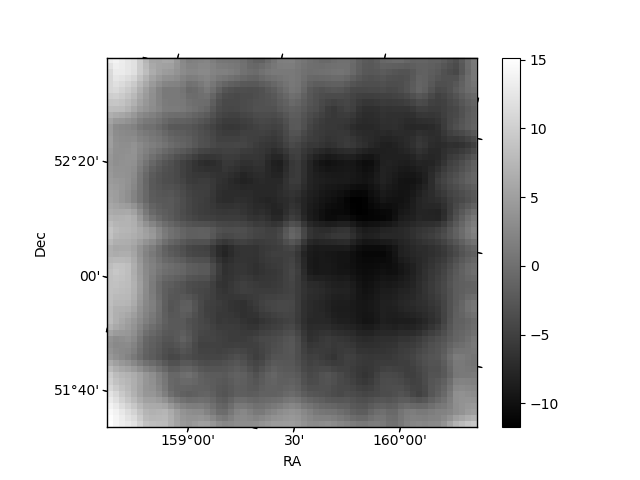
| Quadrant D | 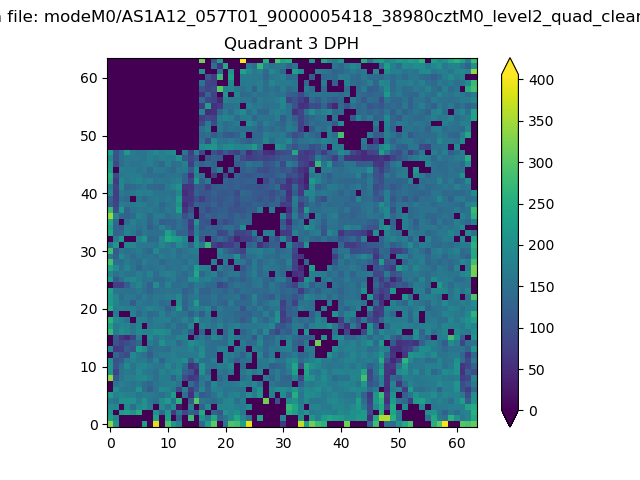 |
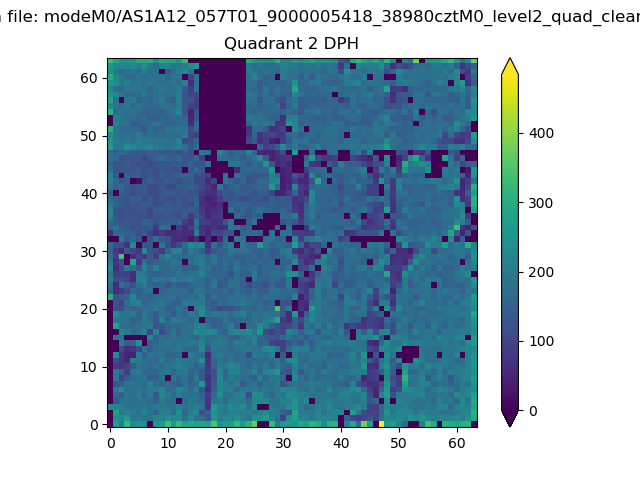 |
Quadrant C |
| Plot type | Count rate plots | Images |
|---|---|---|
| Comparison with Poisson distribution Blue bars denote a histogram of data divided into 1 sec bins. Red curve is a Poisson curve with rate = median count rate of data. |
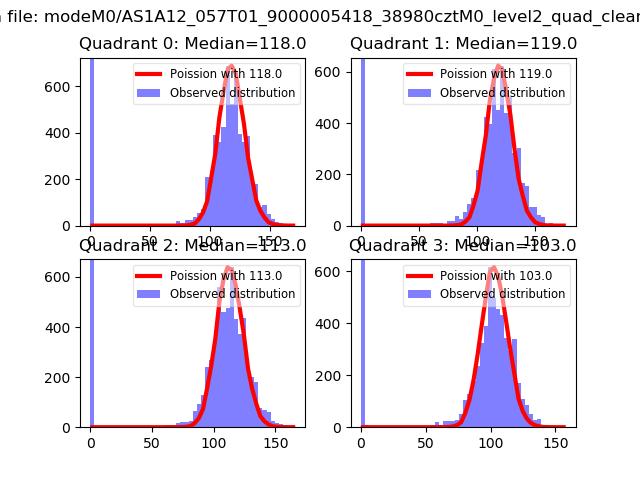 |
 |
| Quadrant-wise count rates Data is divided into 100 sec bins |
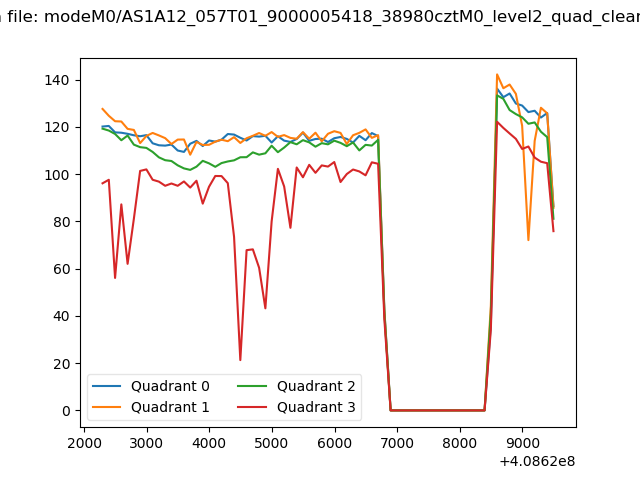 |
|
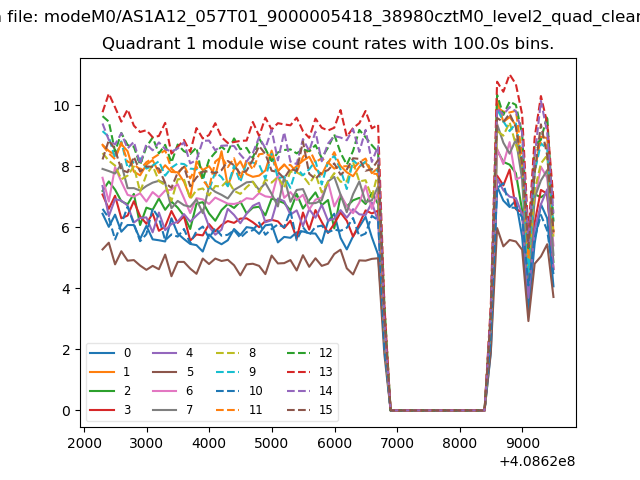
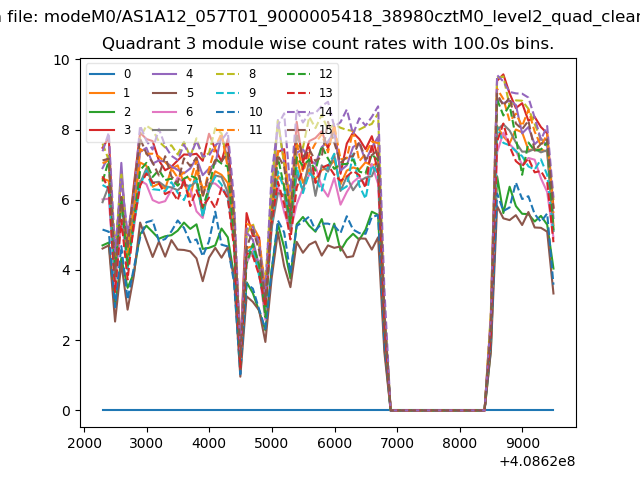
| Module-wise count rates for Quadrant A Data is divided into 100 sec bins |
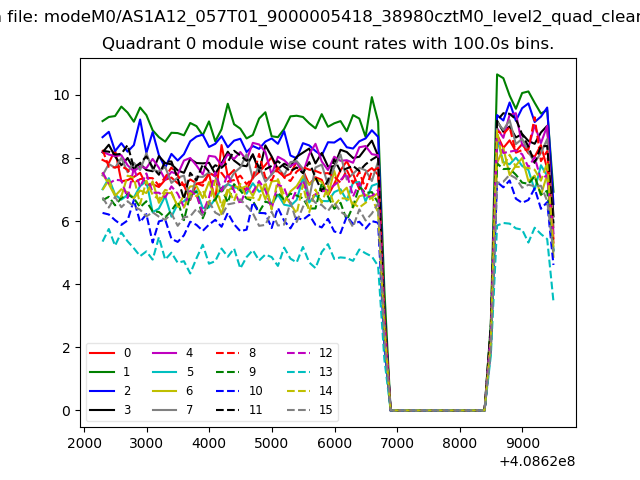 |
 |
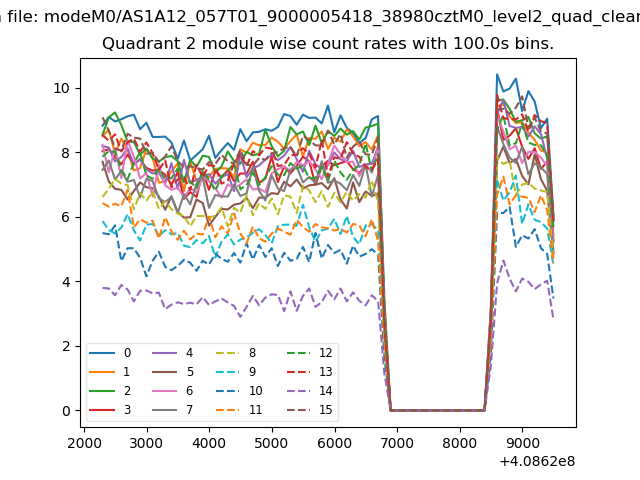
| Module-wise count rates for Quadrant B Data is divided into 100 sec bins |
 |
 |
| Module-wise count rates for Quadrant C Data is divided into 100 sec bins |
 |
 |
| Module-wise count rates for Quadrant D Data is divided into 100 sec bins |
 |
 |
| Parameter | Plot |
|---|---|
| CZT HV Monitor |  |
| D_VDD | 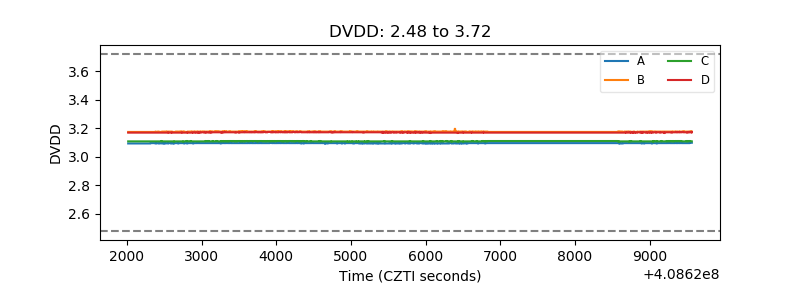 |
| Temperature 1 | 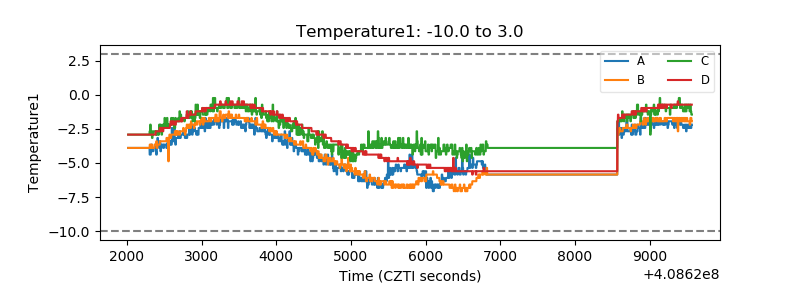 |
| Veto HV Monitor | 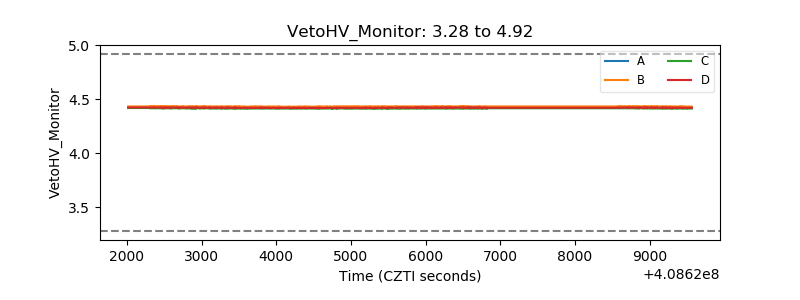 |
| Veto LLD | 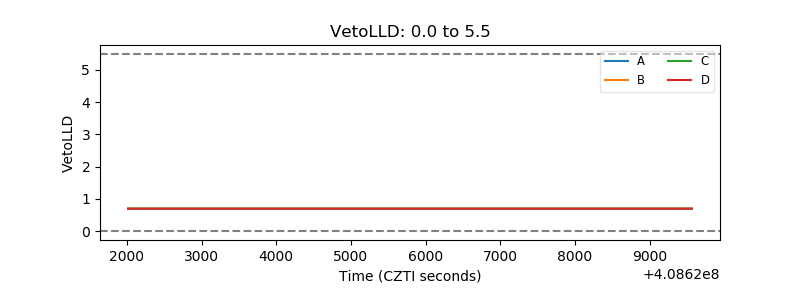 |
| Alpha Counter | 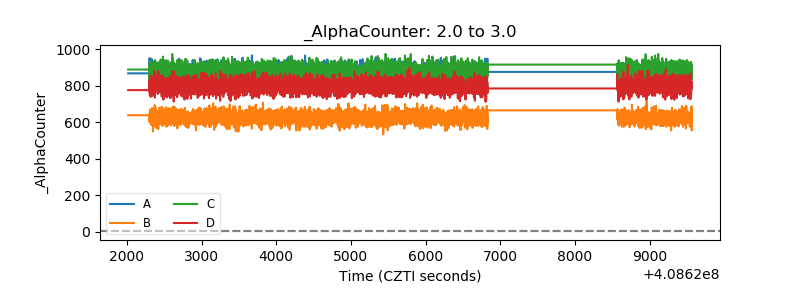 |
| _CPM_Rate | 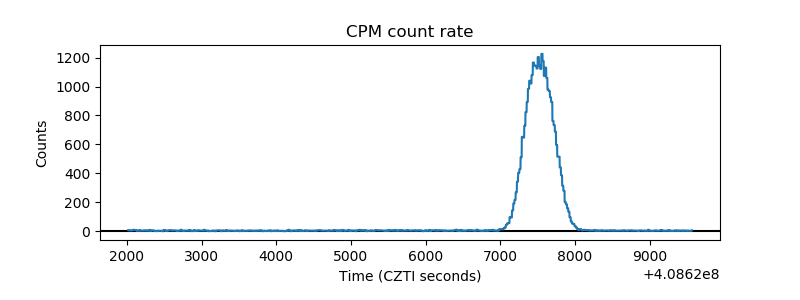 |
| CZT Counter | 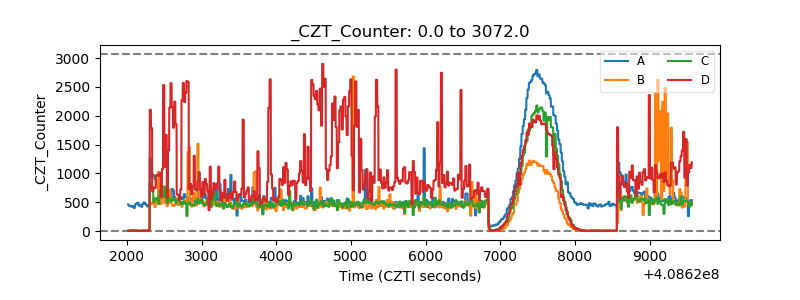 |
| +2.5 Volts monitor | 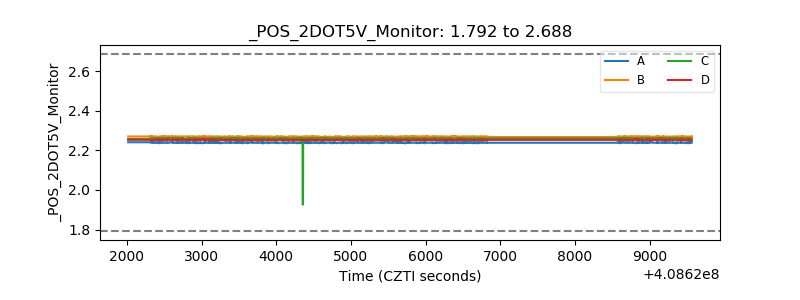 |
| +5 Volts monitor | 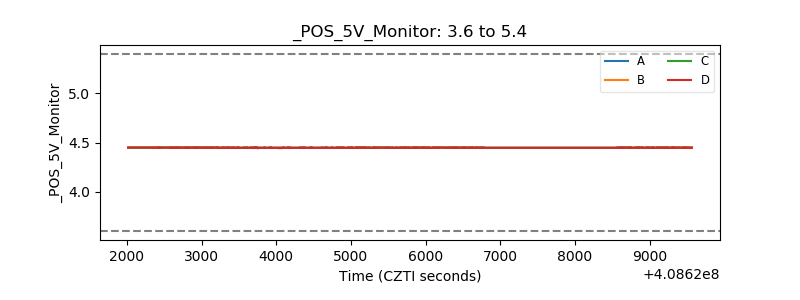 |
| _ROLL_ROT | 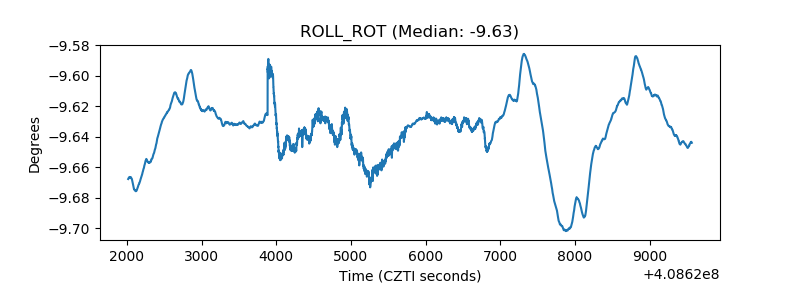 |
| _Roll_DEC | 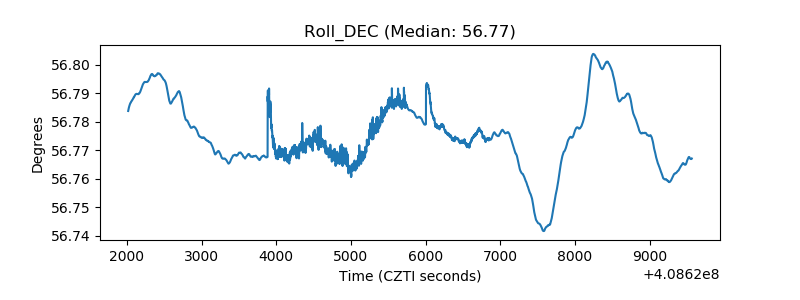 |
| _Roll_RA | 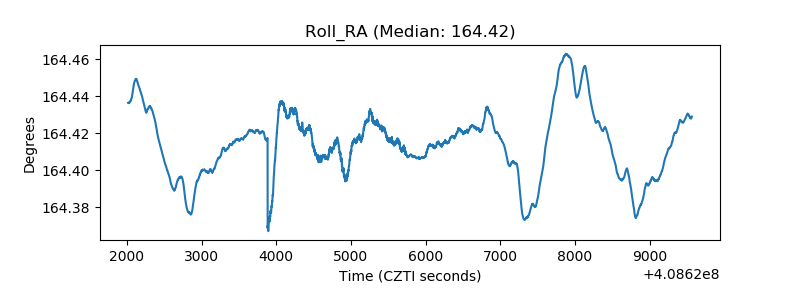 |
| Veto Counter | 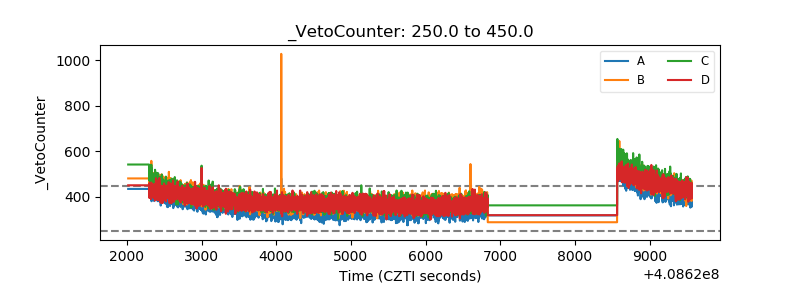 |