| Param | Original file | Final file |
|---|---|---|
| Filename | modeM0/AS1A12_057T01_9000005418_38981cztM0_level2.fits | modeM0/AS1A12_057T01_9000005418_38981cztM0_level2_quad_clean.evt |
| Size (bytes) | 446,526,720 | 96,379,200 |
| Size | 425.8 MB | 91.9 MB |
| Events in quadrant A | 3,018,748 | 687,019 |
| Events in quadrant B | 3,030,997 | 685,789 |
| Events in quadrant C | 2,757,586 | 658,735 |
| Events in quadrant D | 7,298,910 | 506,133 |
| Mode M9 | |||
|---|---|---|---|
| Quadrant | BADHDUFLAG | Total packets | Discarded packets |
| A | 0 | 27 | 0 |
| B | 0 | 27 | 0 |
| C | 0 | 27 | 0 |
| D | 0 | 28 | 0 |
| Mode SS | |||
|---|---|---|---|
| Quadrant | BADHDUFLAG | Total packets | Discarded packets |
| A | 0 | 110 | 0 |
| B | 0 | 110 | 0 |
| C | 0 | 110 | 0 |
| D | 0 | 110 | 0 |
| Mode M0 | |||
|---|---|---|---|
| Quadrant | BADHDUFLAG | Total packets | Discarded packets |
| A | 0 | 12400 | 3 |
| B | 0 | 12545 | 2 |
| C | 0 | 11397 | 2 |
| D | 0 | 25453 | 2 |
| Quadrant | Total seconds | Saturated seconds | Saturation percentage |
|---|---|---|---|
| A | 5442 | 17 | 0.312385% |
| B | 5442 | 126 | 2.315325% |
| C | 5442 | 4 | 0.073502% |
| D | 5442 | 1060 | 19.478133% |
Noise dominated data is calculated using 1-second bins in cleaned event files. If a bin has >2000 counts, and if more than 50% of those come from <1% of pixels, then it is considered to be noise-dominated and hence unusable.
| Quadrant | # 1 sec bins | Bins with >0 counts | Bins with >2000 counts | High rate bins dominated by noise | Noise dominated (total time) | Noise dominated (detector-on time) | Marked lightcurve |
|---|---|---|---|---|---|---|---|
| A | 7326 | 5443 | 7 | 7 | 0.10% | 0.13% | 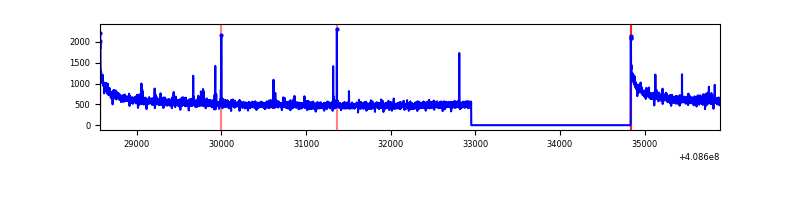 |
| B | 7326 | 5443 | 93 | 93 | 1.27% | 1.71% |  |
| C | 7326 | 5443 | 0 | 0 | 0.00% | 0.00% | 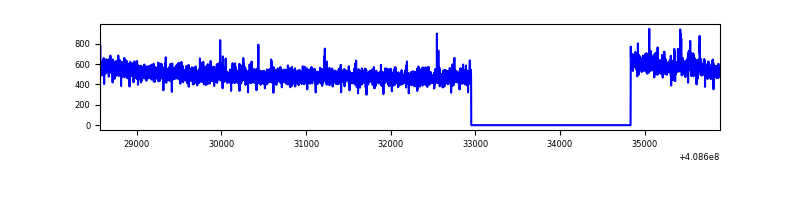 |
| D | 7326 | 5442 | 1078 | 1078 | 14.71% | 19.81% | 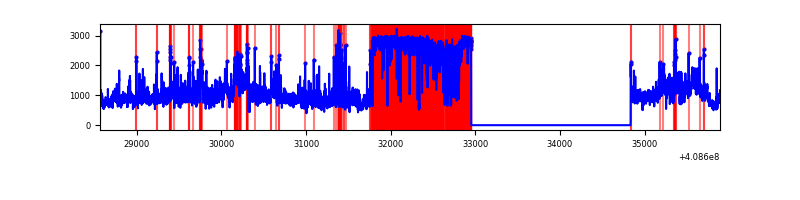 |
Top three noisy pixels from each quadrant. If the there are fewer than three noisy pixels in the level2.evt file, extra rows are filled as -1
| Pixel properties | Quadrant properties | ||||||
|---|---|---|---|---|---|---|---|
| Quadrant | DetID | PixID | Counts | Sigma | Mean | Median | Sigma |
| A | 10 | 83 | 447974 | 3410.32 | 651 | 639 | 131.2 |
| A | 13 | 248 | 23797 | 176.55 | 651 | 639 | 131.2 |
| A | 9 | 143 | 19053 | 140.38 | 651 | 639 | 131.2 |
| B | 5 | 172 | 458875 | 3742.84 | 640 | 621 | 122.4 |
| B | 15 | 32 | 22594 | 179.46 | 640 | 621 | 122.4 |
| B | 12 | 111 | 14643 | 114.52 | 640 | 621 | 122.4 |
| C | 15 | 214 | 239793 | 1616.09 | 637 | 640 | 148.0 |
| C | 3 | 233 | 22750 | 149.41 | 637 | 640 | 148.0 |
| C | 1 | 128 | 7009 | 43.04 | 637 | 640 | 148.0 |
| D | 12 | 227 | 2386928 | 17165.02 | 570 | 554 | 139.0 |
| D | 12 | 235 | 2104342 | 15132.4 | 570 | 554 | 139.0 |
| D | 2 | 249 | 336137 | 2413.82 | 570 | 554 | 139.0 |
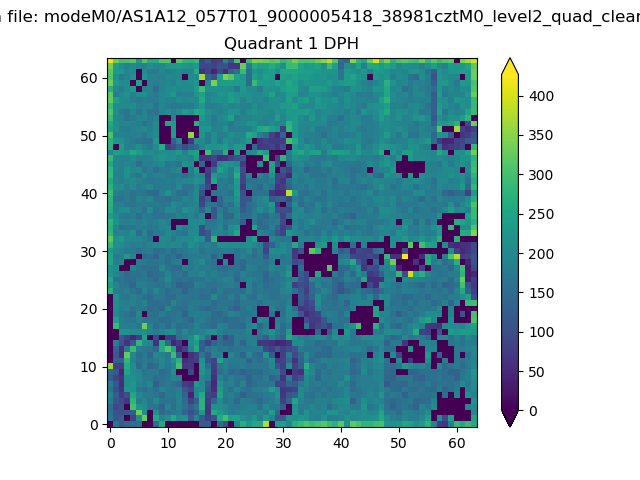
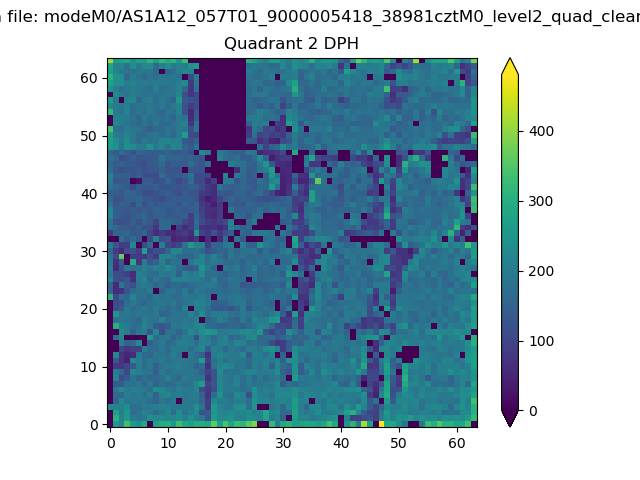
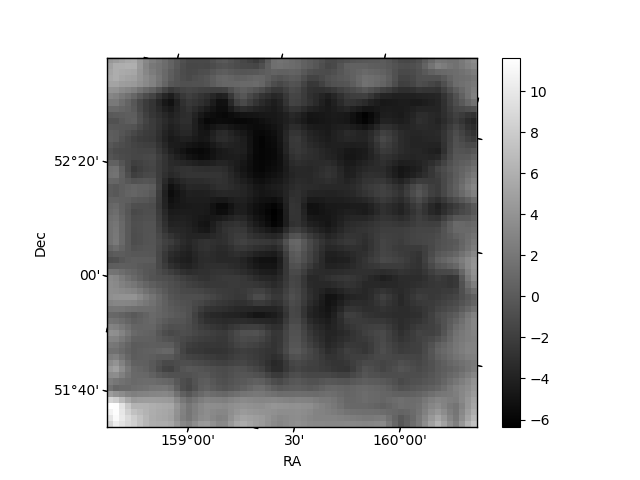
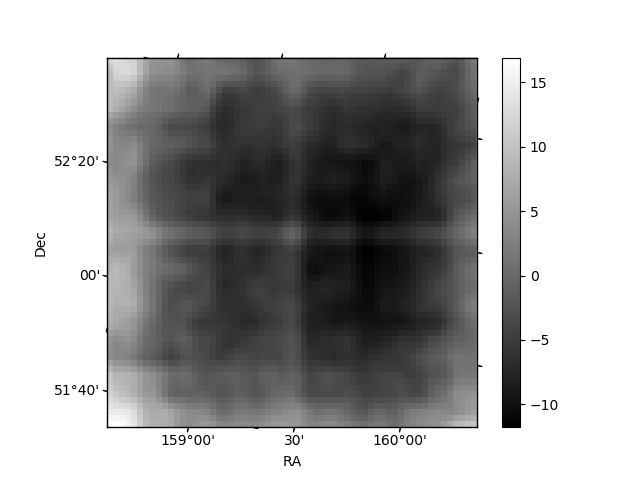
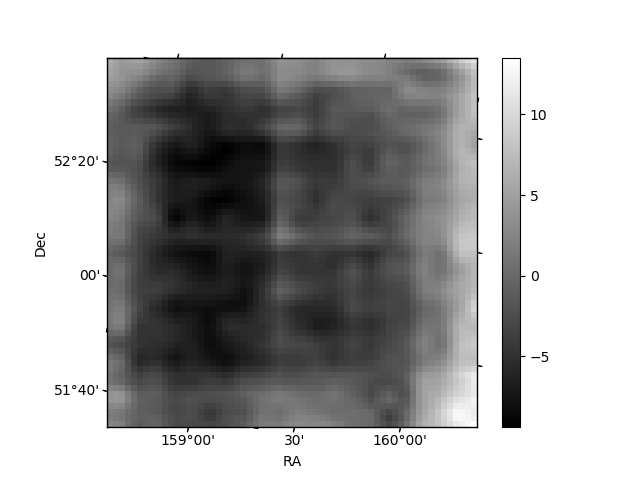
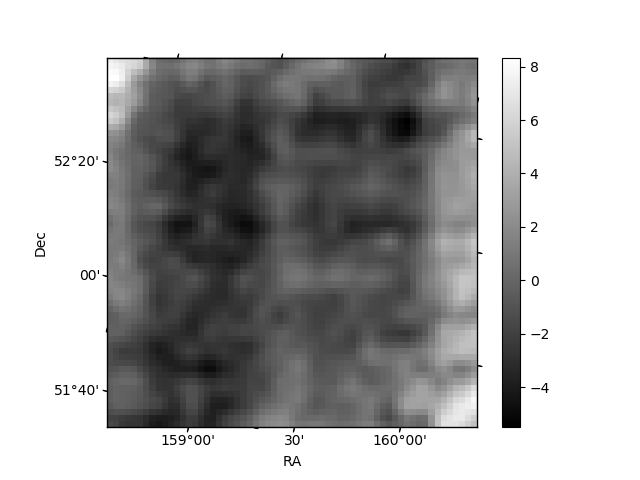
Histogram calculated using DETX and DETY for each event in the final _common_clean file
| Quadrant A | 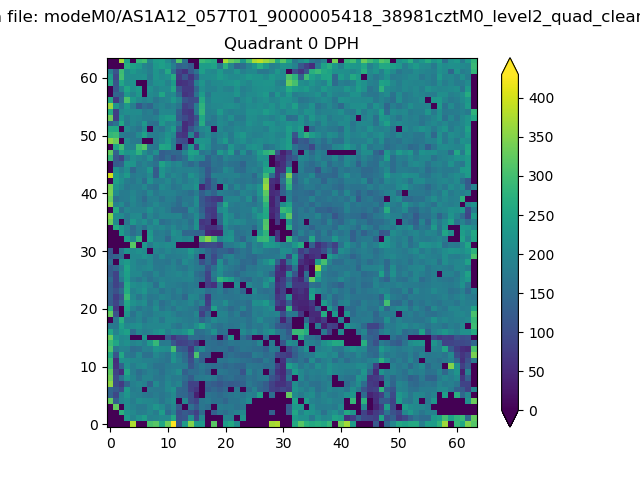 |
 |
Quadrant B |
|---|---|---|---|
| Quadrant D |  |
 |
Quadrant C |
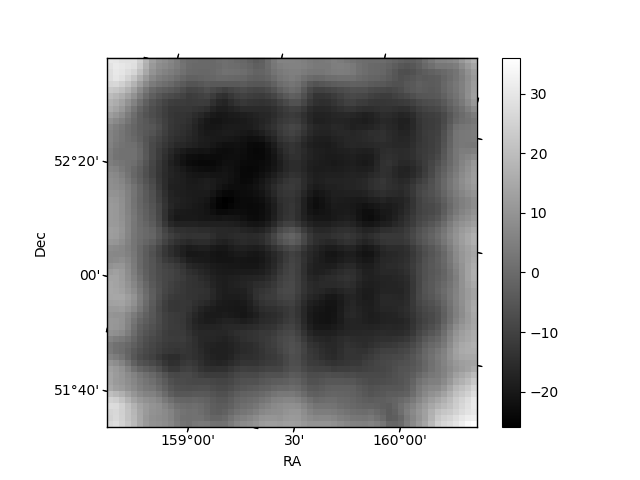
| Plot type | Count rate plots | Images |
|---|---|---|
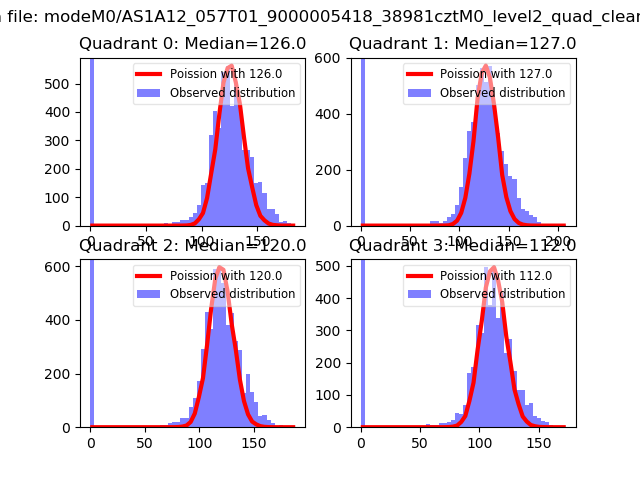
| Comparison with Poisson distribution Blue bars denote a histogram of data divided into 1 sec bins. Red curve is a Poisson curve with rate = median count rate of data. |
 |
 |
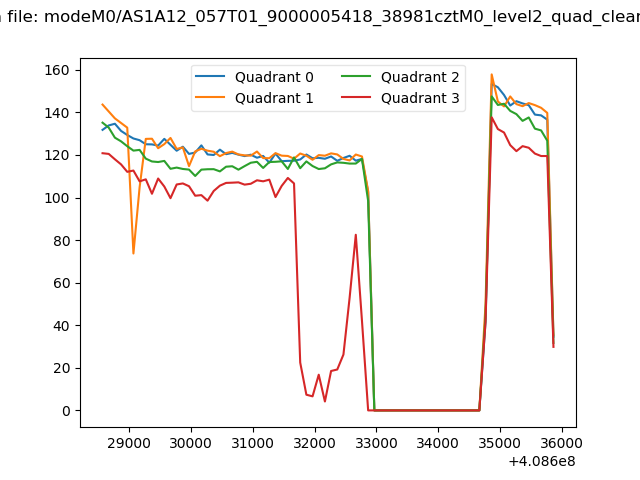
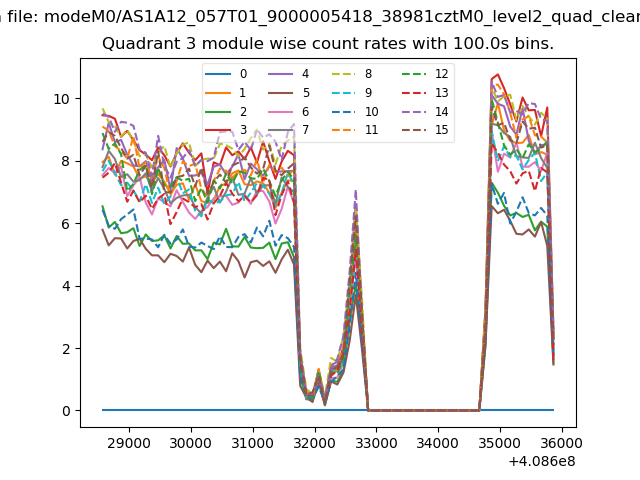
| Quadrant-wise count rates Data is divided into 100 sec bins |
 |
|
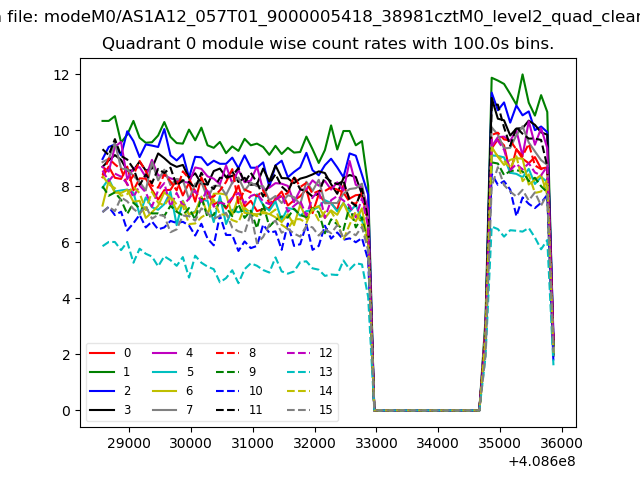
| Module-wise count rates for Quadrant A Data is divided into 100 sec bins |
 |
 |
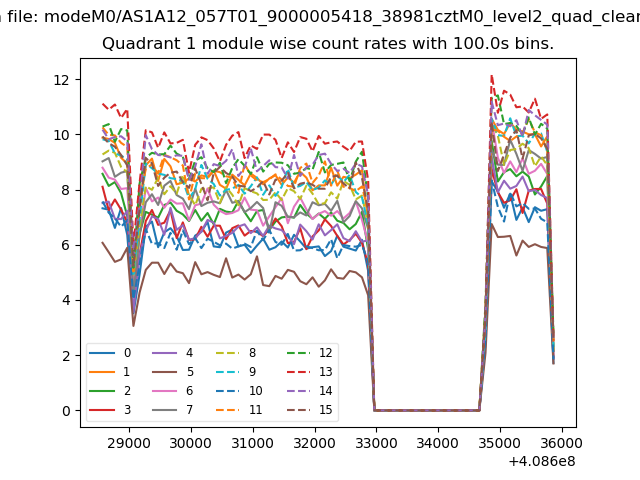
| Module-wise count rates for Quadrant B Data is divided into 100 sec bins |
 |
 |
| Module-wise count rates for Quadrant C Data is divided into 100 sec bins |
 |
 |
| Module-wise count rates for Quadrant D Data is divided into 100 sec bins |
 |
 |
| Parameter | Plot |
|---|---|
| CZT HV Monitor | 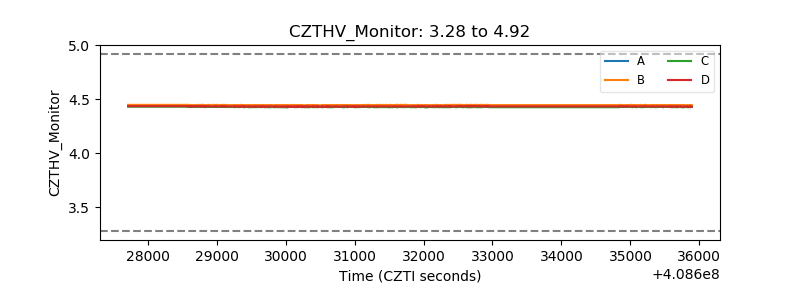 |
| D_VDD | 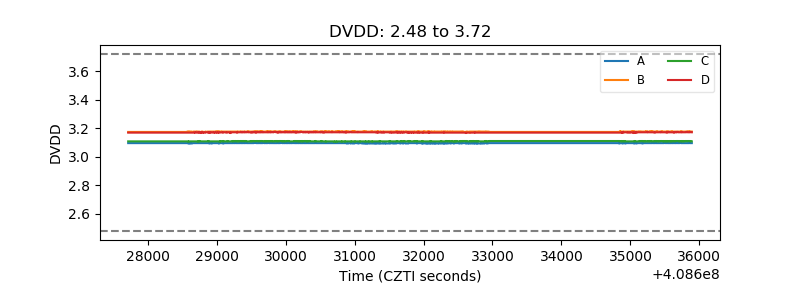 |
| Temperature 1 | 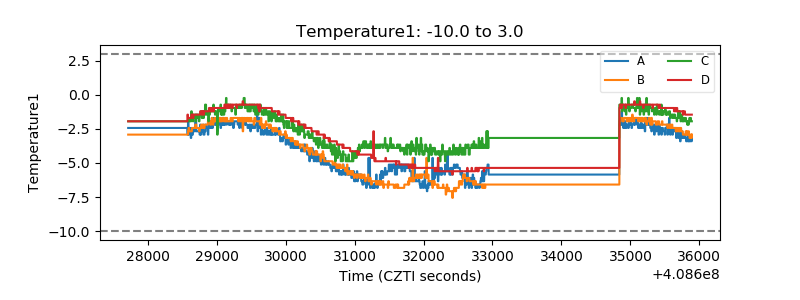 |
| Veto HV Monitor | 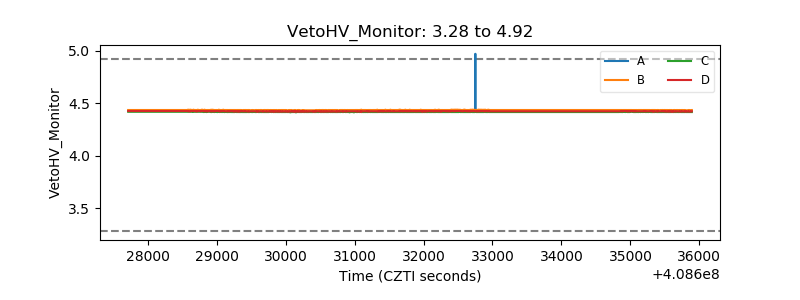 |
| Veto LLD | 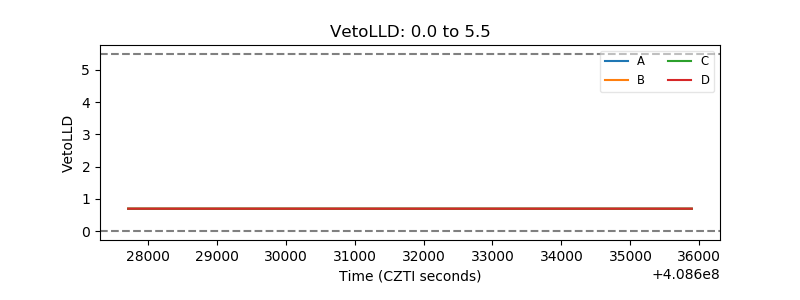 |
| Alpha Counter | 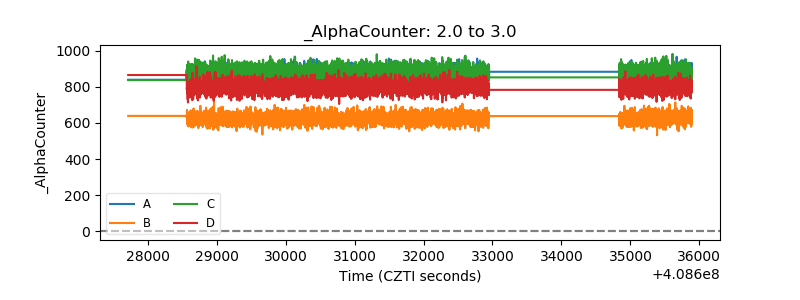 |
| _CPM_Rate | 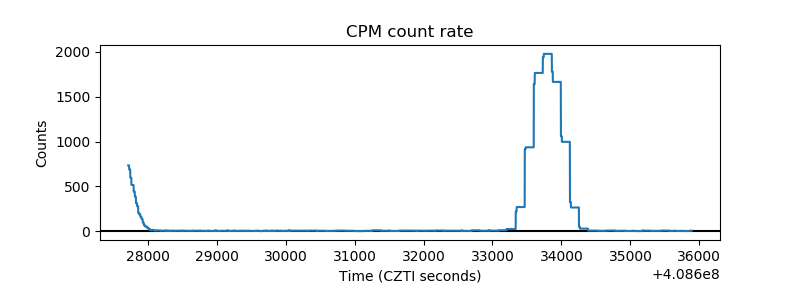 |
| CZT Counter | 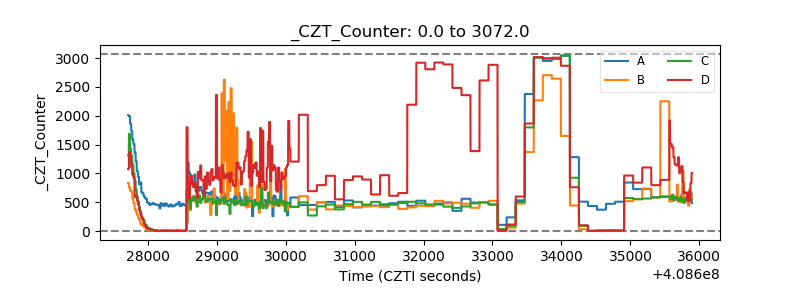 |
| +2.5 Volts monitor | 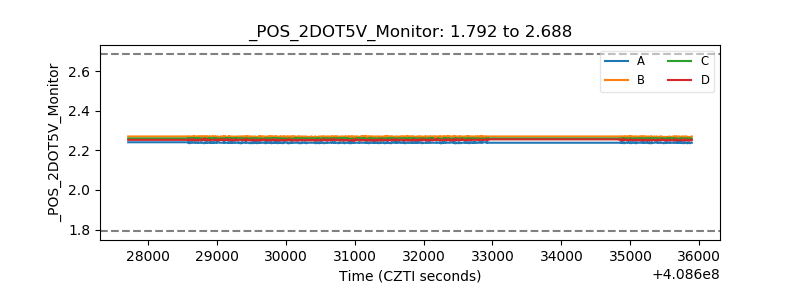 |
| +5 Volts monitor | 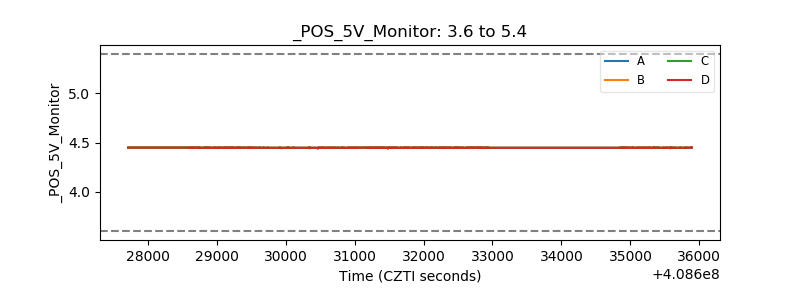 |
| _ROLL_ROT | 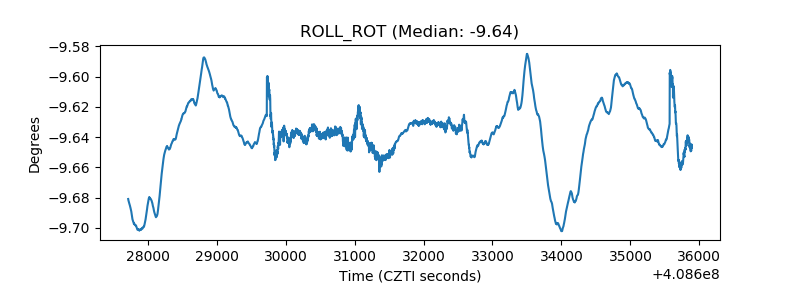 |
| _Roll_DEC | 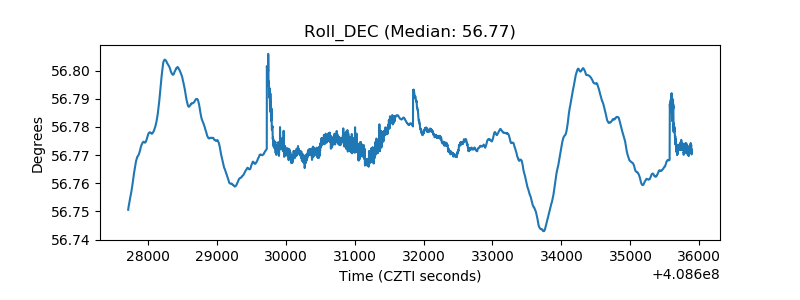 |
| _Roll_RA | 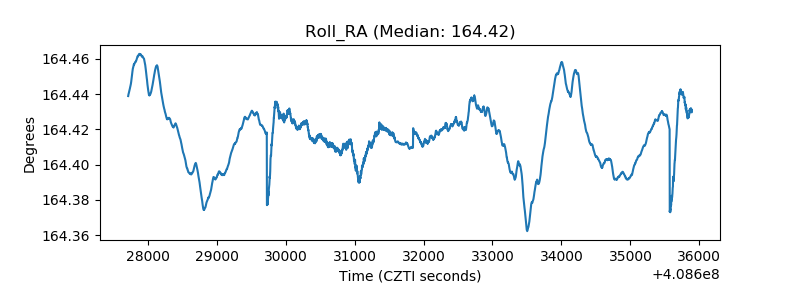 |
| Veto Counter | 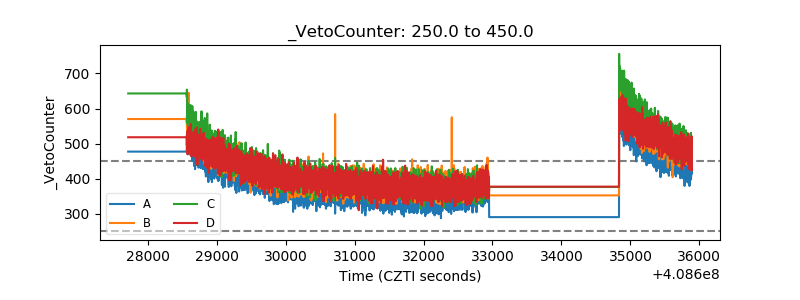 |