| Param | Original file | Final file |
|---|---|---|
| Filename | modeM0/AS1A12_057T01_9000005418_38982cztM0_level2.fits | modeM0/AS1A12_057T01_9000005418_38982cztM0_level2_quad_clean.evt |
| Size (bytes) | 423,832,320 | 99,048,960 |
| Size | 404.2 MB | 94.5 MB |
| Events in quadrant A | 2,965,079 | 694,528 |
| Events in quadrant B | 2,848,739 | 701,427 |
| Events in quadrant C | 2,766,026 | 672,272 |
| Events in quadrant D | 6,708,474 | 569,671 |
| Mode M9 | |||
|---|---|---|---|
| Quadrant | BADHDUFLAG | Total packets | Discarded packets |
| A | 0 | 25 | 0 |
| B | 0 | 25 | 0 |
| C | 0 | 25 | 0 |
| D | 0 | 26 | 0 |
| Mode SS | |||
|---|---|---|---|
| Quadrant | BADHDUFLAG | Total packets | Discarded packets |
| A | 0 | 104 | 0 |
| B | 0 | 104 | 0 |
| C | 0 | 104 | 0 |
| D | 0 | 104 | 0 |
| Mode M0 | |||
|---|---|---|---|
| Quadrant | BADHDUFLAG | Total packets | Discarded packets |
| A | 0 | 12115 | 3 |
| B | 0 | 11838 | 2 |
| C | 0 | 11511 | 2 |
| D | 0 | 23577 | 2 |
| Quadrant | Total seconds | Saturated seconds | Saturation percentage |
|---|---|---|---|
| A | 5163 | 22 | 0.426109% |
| B | 5163 | 72 | 1.394538% |
| C | 5163 | 9 | 0.174317% |
| D | 5163 | 582 | 11.272516% |
Noise dominated data is calculated using 1-second bins in cleaned event files. If a bin has >2000 counts, and if more than 50% of those come from <1% of pixels, then it is considered to be noise-dominated and hence unusable.
| Quadrant | # 1 sec bins | Bins with >0 counts | Bins with >2000 counts | High rate bins dominated by noise | Noise dominated (total time) | Noise dominated (detector-on time) | Marked lightcurve |
|---|---|---|---|---|---|---|---|
| A | 7166 | 5164 | 9 | 9 | 0.13% | 0.17% | 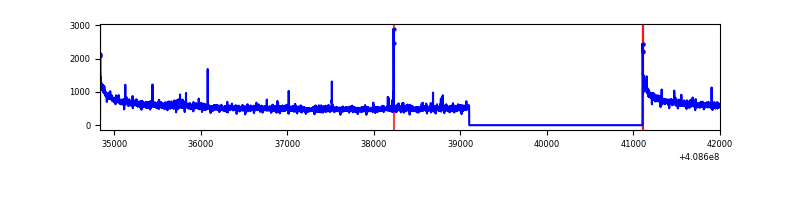 |
| B | 7166 | 5164 | 47 | 47 | 0.66% | 0.91% | 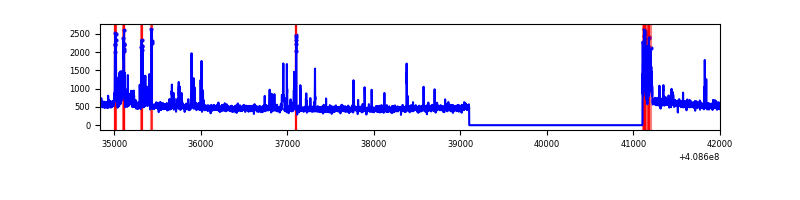 |
| C | 7166 | 5164 | 0 | 0 | 0.00% | 0.00% | 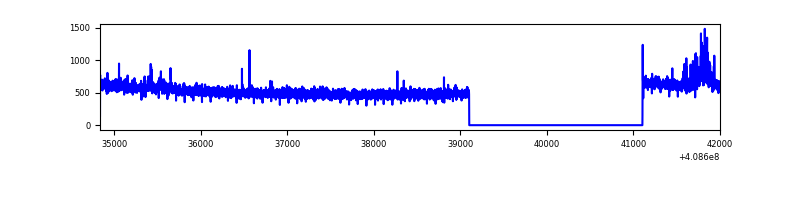 |
| D | 7166 | 5164 | 609 | 609 | 8.50% | 11.79% | 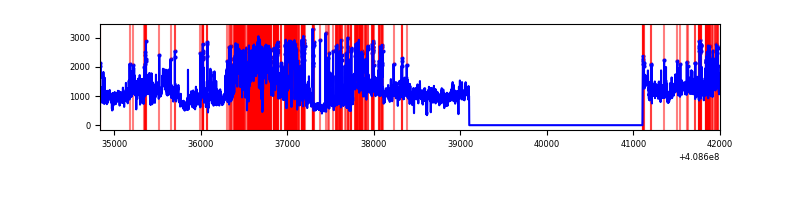 |
Top three noisy pixels from each quadrant. If the there are fewer than three noisy pixels in the level2.evt file, extra rows are filled as -1
| Pixel properties | Quadrant properties | ||||||
|---|---|---|---|---|---|---|---|
| Quadrant | DetID | PixID | Counts | Sigma | Mean | Median | Sigma |
| A | 10 | 83 | 433883 | 3390.39 | 637 | 627 | 127.8 |
| A | 13 | 248 | 27590 | 211.0 | 637 | 627 | 127.8 |
| A | 9 | 143 | 21070 | 159.97 | 637 | 627 | 127.8 |
| B | 5 | 172 | 305604 | 2537.46 | 632 | 615 | 120.2 |
| B | 15 | 32 | 16820 | 134.82 | 632 | 615 | 120.2 |
| B | 0 | 230 | 16192 | 129.6 | 632 | 615 | 120.2 |
| C | 15 | 214 | 225536 | 1566.08 | 627 | 631 | 143.6 |
| C | 3 | 233 | 79459 | 548.9 | 627 | 631 | 143.6 |
| C | 1 | 128 | 7697 | 49.2 | 627 | 631 | 143.6 |
| D | 12 | 235 | 2922620 | 19973.52 | 602 | 586 | 146.3 |
| D | 12 | 227 | 1179842 | 8060.79 | 602 | 586 | 146.3 |
| D | 13 | 249 | 99055 | 673.08 | 602 | 586 | 146.3 |
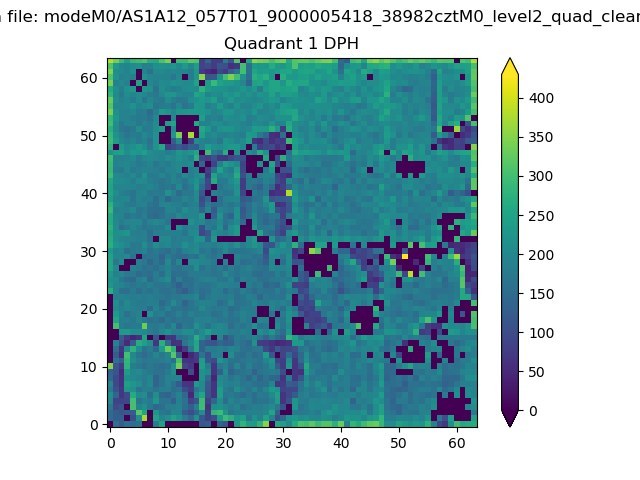
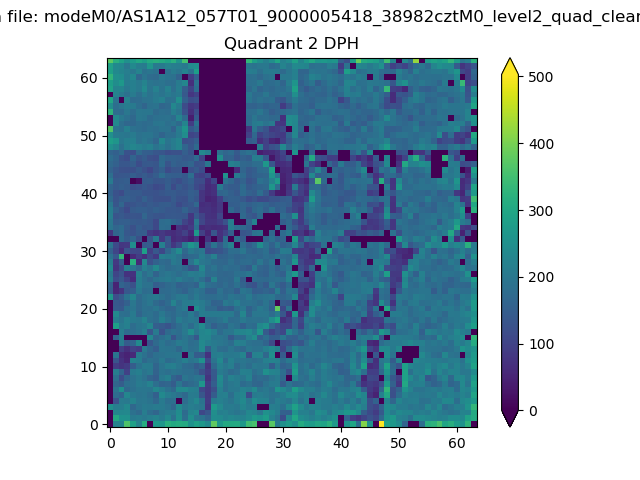
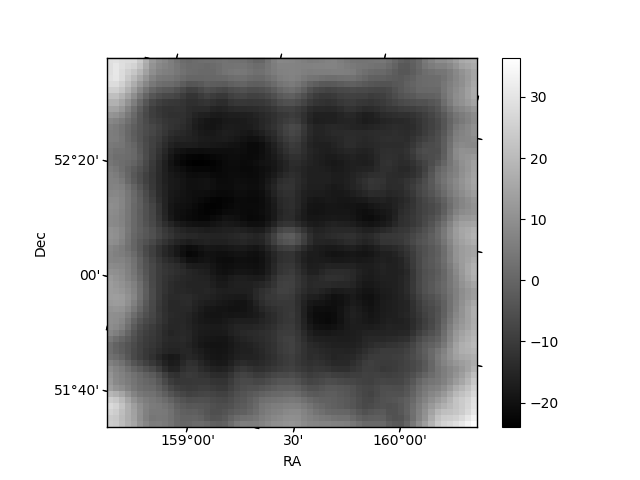
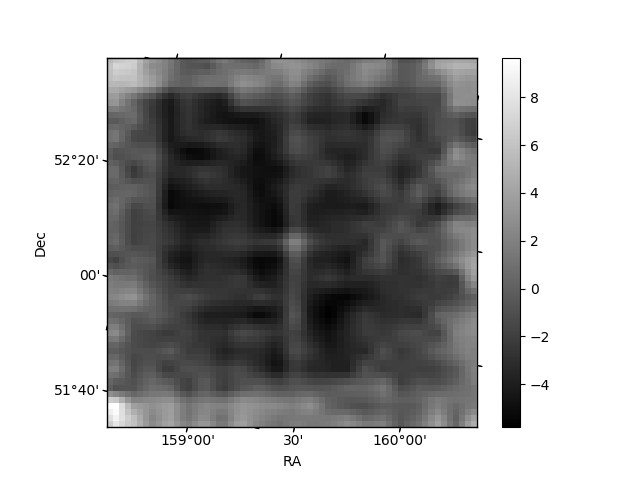
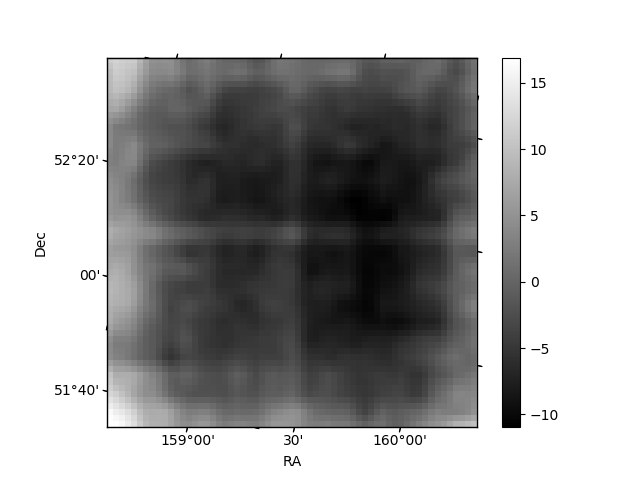
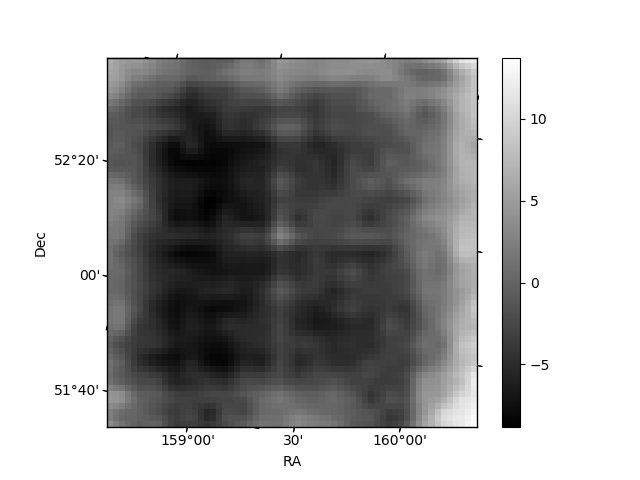
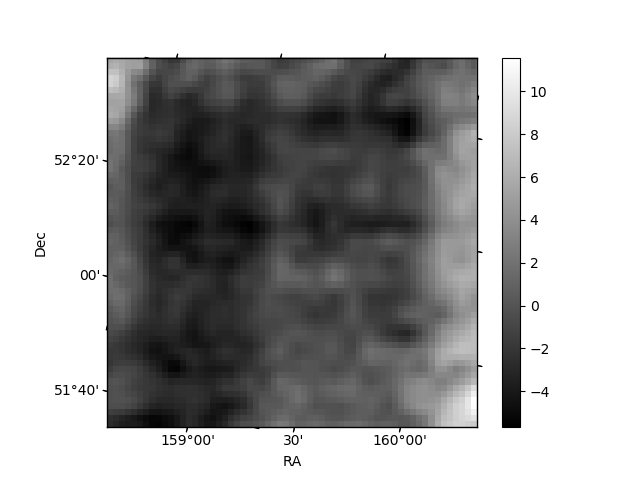
Histogram calculated using DETX and DETY for each event in the final _common_clean file
| Quadrant A | 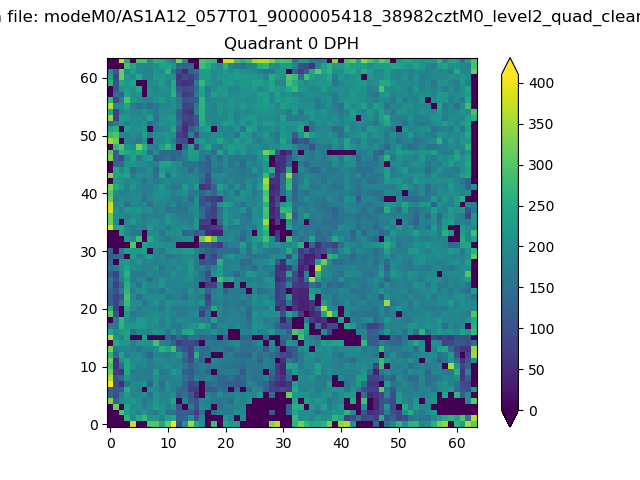 |
 |
Quadrant B |
|---|---|---|---|
| Quadrant D |  |
 |
Quadrant C |
| Plot type | Count rate plots | Images |
|---|---|---|
| Comparison with Poisson distribution Blue bars denote a histogram of data divided into 1 sec bins. Red curve is a Poisson curve with rate = median count rate of data. |
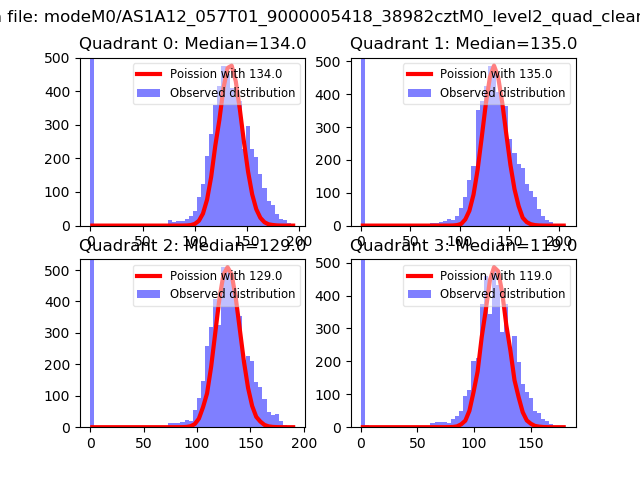 |
 |
| Quadrant-wise count rates Data is divided into 100 sec bins |
 |
|
| Module-wise count rates for Quadrant A Data is divided into 100 sec bins |
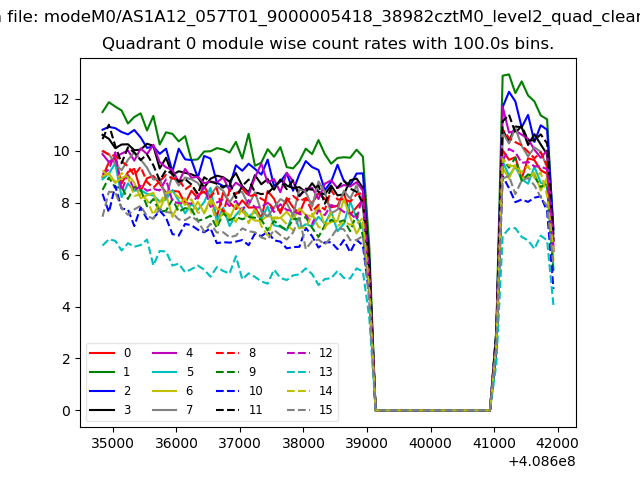 |
 |
| Module-wise count rates for Quadrant B Data is divided into 100 sec bins |
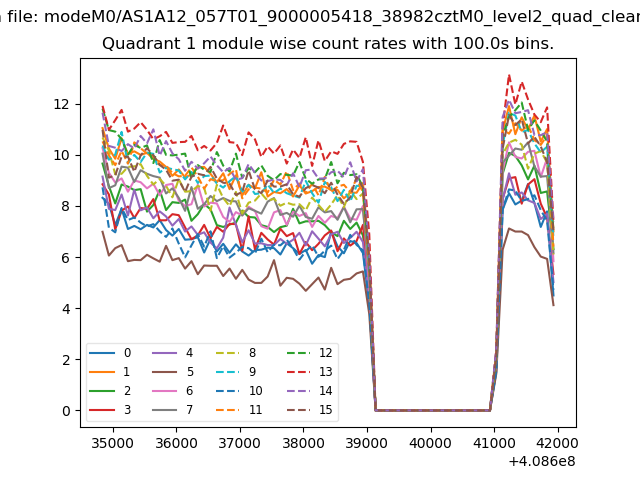 |
 |
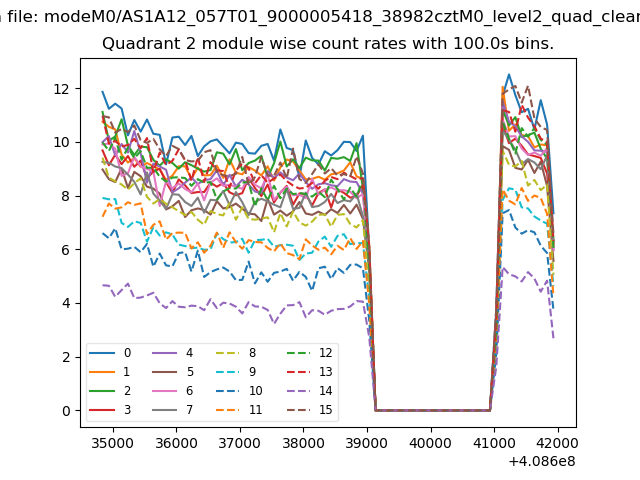
| Module-wise count rates for Quadrant C Data is divided into 100 sec bins |
 |
 |
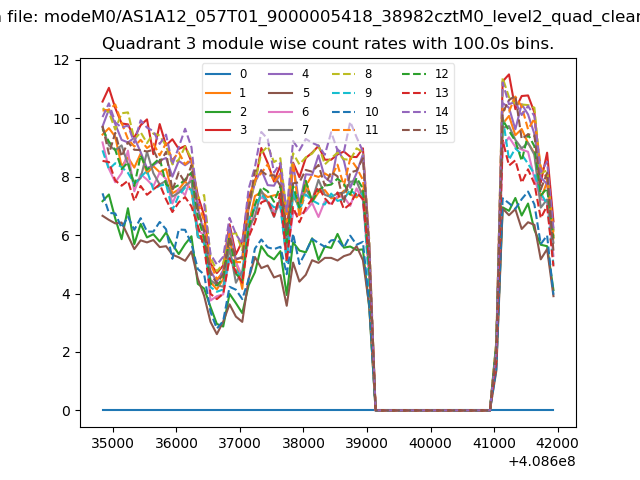
| Module-wise count rates for Quadrant D Data is divided into 100 sec bins |
 |
 |
| Parameter | Plot |
|---|---|
| CZT HV Monitor | 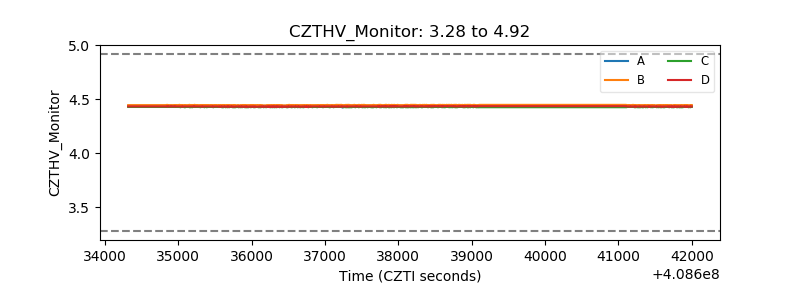 |
| D_VDD | 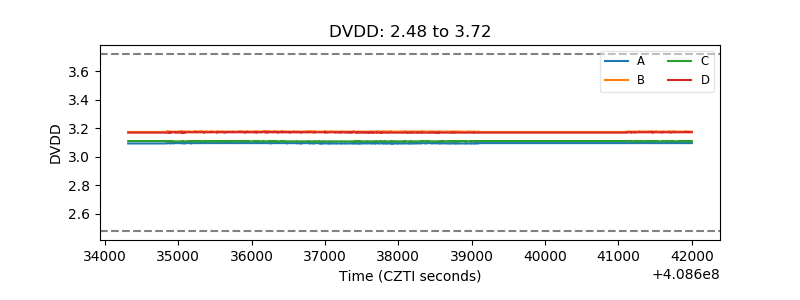 |
| Temperature 1 | 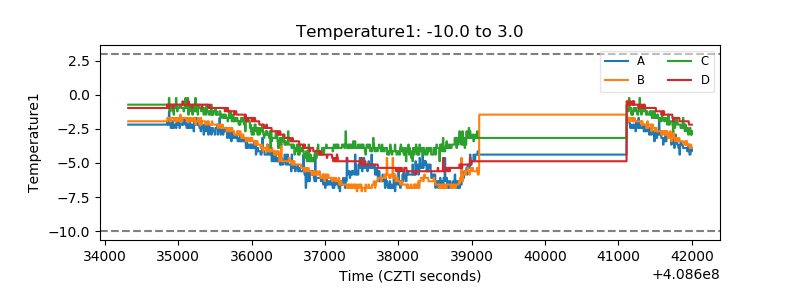 |
| Veto HV Monitor | 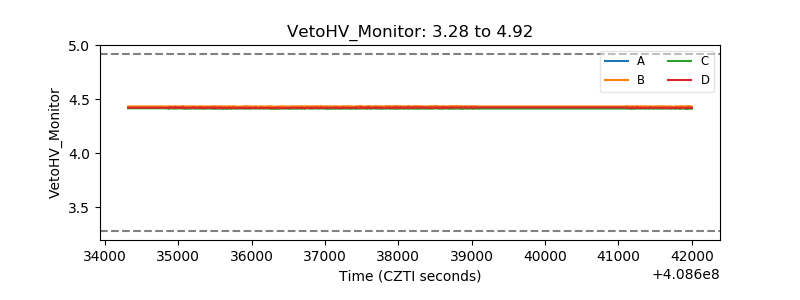 |
| Veto LLD | 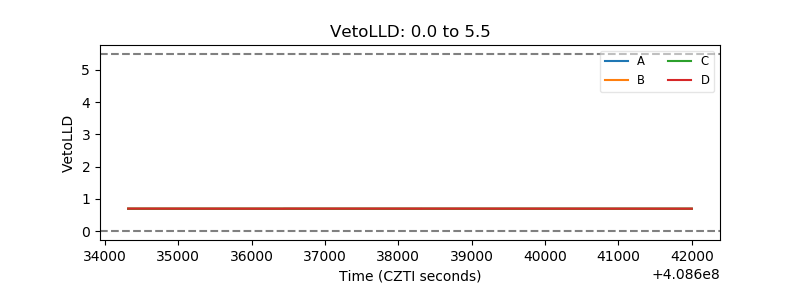 |
| Alpha Counter |  |
| _CPM_Rate | 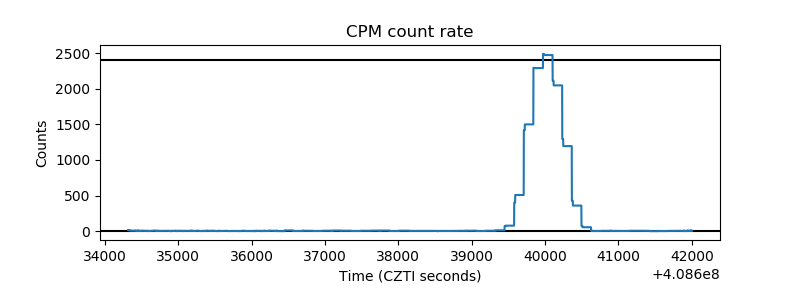 |
| CZT Counter | 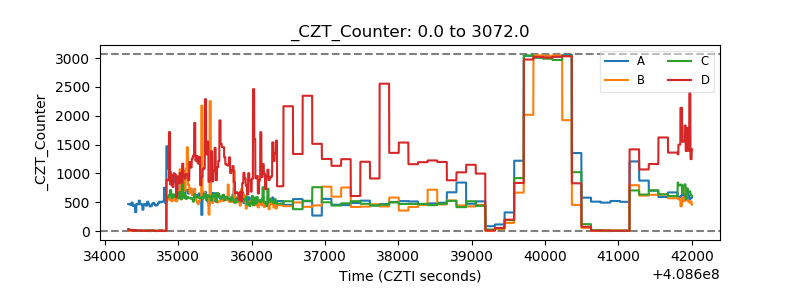 |
| +2.5 Volts monitor | 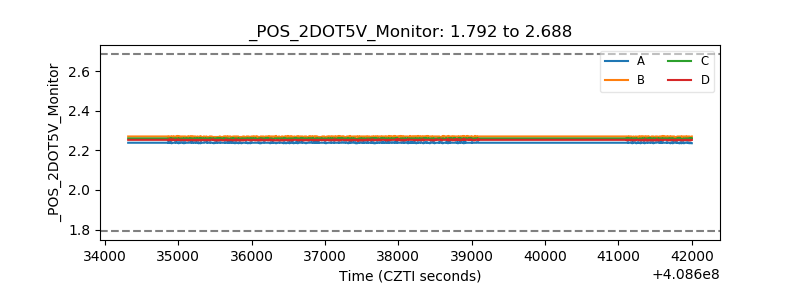 |
| +5 Volts monitor | 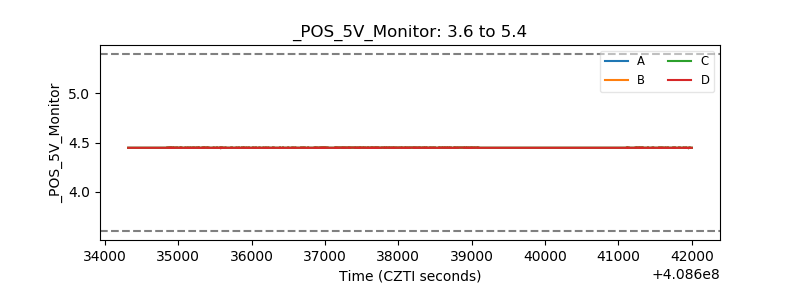 |
| _ROLL_ROT | 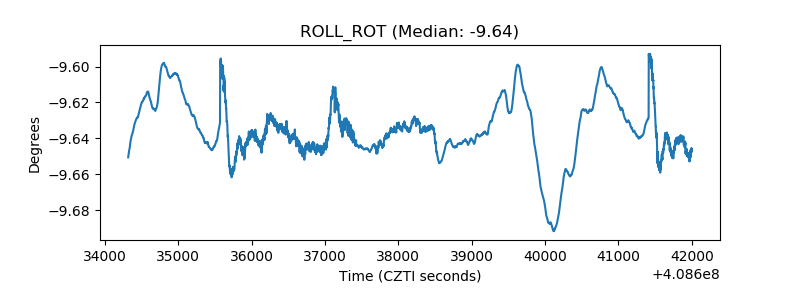 |
| _Roll_DEC | 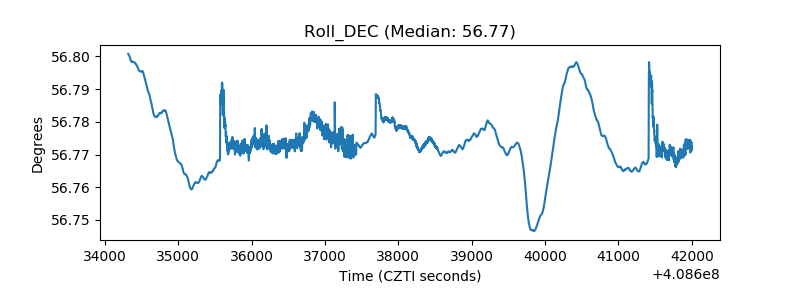 |
| _Roll_RA | 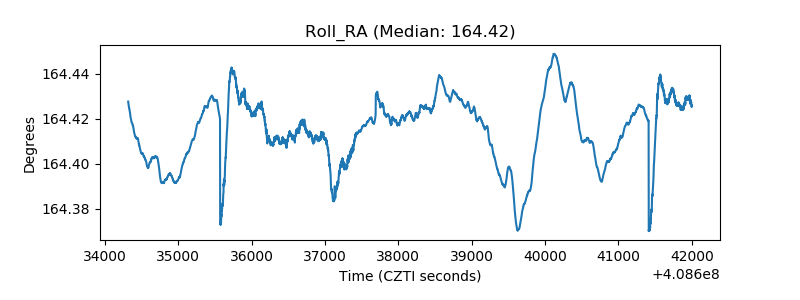 |
| Veto Counter | 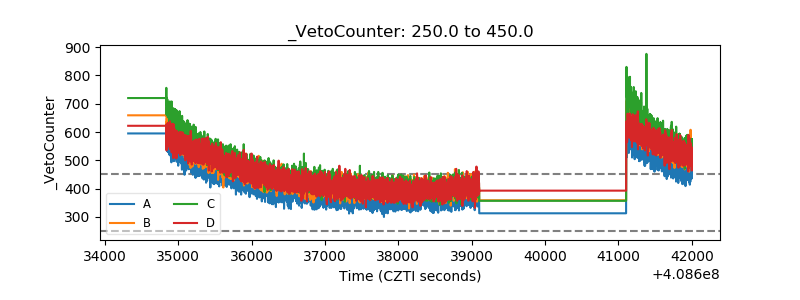 |