| Param | Original file | Final file |
|---|---|---|
| Filename | modeM0/AS1A12_057T01_9000005418_38983cztM0_level2.fits | modeM0/AS1A12_057T01_9000005418_38983cztM0_level2_quad_clean.evt |
| Size (bytes) | 411,687,360 | 96,770,880 |
| Size | 392.6 MB | 92.3 MB |
| Events in quadrant A | 2,827,196 | 671,053 |
| Events in quadrant B | 2,746,567 | 683,390 |
| Events in quadrant C | 2,641,950 | 657,092 |
| Events in quadrant D | 6,644,633 | 576,179 |
| Mode M9 | |||
|---|---|---|---|
| Quadrant | BADHDUFLAG | Total packets | Discarded packets |
| A | 0 | 31 | 0 |
| B | 0 | 31 | 0 |
| C | 0 | 31 | 0 |
| D | 0 | 32 | 0 |
| Mode SS | |||
|---|---|---|---|
| Quadrant | BADHDUFLAG | Total packets | Discarded packets |
| A | 0 | 100 | 0 |
| B | 0 | 100 | 0 |
| C | 0 | 100 | 0 |
| D | 0 | 100 | 0 |
| Mode M0 | |||
|---|---|---|---|
| Quadrant | BADHDUFLAG | Total packets | Discarded packets |
| A | 0 | 11483 | 3 |
| B | 0 | 11284 | 2 |
| C | 0 | 10979 | 2 |
| D | 0 | 23145 | 2 |
| Quadrant | Total seconds | Saturated seconds | Saturation percentage |
|---|---|---|---|
| A | 4885 | 23 | 0.470829% |
| B | 4885 | 48 | 0.982600% |
| C | 4885 | 13 | 0.266121% |
| D | 4885 | 385 | 7.881269% |
Noise dominated data is calculated using 1-second bins in cleaned event files. If a bin has >2000 counts, and if more than 50% of those come from <1% of pixels, then it is considered to be noise-dominated and hence unusable.
| Quadrant | # 1 sec bins | Bins with >0 counts | Bins with >2000 counts | High rate bins dominated by noise | Noise dominated (total time) | Noise dominated (detector-on time) | Marked lightcurve |
|---|---|---|---|---|---|---|---|
| A | 6977 | 4886 | 7 | 7 | 0.10% | 0.14% | 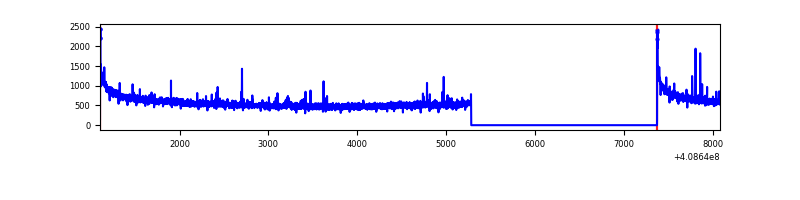 |
| B | 6977 | 4886 | 31 | 31 | 0.44% | 0.63% | 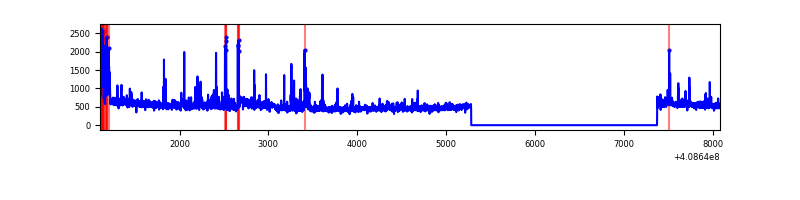 |
| C | 6977 | 4886 | 2 | 2 | 0.03% | 0.04% | 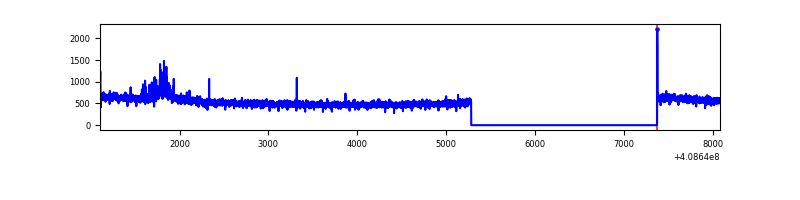 |
| D | 6977 | 4885 | 391 | 391 | 5.60% | 8.00% | 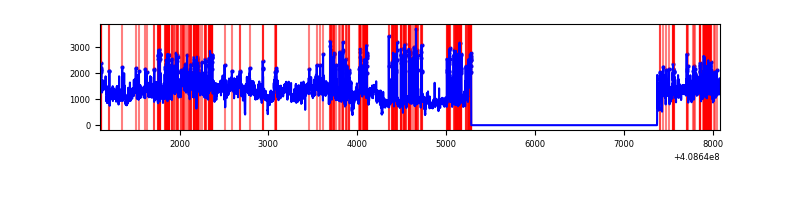 |
Top three noisy pixels from each quadrant. If the there are fewer than three noisy pixels in the level2.evt file, extra rows are filled as -1
| Pixel properties | Quadrant properties | ||||||
|---|---|---|---|---|---|---|---|
| Quadrant | DetID | PixID | Counts | Sigma | Mean | Median | Sigma |
| A | 10 | 83 | 414203 | 3425.85 | 606 | 597 | 120.7 |
| A | 13 | 248 | 30135 | 244.66 | 606 | 597 | 120.7 |
| A | 9 | 143 | 11272 | 88.42 | 606 | 597 | 120.7 |
| B | 5 | 172 | 236558 | 2093.94 | 604 | 591 | 112.7 |
| B | 15 | 32 | 50672 | 444.41 | 604 | 591 | 112.7 |
| B | 5 | 184 | 48116 | 421.73 | 604 | 591 | 112.7 |
| C | 15 | 214 | 213124 | 1559.55 | 599 | 605 | 136.3 |
| C | 3 | 233 | 75728 | 551.28 | 599 | 605 | 136.3 |
| C | 0 | 10 | 8451 | 57.58 | 599 | 605 | 136.3 |
| D | 12 | 235 | 3504833 | 24990.72 | 580 | 566 | 140.2 |
| D | 12 | 227 | 681391 | 4855.31 | 580 | 566 | 140.2 |
| D | 2 | 249 | 88753 | 628.91 | 580 | 566 | 140.2 |
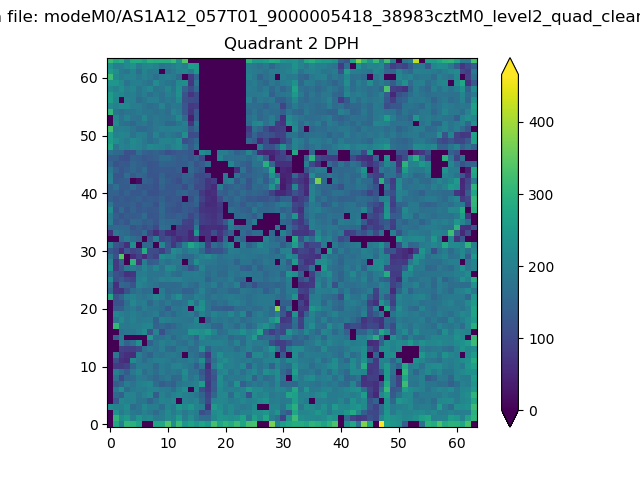
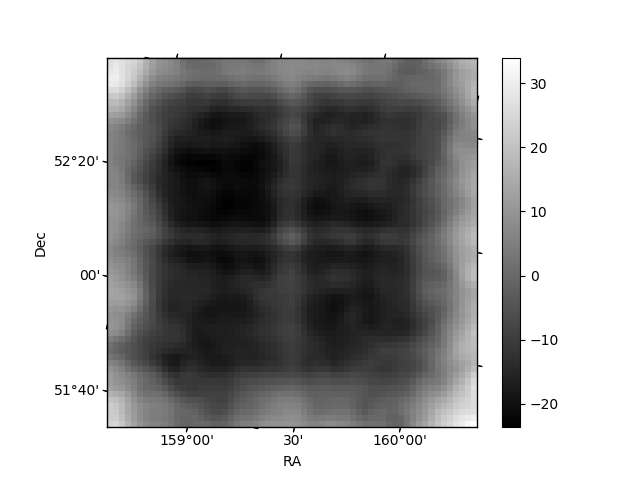
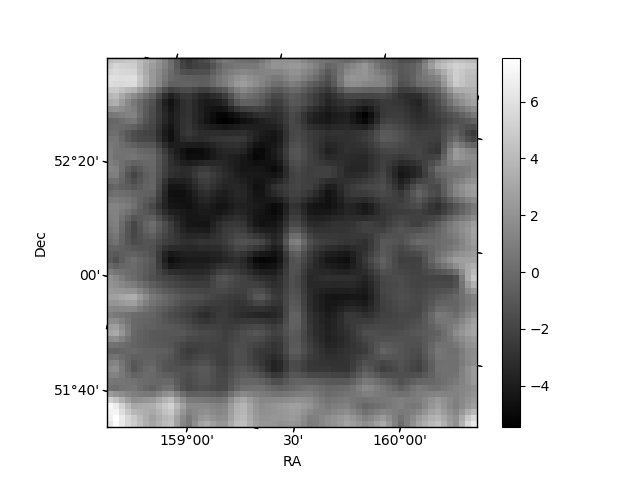
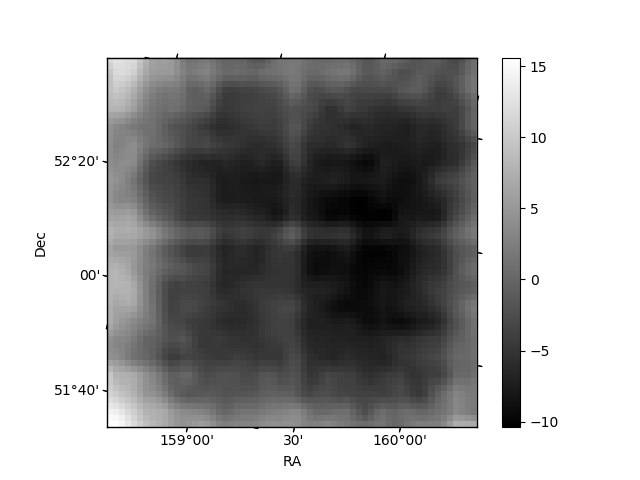
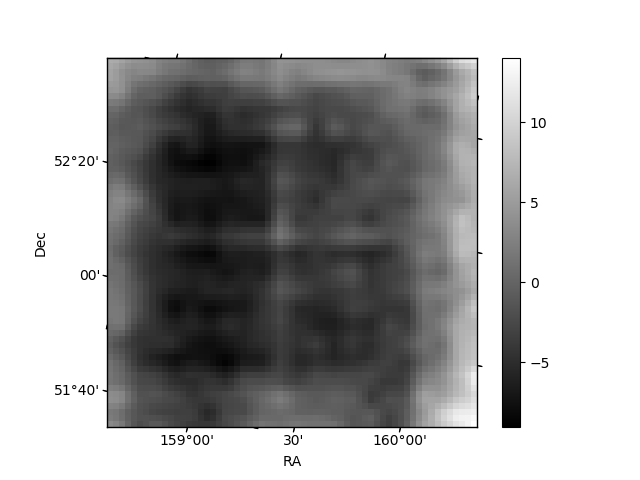
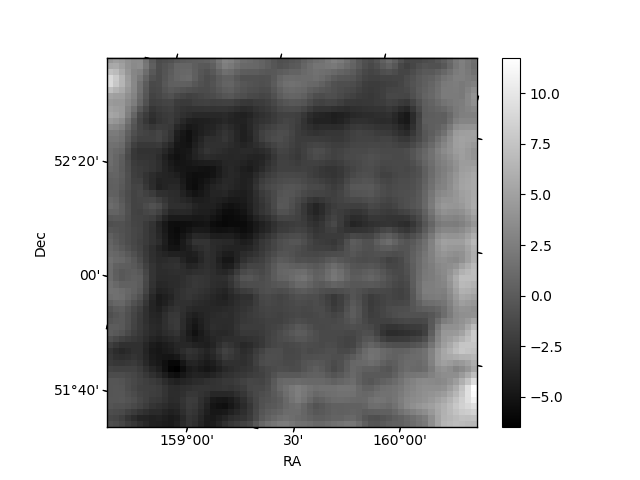
Histogram calculated using DETX and DETY for each event in the final _common_clean file
| Quadrant A | 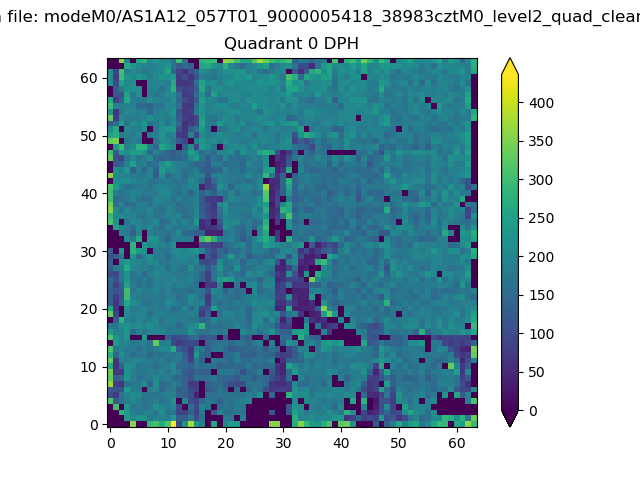 |
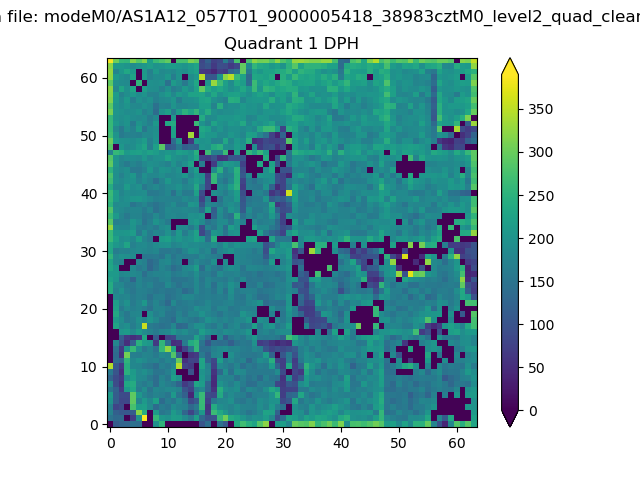 |
Quadrant B |
|---|---|---|---|
| Quadrant D | 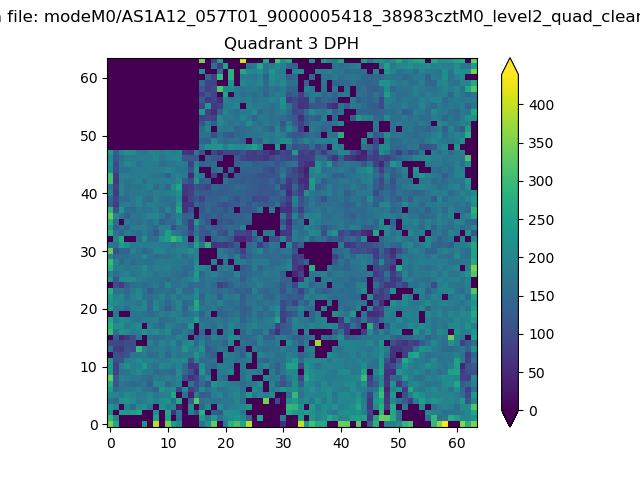 |
 |
Quadrant C |
| Plot type | Count rate plots | Images |
|---|---|---|
| Comparison with Poisson distribution Blue bars denote a histogram of data divided into 1 sec bins. Red curve is a Poisson curve with rate = median count rate of data. |
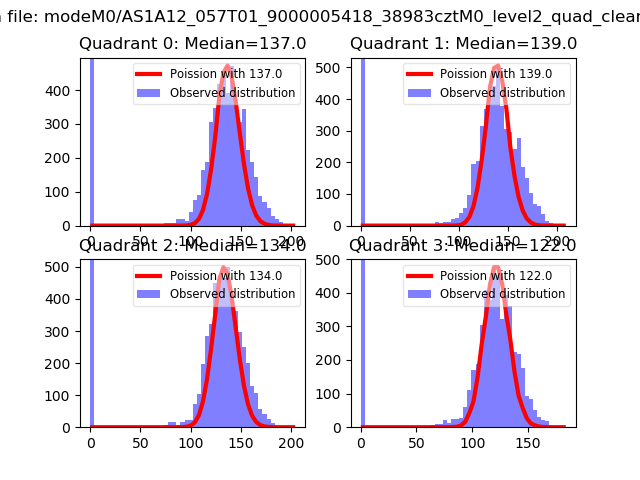 |
 |
| Quadrant-wise count rates Data is divided into 100 sec bins |
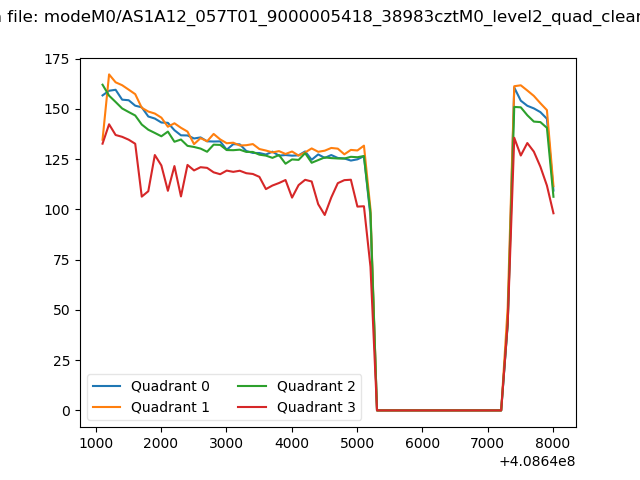 |
|
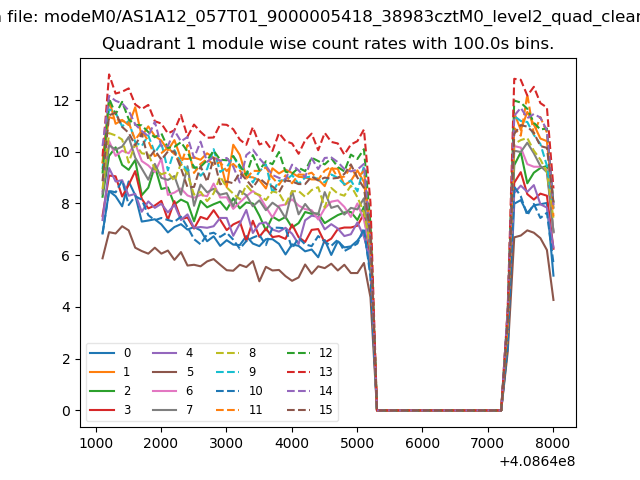
| Module-wise count rates for Quadrant A Data is divided into 100 sec bins |
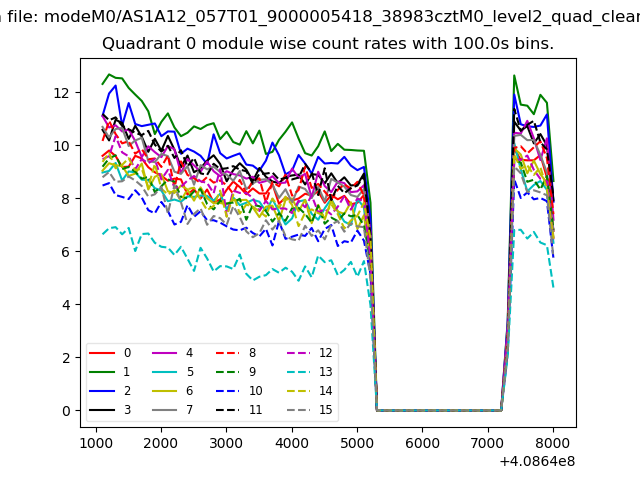 |
 |
| Module-wise count rates for Quadrant B Data is divided into 100 sec bins |
 |
 |
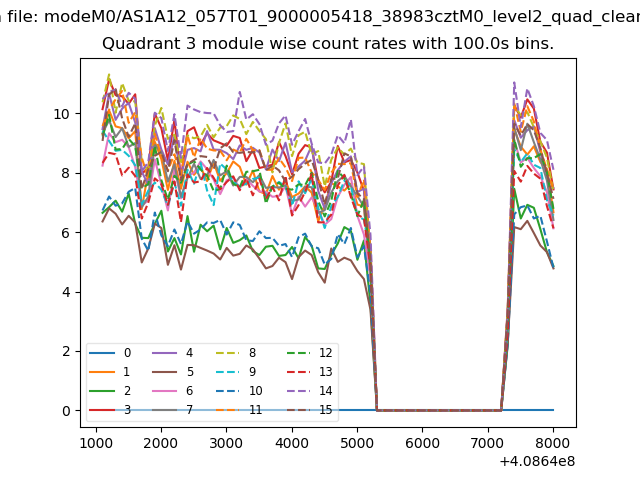
| Module-wise count rates for Quadrant C Data is divided into 100 sec bins |
 |
 |
| Module-wise count rates for Quadrant D Data is divided into 100 sec bins |
 |
 |
| Parameter | Plot |
|---|---|
| CZT HV Monitor | 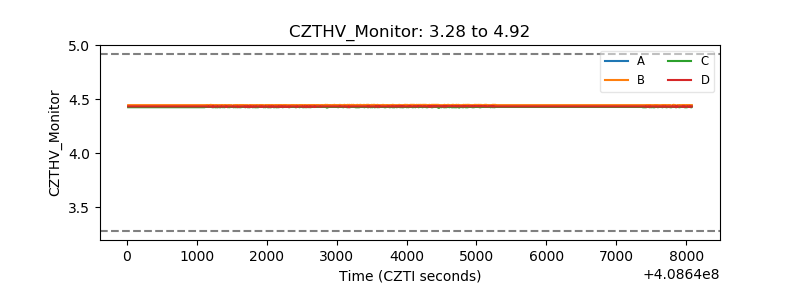 |
| D_VDD | 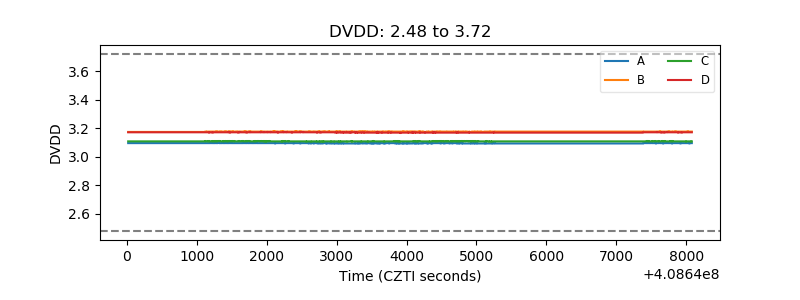 |
| Temperature 1 | 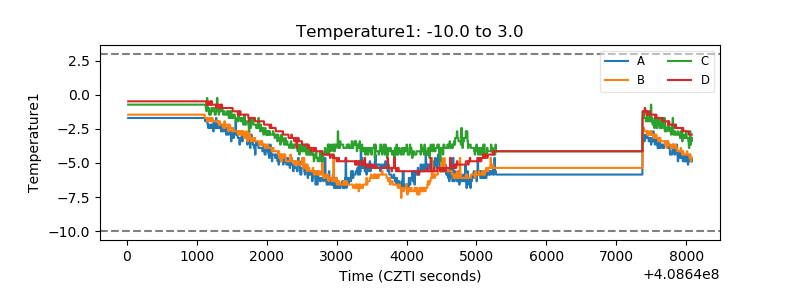 |
| Veto HV Monitor | 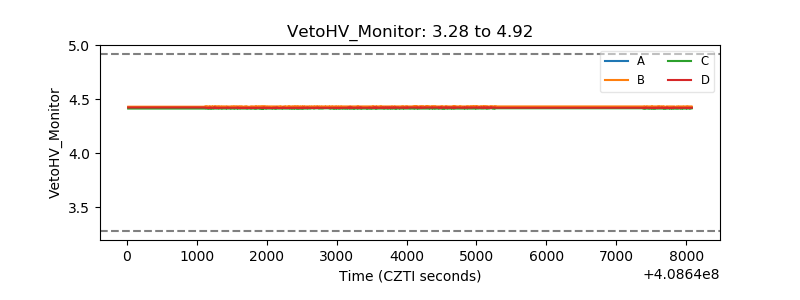 |
| Veto LLD | 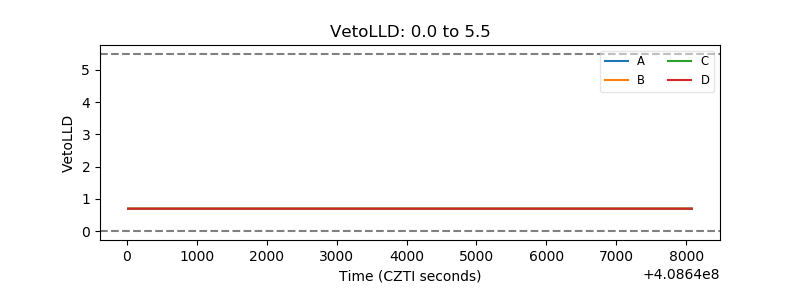 |
| Alpha Counter | 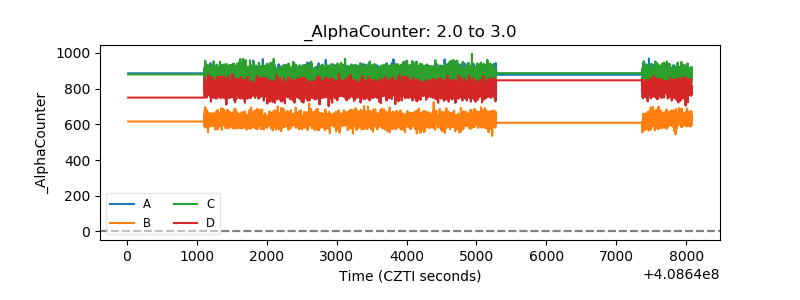 |
| _CPM_Rate | 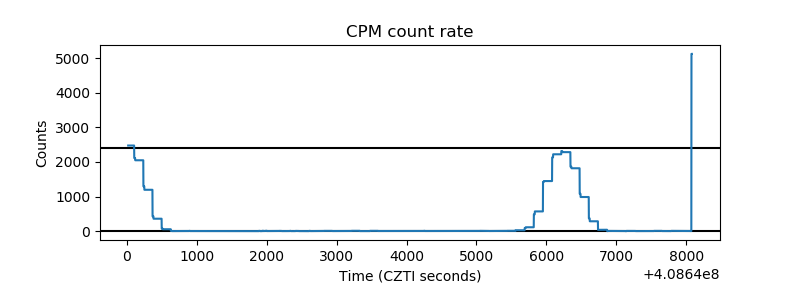 |
| CZT Counter | 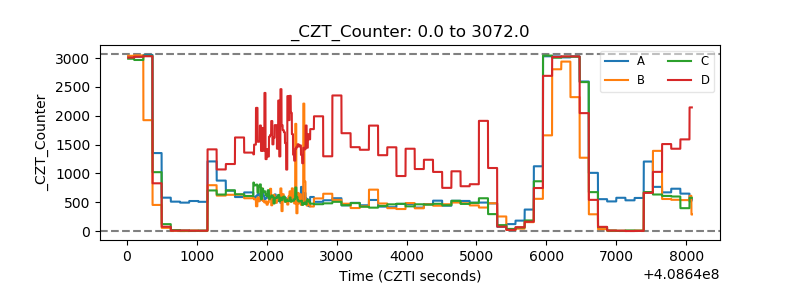 |
| +2.5 Volts monitor | 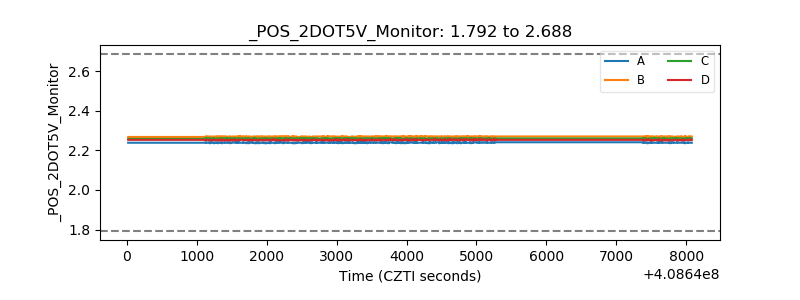 |
| +5 Volts monitor | 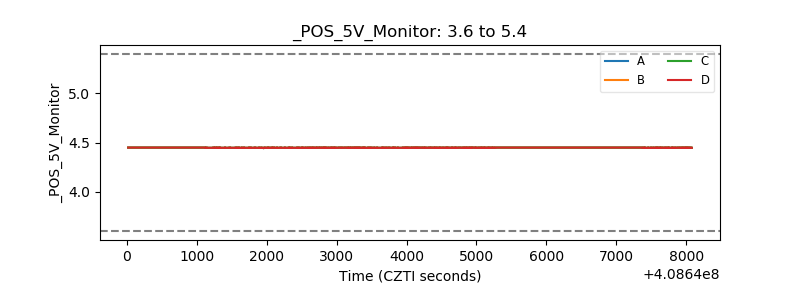 |
| _ROLL_ROT | 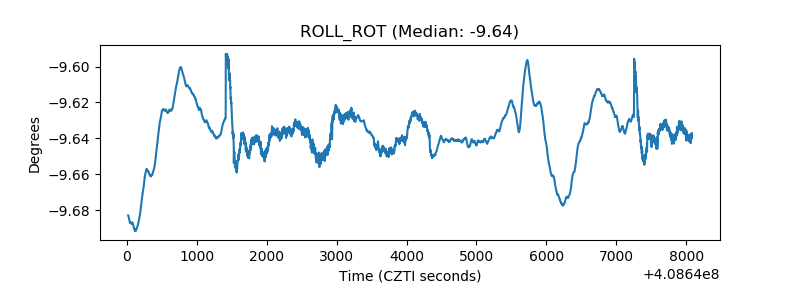 |
| _Roll_DEC | 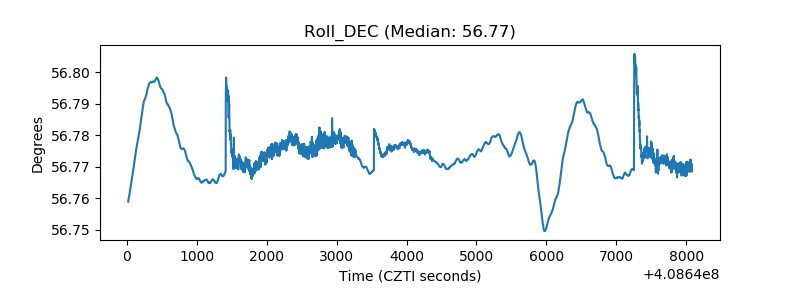 |
| _Roll_RA | 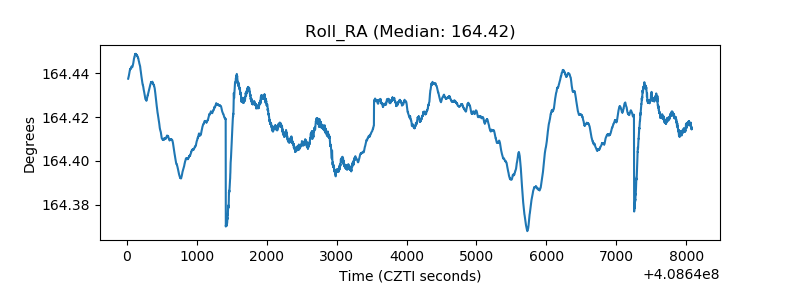 |
| Veto Counter | 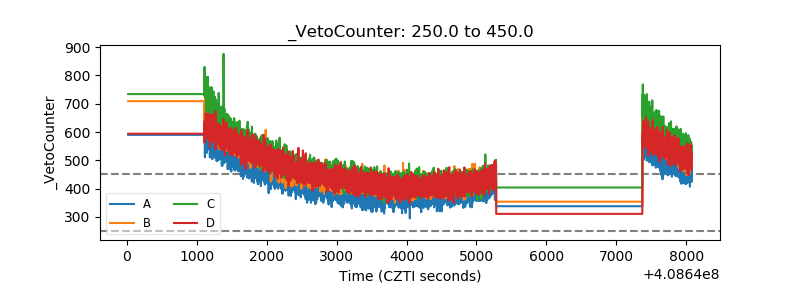 |