| Param | Original file | Final file |
|---|---|---|
| Filename | modeM0/AS1A12_057T01_9000005418_38985cztM0_level2.fits | modeM0/AS1A12_057T01_9000005418_38985cztM0_level2_quad_clean.evt |
| Size (bytes) | 106,038,720 | 28,546,560 |
| Size | 101.1 MB | 27.2 MB |
| Events in quadrant A | 887,497 | 193,479 |
| Events in quadrant B | 796,792 | 198,909 |
| Events in quadrant C | 770,078 | 190,659 |
| Events in quadrant D | 1,353,197 | 172,382 |
| Mode M9 | |||
|---|---|---|---|
| Quadrant | BADHDUFLAG | Total packets | Discarded packets |
| A | 0 | 22 | 0 |
| B | 0 | 22 | 0 |
| C | 0 | 22 | 0 |
| D | 0 | 22 | 0 |
| Mode SS | |||
|---|---|---|---|
| Quadrant | BADHDUFLAG | Total packets | Discarded packets |
| A | 0 | 30 | 0 |
| B | 0 | 30 | 0 |
| C | 0 | 30 | 0 |
| D | 0 | 30 | 0 |
| Mode M0 | |||
|---|---|---|---|
| Quadrant | BADHDUFLAG | Total packets | Discarded packets |
| A | 0 | 3568 | 1 |
| B | 0 | 3269 | 1 |
| C | 0 | 3106 | 1 |
| D | 0 | 5126 | 1 |
| Quadrant | Total seconds | Saturated seconds | Saturation percentage |
|---|---|---|---|
| A | 1478 | 6 | 0.405954% |
| B | 1478 | 17 | 1.150203% |
| C | 1478 | 1 | 0.067659% |
| D | 1478 | 55 | 3.721245% |
Noise dominated data is calculated using 1-second bins in cleaned event files. If a bin has >2000 counts, and if more than 50% of those come from <1% of pixels, then it is considered to be noise-dominated and hence unusable.
| Quadrant | # 1 sec bins | Bins with >0 counts | Bins with >2000 counts | High rate bins dominated by noise | Noise dominated (total time) | Noise dominated (detector-on time) | Marked lightcurve |
|---|---|---|---|---|---|---|---|
| A | 3631 | 1479 | 3 | 3 | 0.08% | 0.20% | 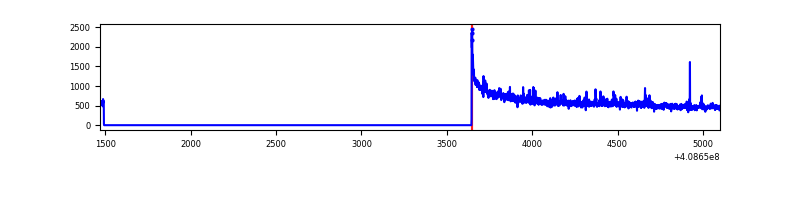 |
| B | 3631 | 1479 | 14 | 14 | 0.39% | 0.95% | 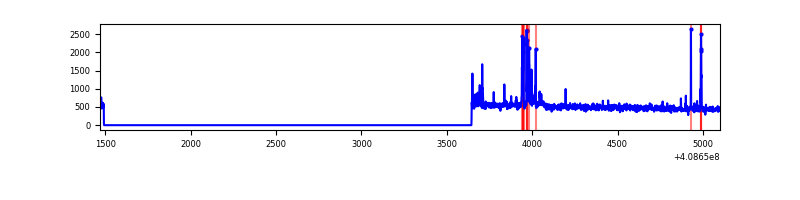 |
| C | 3631 | 1479 | 0 | 0 | 0.00% | 0.00% | 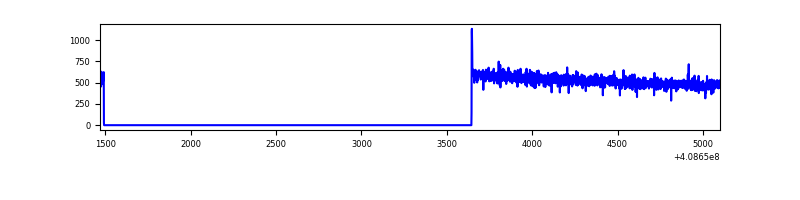 |
| D | 3631 | 1479 | 45 | 45 | 1.24% | 3.04% | 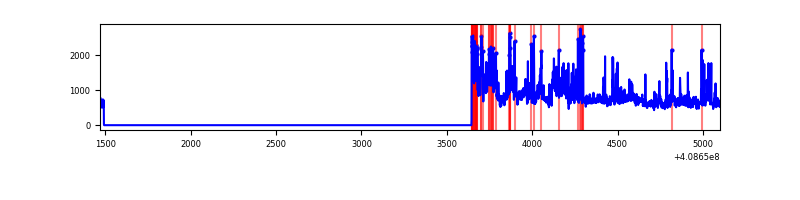 |
Top three noisy pixels from each quadrant. If the there are fewer than three noisy pixels in the level2.evt file, extra rows are filled as -1
| Pixel properties | Quadrant properties | ||||||
|---|---|---|---|---|---|---|---|
| Quadrant | DetID | PixID | Counts | Sigma | Mean | Median | Sigma |
| A | 10 | 83 | 156756 | 4206.66 | 176 | 172 | 37.2 |
| A | 15 | 222 | 34803 | 930.37 | 176 | 172 | 37.2 |
| A | 13 | 248 | 5204 | 135.19 | 176 | 172 | 37.2 |
| B | 5 | 172 | 66087 | 1858.85 | 178 | 174 | 35.5 |
| B | 0 | 230 | 27154 | 760.88 | 178 | 174 | 35.5 |
| B | 12 | 111 | 4124 | 111.4 | 178 | 174 | 35.5 |
| C | 15 | 214 | 68524 | 1610.65 | 178 | 181 | 42.4 |
| C | 1 | 128 | 1629 | 34.13 | 178 | 181 | 42.4 |
| C | 0 | 10 | 1608 | 33.63 | 178 | 181 | 42.4 |
| D | 12 | 235 | 441514 | 10052.06 | 174 | 169 | 43.9 |
| D | 1 | 47 | 133525 | 3037.31 | 174 | 169 | 43.9 |
| D | 12 | 227 | 79510 | 1807.07 | 174 | 169 | 43.9 |
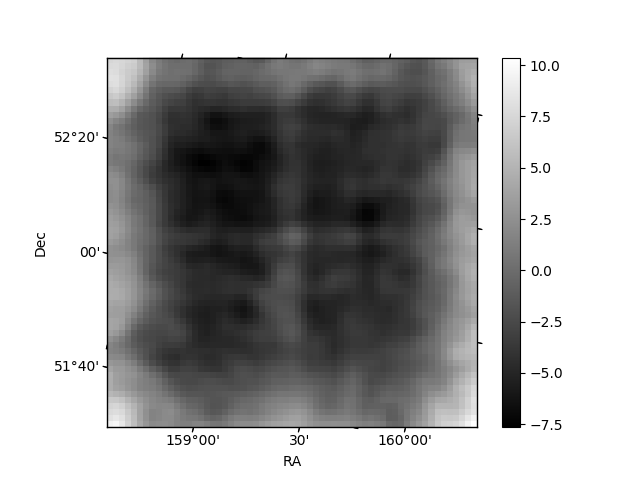
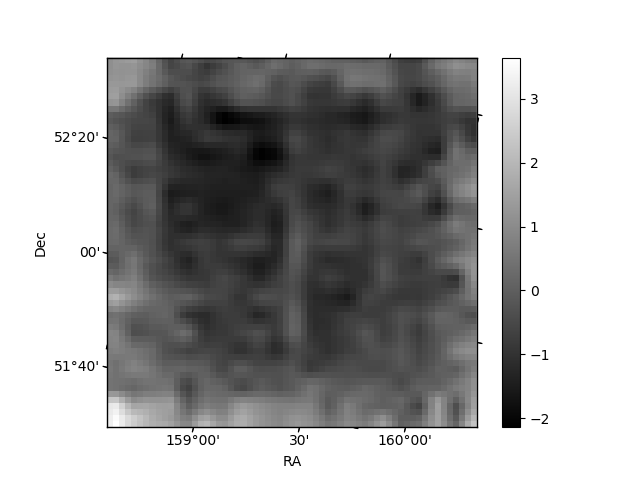
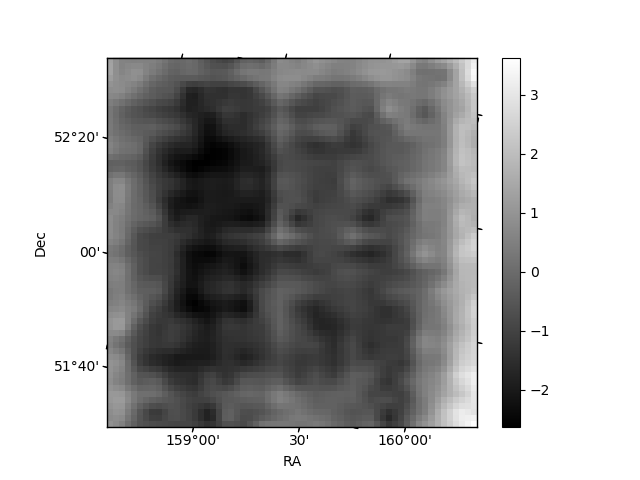
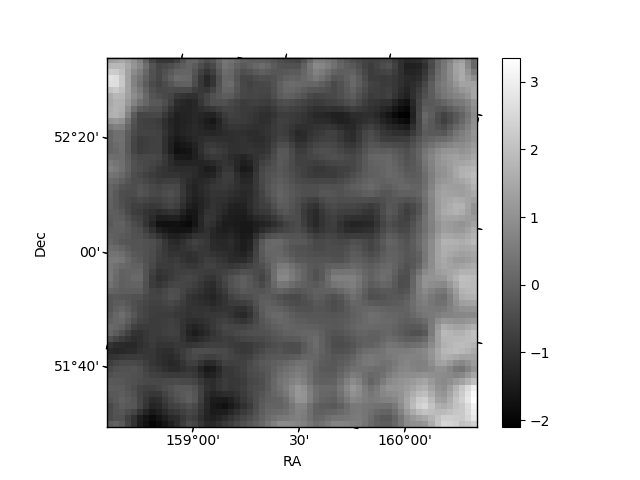
Histogram calculated using DETX and DETY for each event in the final _common_clean file
| Quadrant A | 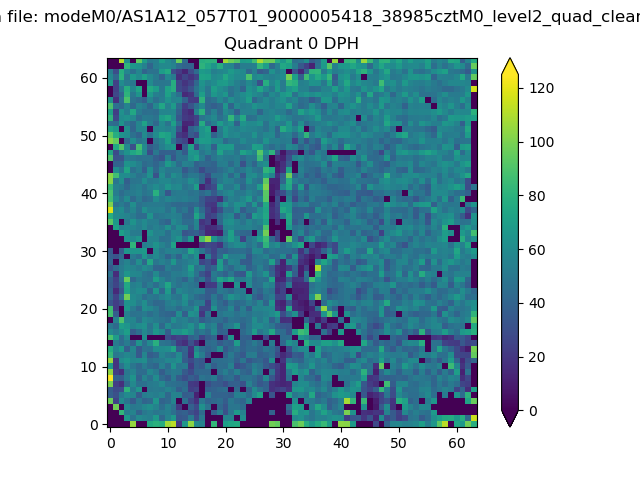 |
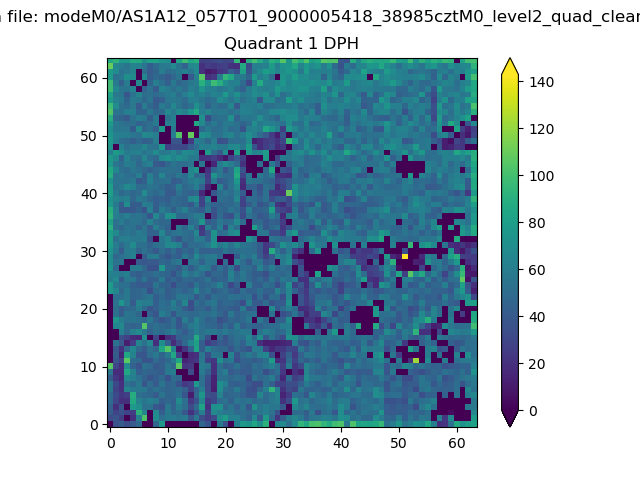 |
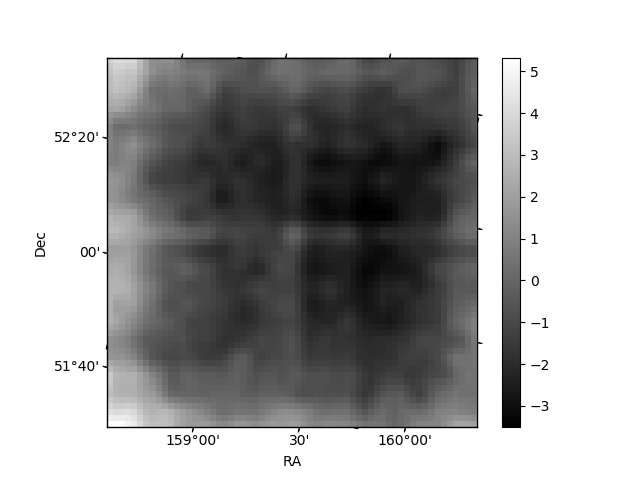
Quadrant B |
|---|---|---|---|
| Quadrant D | 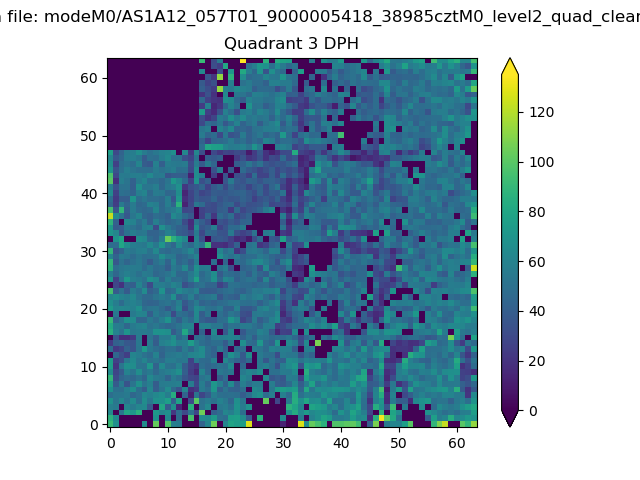 |
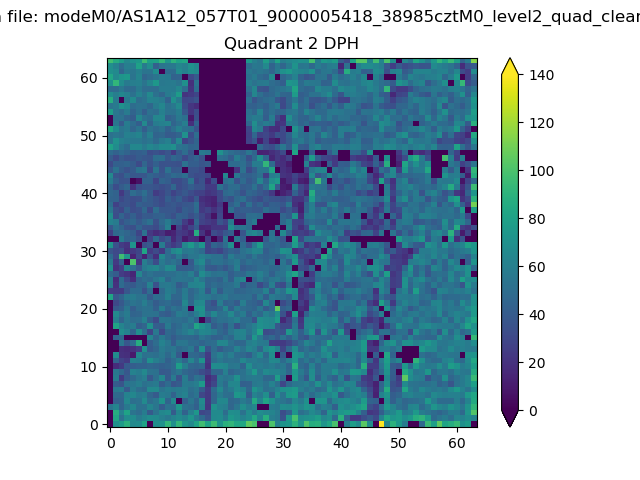 |
Quadrant C |
| Plot type | Count rate plots | Images |
|---|---|---|
| Comparison with Poisson distribution Blue bars denote a histogram of data divided into 1 sec bins. Red curve is a Poisson curve with rate = median count rate of data. |
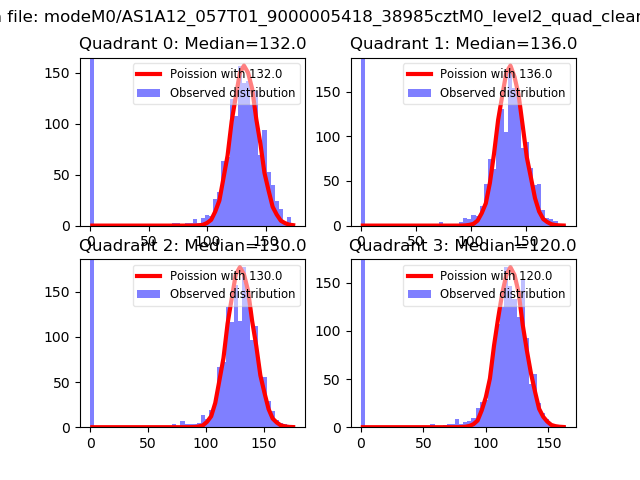 |
 |
| Quadrant-wise count rates Data is divided into 100 sec bins |
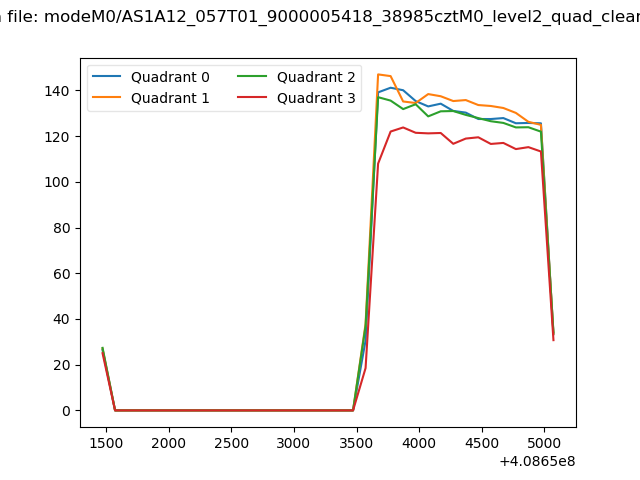 |
|
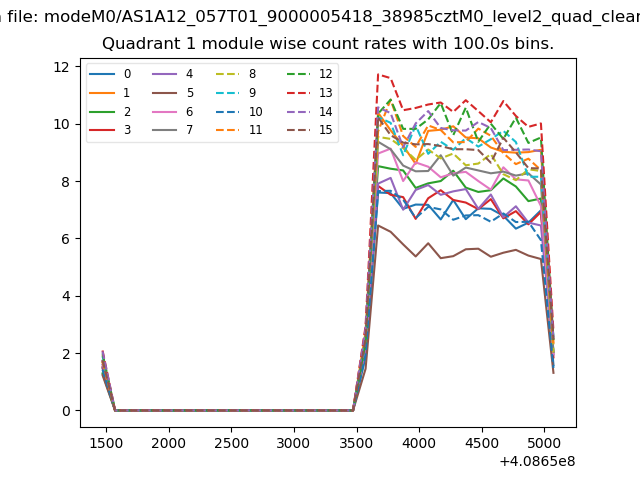
| Module-wise count rates for Quadrant A Data is divided into 100 sec bins |
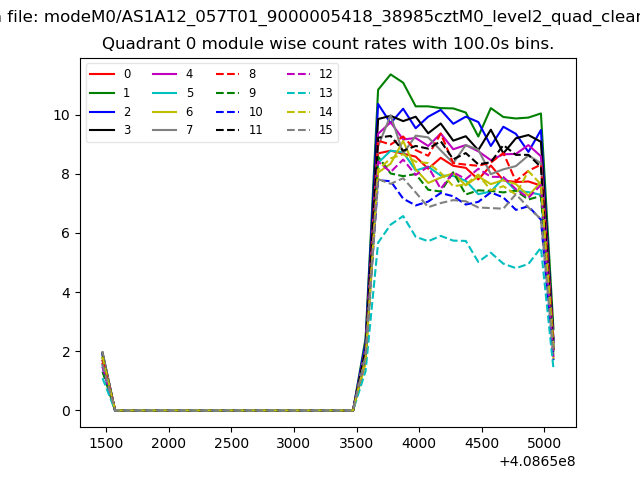 |
 |
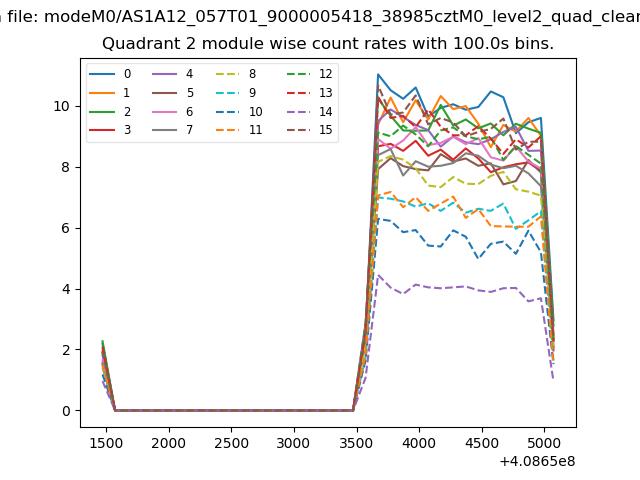
| Module-wise count rates for Quadrant B Data is divided into 100 sec bins |
 |
 |
| Module-wise count rates for Quadrant C Data is divided into 100 sec bins |
 |
 |
| Module-wise count rates for Quadrant D Data is divided into 100 sec bins |
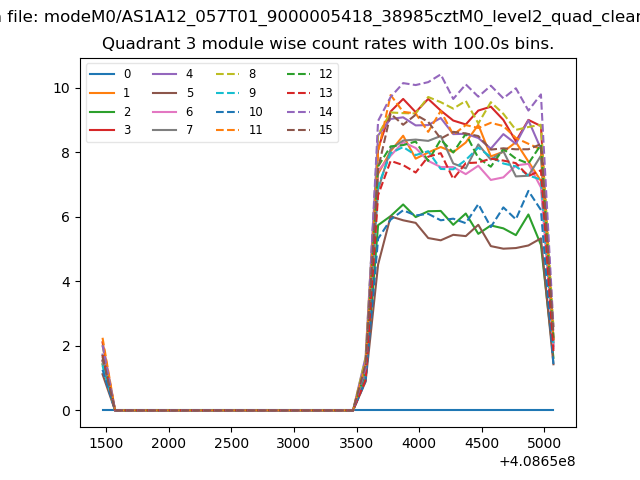 |
 |
| Parameter | Plot |
|---|---|
| CZT HV Monitor | 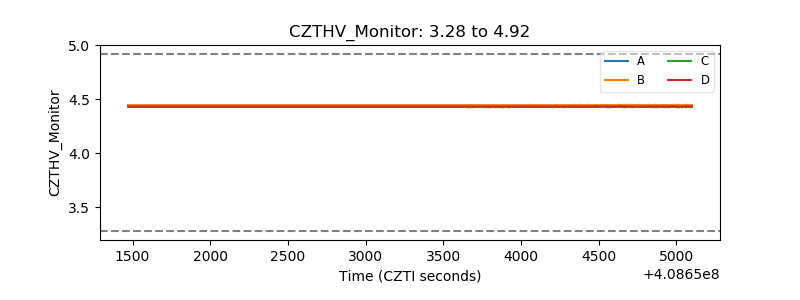 |
| D_VDD | 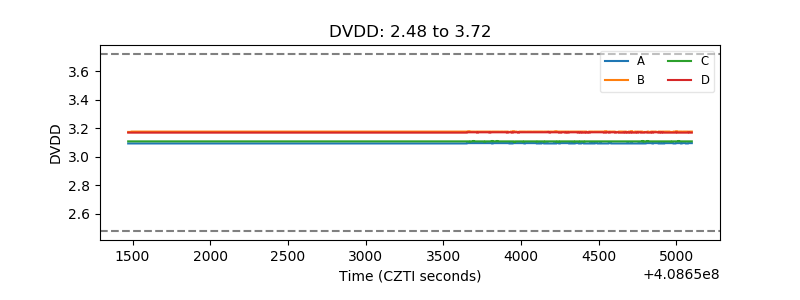 |
| Temperature 1 | 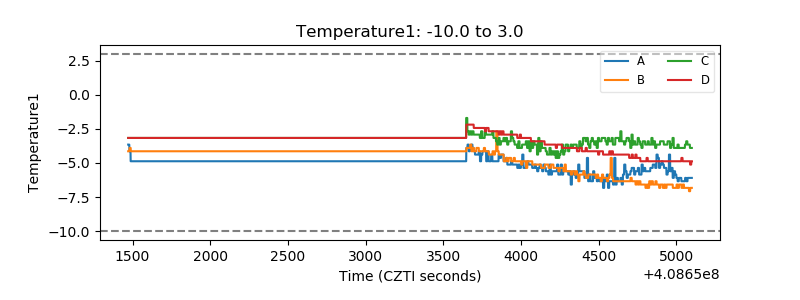 |
| Veto HV Monitor | 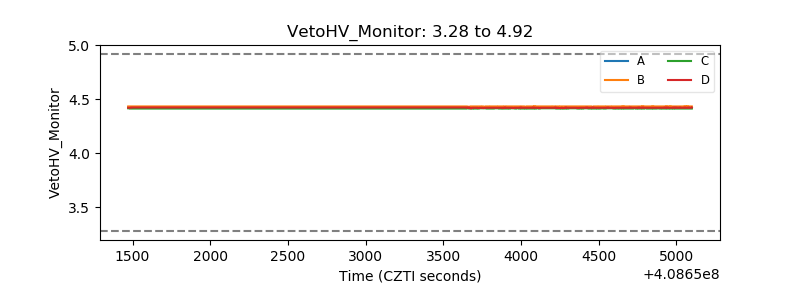 |
| Veto LLD | 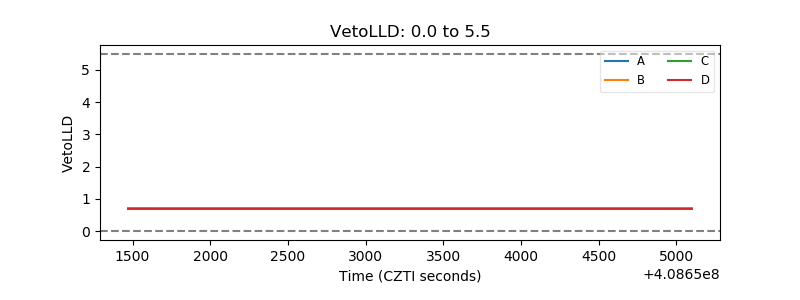 |
| Alpha Counter | 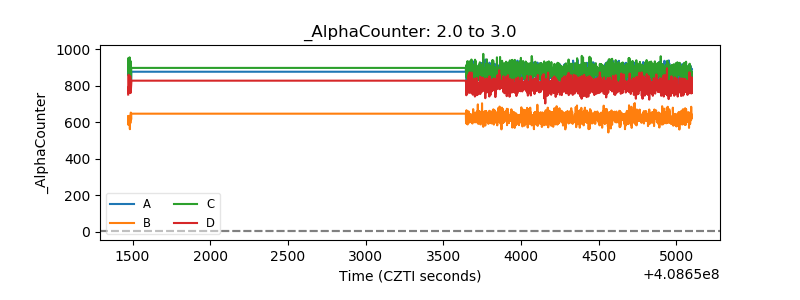 |
| _CPM_Rate | 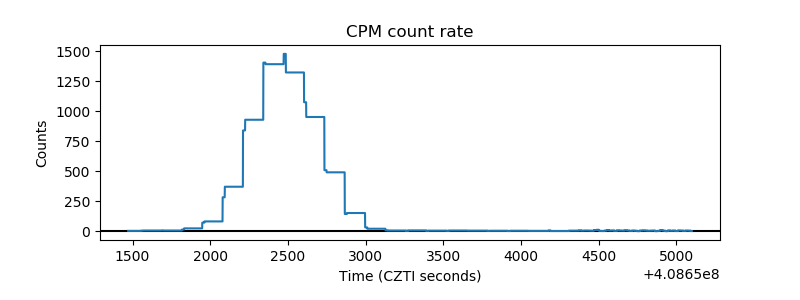 |
| CZT Counter | 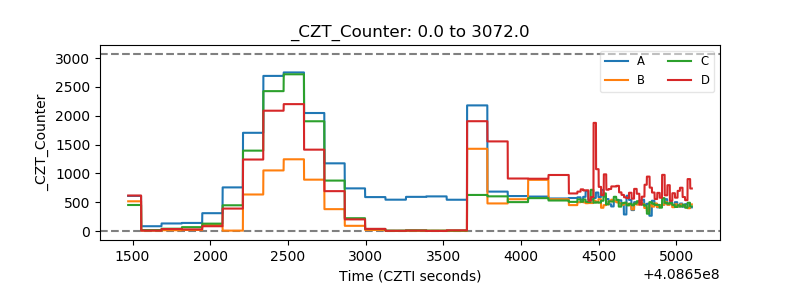 |
| +2.5 Volts monitor | 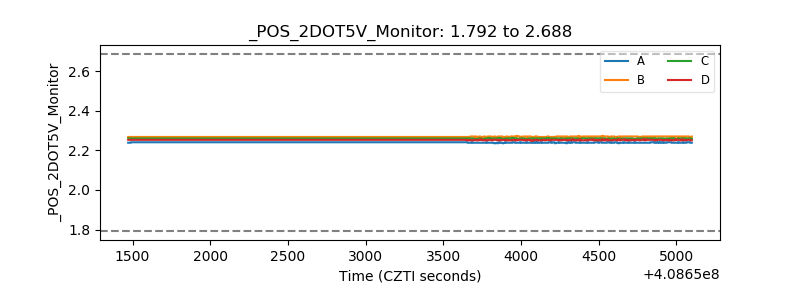 |
| +5 Volts monitor | 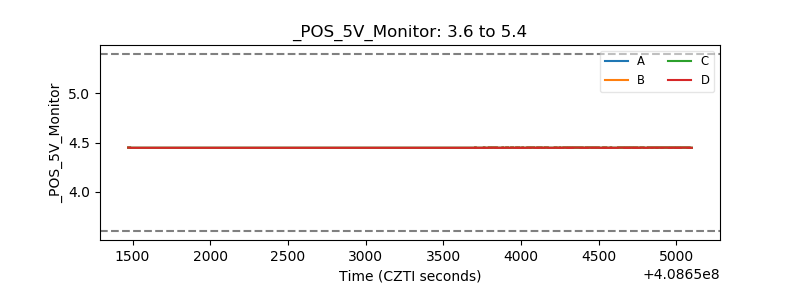 |
| _ROLL_ROT | 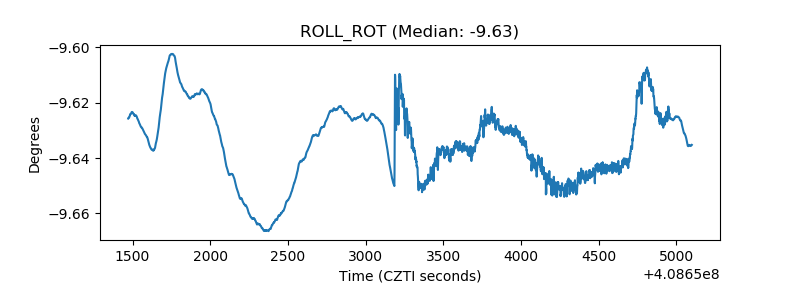 |
| _Roll_DEC | 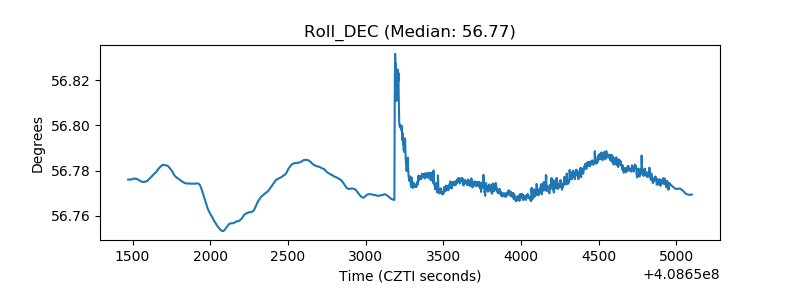 |
| _Roll_RA | 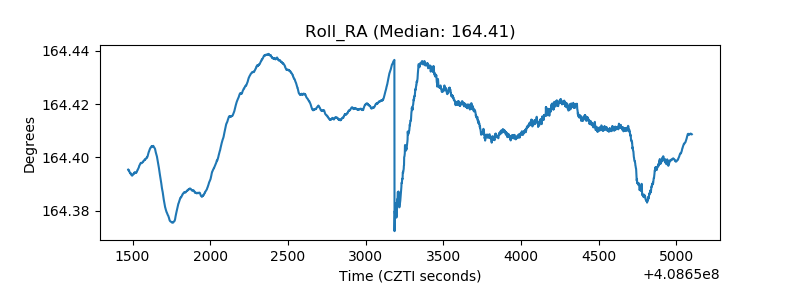 |
| Veto Counter | 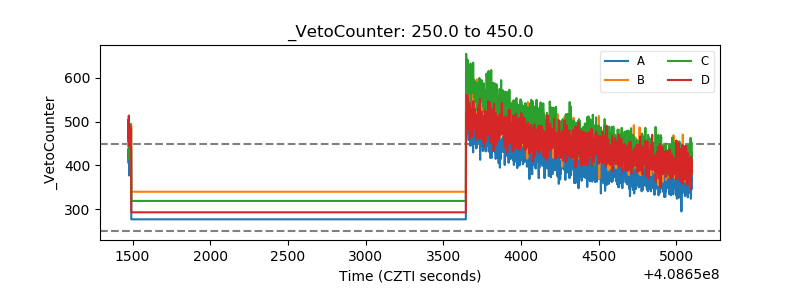 |