| Param | Original file | Final file |
|---|---|---|
| Filename | modeM0/AS1A12_095T02_9000005420_38985cztM0_level2.fits | modeM0/AS1A12_095T02_9000005420_38985cztM0_level2_quad_clean.evt |
| Size (bytes) | 182,923,200 | 50,973,120 |
| Size | 174.4 MB | 48.6 MB |
| Events in quadrant A | 1,589,755 | 342,800 |
| Events in quadrant B | 1,332,356 | 352,749 |
| Events in quadrant C | 1,387,534 | 338,298 |
| Events in quadrant D | 2,240,902 | 308,985 |
| Mode M0 | |||
|---|---|---|---|
| Quadrant | BADHDUFLAG | Total packets | Discarded packets |
| A | 0 | 6513 | 1 |
| B | 0 | 5766 | 0 |
| C | 0 | 5761 | 0 |
| D | 0 | 8681 | 0 |
| Mode SS | |||
|---|---|---|---|
| Quadrant | BADHDUFLAG | Total packets | Discarded packets |
| A | 0 | 58 | 0 |
| B | 0 | 58 | 0 |
| C | 0 | 58 | 0 |
| D | 0 | 58 | 0 |
| Mode M9 | |||
|---|---|---|---|
| Quadrant | BADHDUFLAG | Total packets | Discarded packets |
| A | 0 | 22 | 0 |
| B | 0 | 22 | 0 |
| C | 0 | 22 | 0 |
| D | 0 | 22 | 0 |
| Quadrant | Total seconds | Saturated seconds | Saturation percentage |
|---|---|---|---|
| A | 2812 | 12 | 0.426743% |
| B | 2812 | 2 | 0.071124% |
| C | 2812 | 4 | 0.142248% |
| D | 2812 | 60 | 2.133713% |
Noise dominated data is calculated using 1-second bins in cleaned event files. If a bin has >2000 counts, and if more than 50% of those come from <1% of pixels, then it is considered to be noise-dominated and hence unusable.
| Quadrant | # 1 sec bins | Bins with >0 counts | Bins with >2000 counts | High rate bins dominated by noise | Noise dominated (total time) | Noise dominated (detector-on time) | Marked lightcurve |
|---|---|---|---|---|---|---|---|
| A | 4935 | 2813 | 4 | 4 | 0.08% | 0.14% | 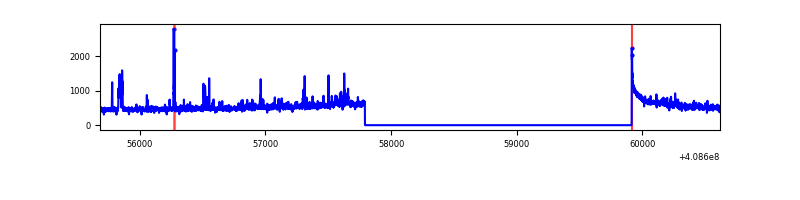 |
| B | 4935 | 2813 | 2 | 2 | 0.04% | 0.07% | 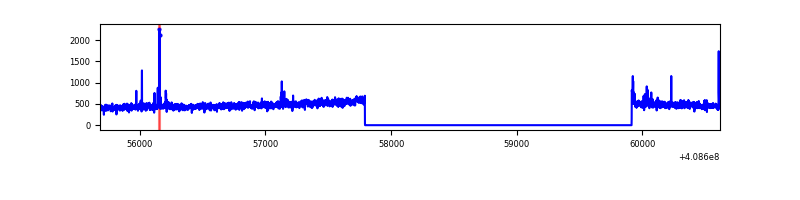 |
| C | 4935 | 2813 | 1 | 1 | 0.02% | 0.04% | 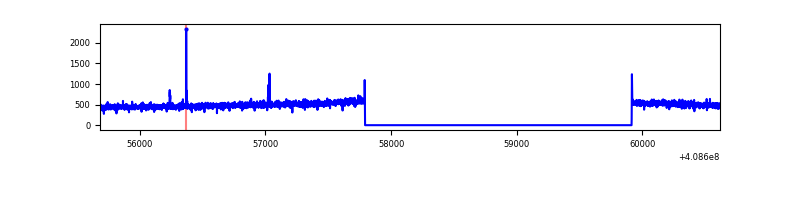 |
| D | 4935 | 2813 | 68 | 68 | 1.38% | 2.42% | 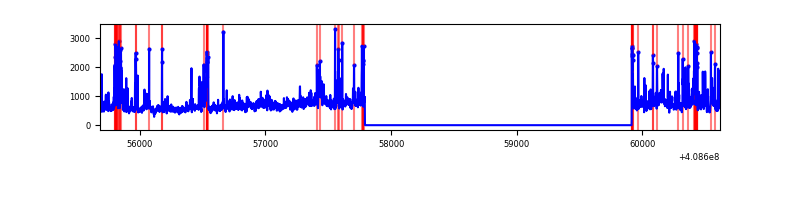 |
Top three noisy pixels from each quadrant. If the there are fewer than three noisy pixels in the level2.evt file, extra rows are filled as -1
| Pixel properties | Quadrant properties | ||||||
|---|---|---|---|---|---|---|---|
| Quadrant | DetID | PixID | Counts | Sigma | Mean | Median | Sigma |
| A | 10 | 83 | 209760 | 3083.97 | 328 | 321 | 67.9 |
| A | 15 | 222 | 92457 | 1356.7 | 328 | 321 | 67.9 |
| A | 9 | 143 | 15211 | 219.25 | 328 | 321 | 67.9 |
| B | 5 | 172 | 34013 | 527.46 | 325 | 317 | 63.9 |
| B | 0 | 230 | 8239 | 124.01 | 325 | 317 | 63.9 |
| B | 12 | 111 | 7844 | 117.82 | 325 | 317 | 63.9 |
| C | 15 | 214 | 123859 | 1631.69 | 320 | 323 | 75.7 |
| C | 14 | 254 | 5341 | 66.28 | 320 | 323 | 75.7 |
| C | 12 | 249 | 4071 | 49.5 | 320 | 323 | 75.7 |
| D | 12 | 235 | 776868 | 10067.11 | 317 | 309 | 77.1 |
| D | 12 | 227 | 139811 | 1808.47 | 317 | 309 | 77.1 |
| D | 1 | 47 | 62020 | 800.01 | 317 | 309 | 77.1 |
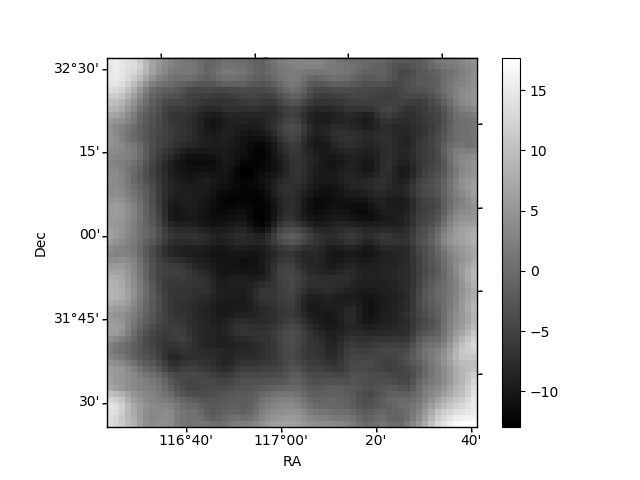
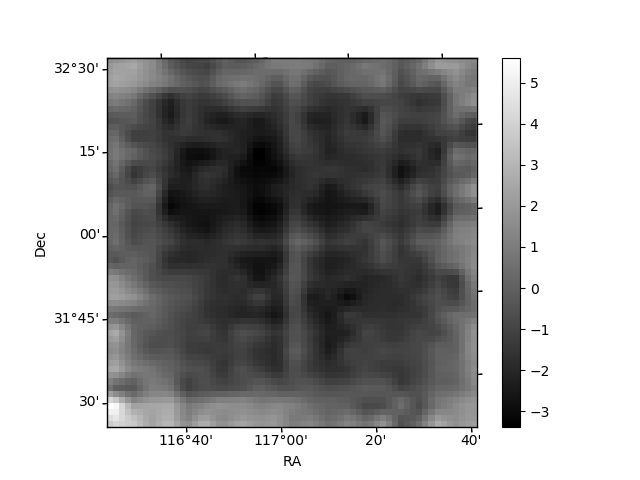
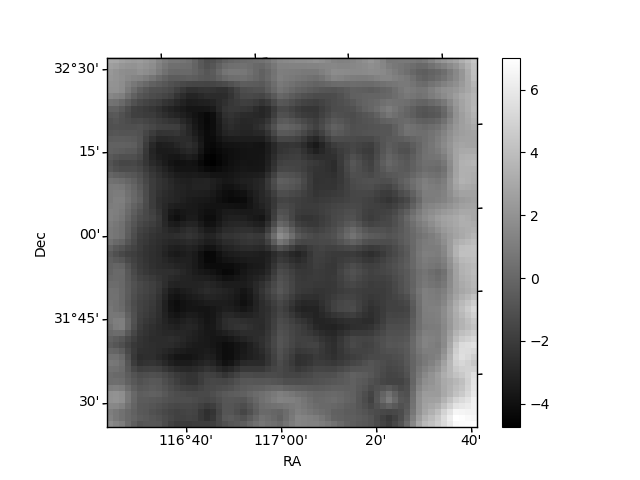
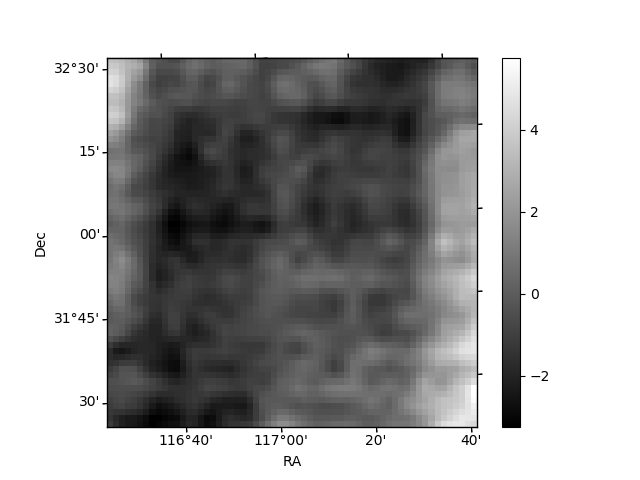
Histogram calculated using DETX and DETY for each event in the final _common_clean file
| Quadrant A | 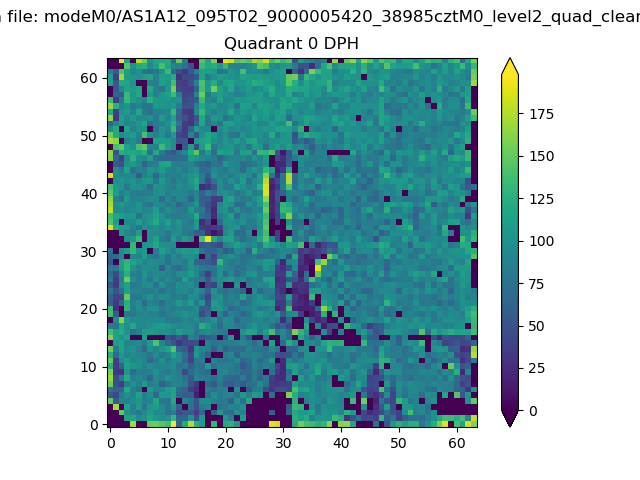 |
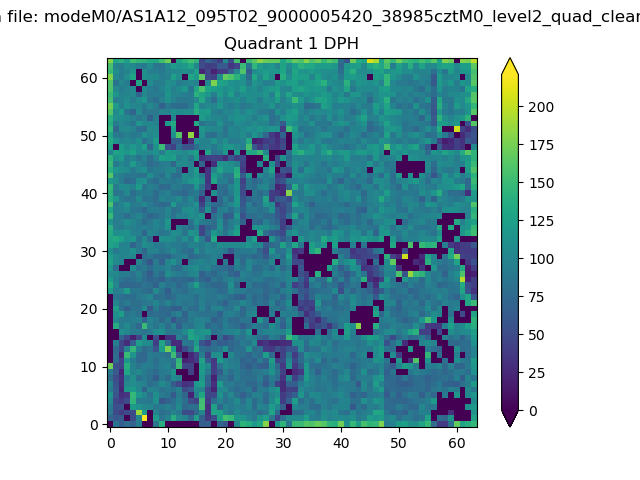 |
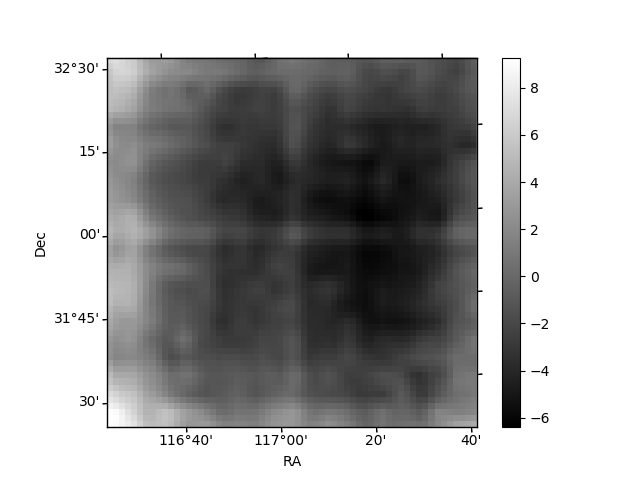
Quadrant B |
|---|---|---|---|
| Quadrant D | 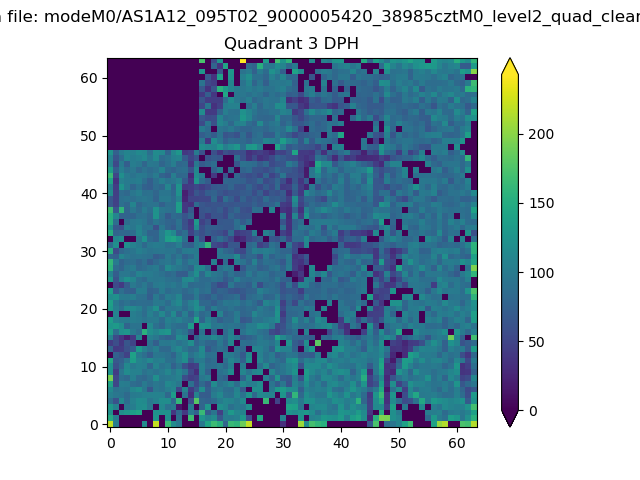 |
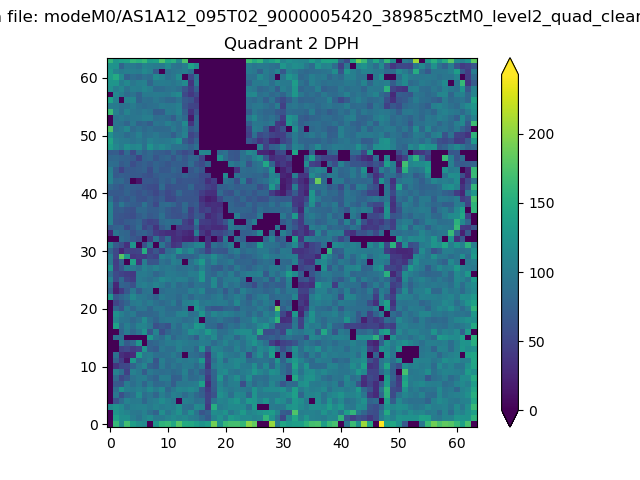 |
Quadrant C |
| Plot type | Count rate plots | Images |
|---|---|---|
| Comparison with Poisson distribution Blue bars denote a histogram of data divided into 1 sec bins. Red curve is a Poisson curve with rate = median count rate of data. |
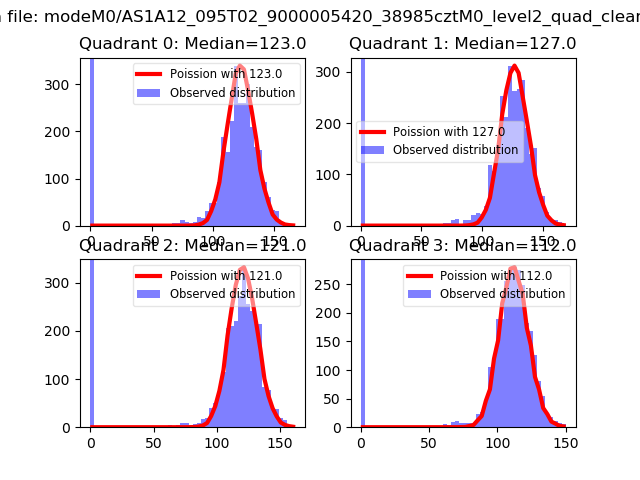 |
 |
| Quadrant-wise count rates Data is divided into 100 sec bins |
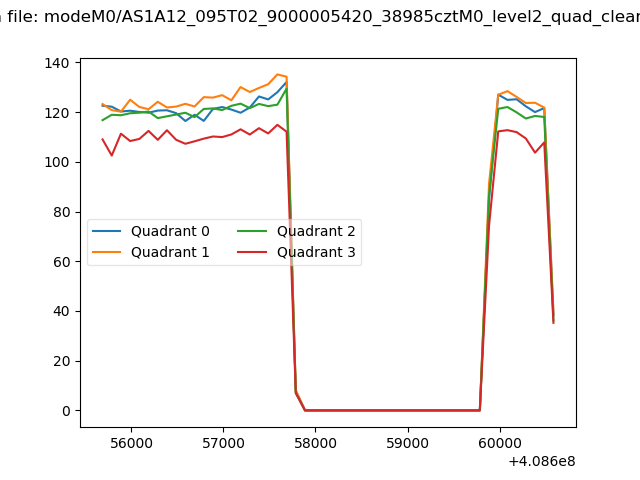 |
|
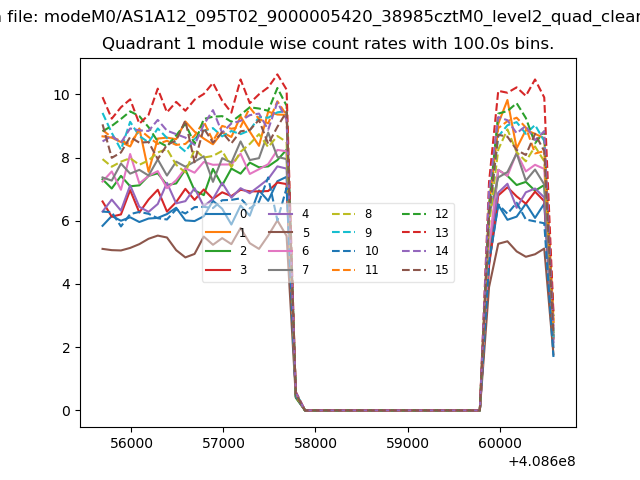
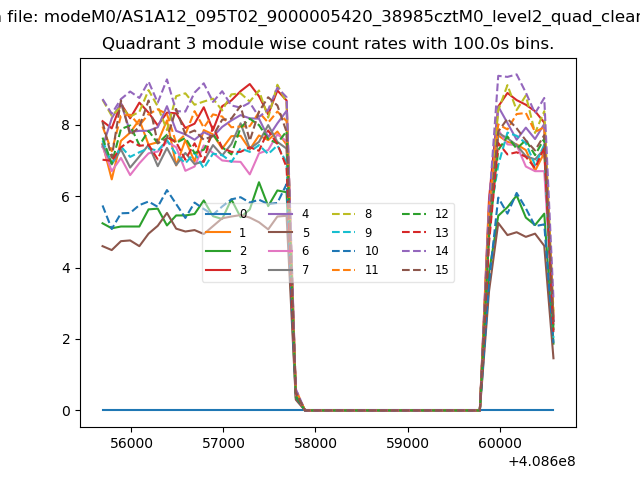
| Module-wise count rates for Quadrant A Data is divided into 100 sec bins |
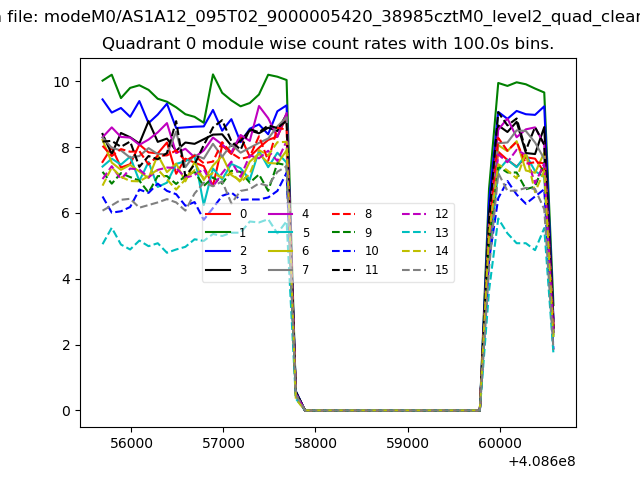 |
 |
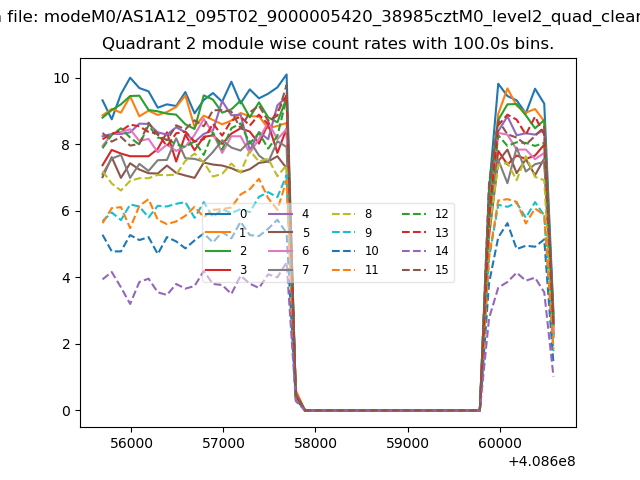
| Module-wise count rates for Quadrant B Data is divided into 100 sec bins |
 |
 |
| Module-wise count rates for Quadrant C Data is divided into 100 sec bins |
 |
 |
| Module-wise count rates for Quadrant D Data is divided into 100 sec bins |
 |
 |
| Parameter | Plot |
|---|---|
| CZT HV Monitor |  |
| D_VDD | 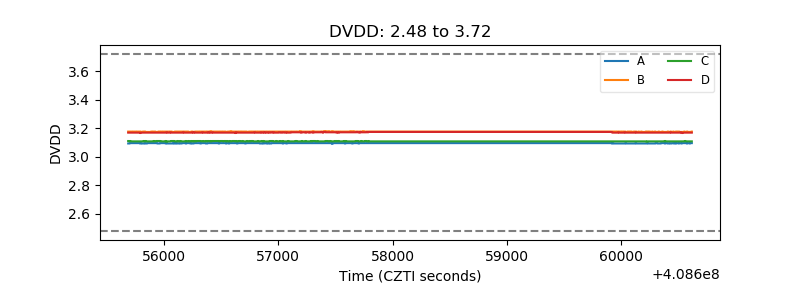 |
| Temperature 1 | 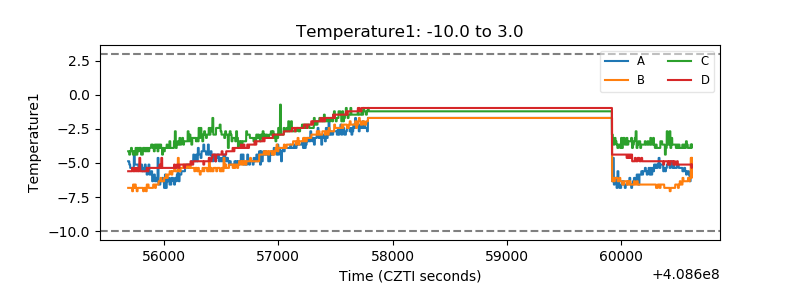 |
| Veto HV Monitor | 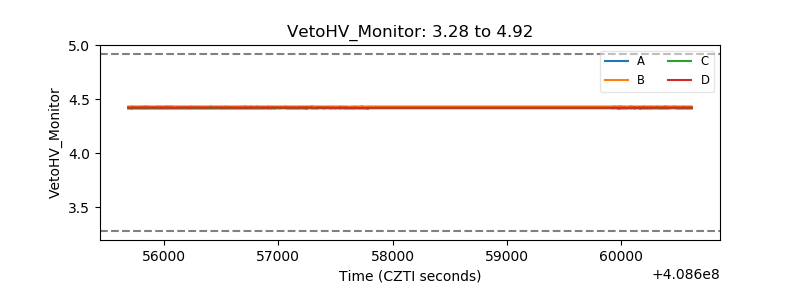 |
| Veto LLD | 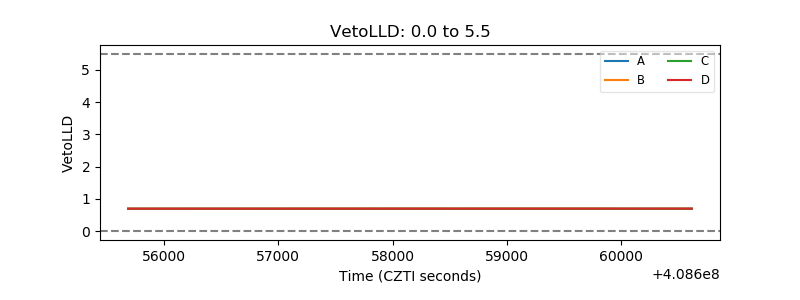 |
| Alpha Counter | 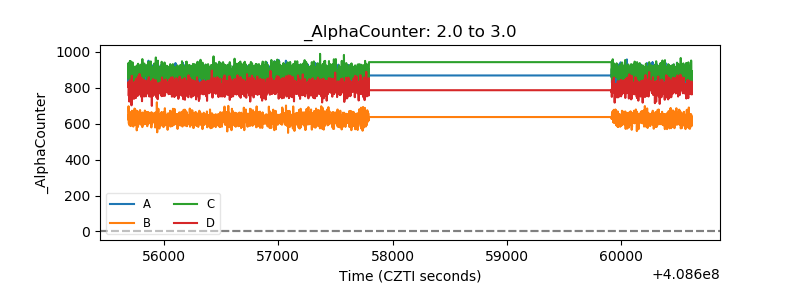 |
| _CPM_Rate | 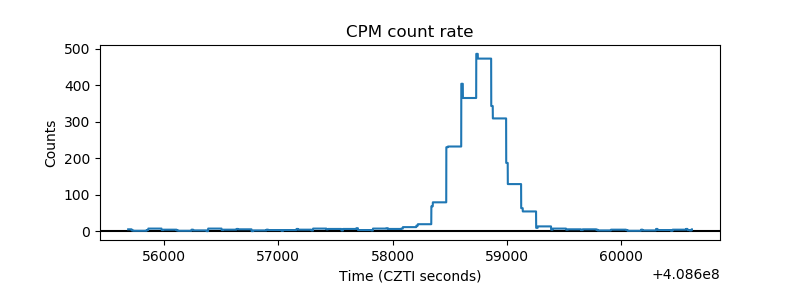 |
| CZT Counter | 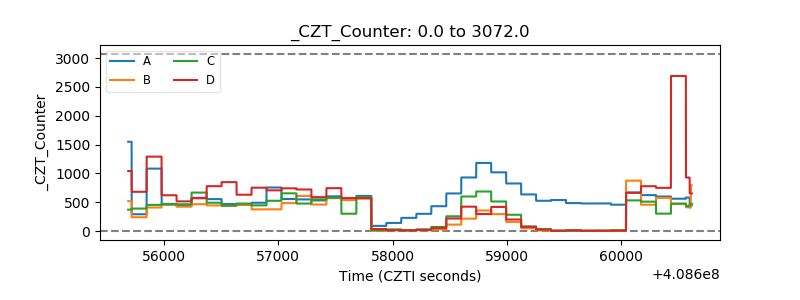 |
| +2.5 Volts monitor | 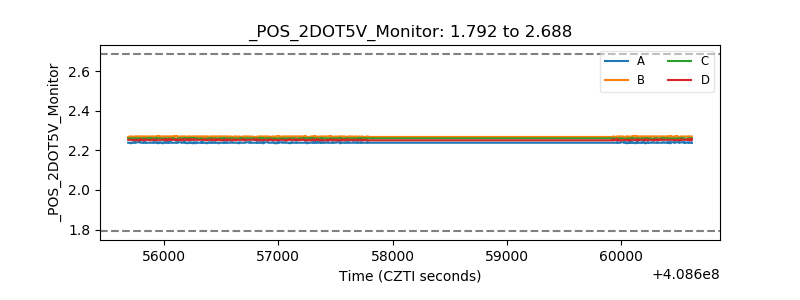 |
| +5 Volts monitor | 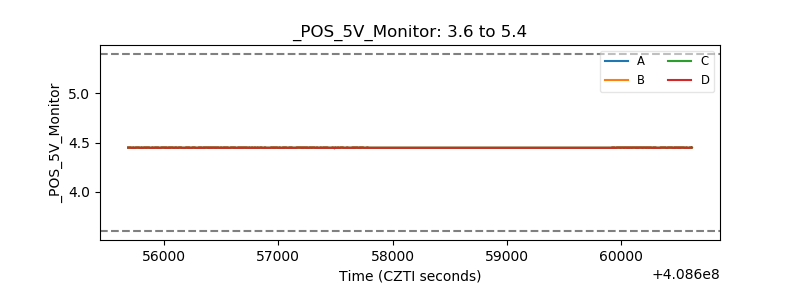 |
| _ROLL_ROT | 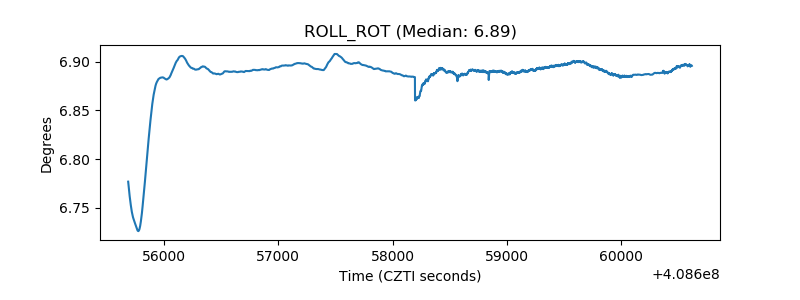 |
| _Roll_DEC | 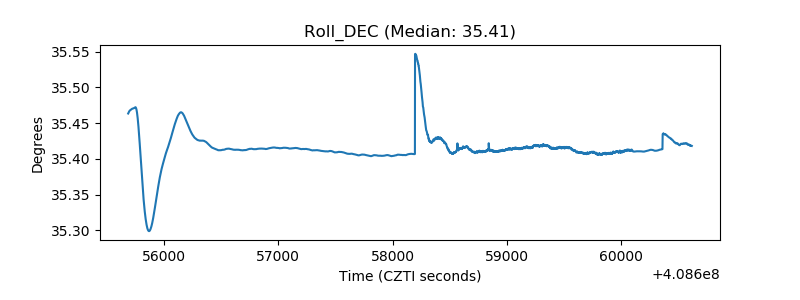 |
| _Roll_RA | 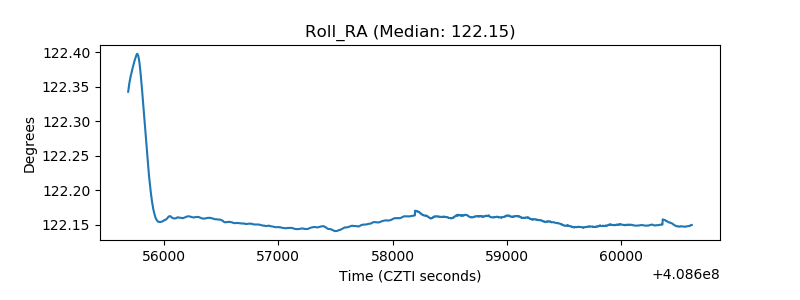 |
| Veto Counter | 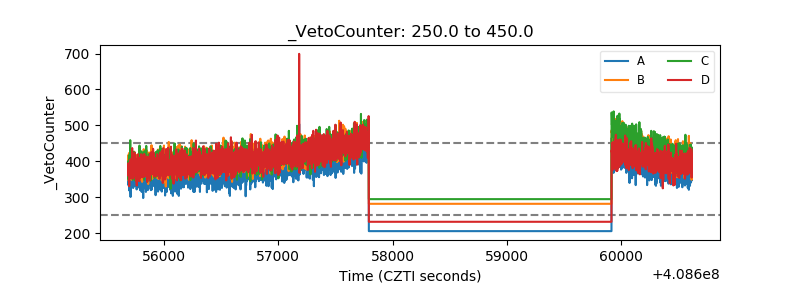 |