| Param | Original file | Final file |
|---|---|---|
| Filename | modeM0/AS1A12_095T02_9000005420_38986cztM0_level2.fits | modeM0/AS1A12_095T02_9000005420_38986cztM0_level2_quad_clean.evt |
| Size (bytes) | 330,488,640 | 89,599,680 |
| Size | 315.2 MB | 85.4 MB |
| Events in quadrant A | 2,699,261 | 607,922 |
| Events in quadrant B | 2,334,528 | 621,560 |
| Events in quadrant C | 2,495,157 | 592,831 |
| Events in quadrant D | 4,300,621 | 528,043 |
| Mode M0 | |||
|---|---|---|---|
| Quadrant | BADHDUFLAG | Total packets | Discarded packets |
| A | 0 | 11273 | 2 |
| B | 0 | 10532 | 1 |
| C | 0 | 10630 | 1 |
| D | 0 | 16363 | 1 |
| Mode SS | |||
|---|---|---|---|
| Quadrant | BADHDUFLAG | Total packets | Discarded packets |
| A | 0 | 104 | 0 |
| B | 0 | 104 | 0 |
| C | 0 | 104 | 0 |
| D | 0 | 104 | 0 |
| Mode M9 | |||
|---|---|---|---|
| Quadrant | BADHDUFLAG | Total packets | Discarded packets |
| A | 0 | 31 | 0 |
| B | 0 | 31 | 0 |
| C | 0 | 31 | 0 |
| D | 0 | 32 | 0 |
| Quadrant | Total seconds | Saturated seconds | Saturation percentage |
|---|---|---|---|
| A | 5183 | 16 | 0.308702% |
| B | 5183 | 9 | 0.173645% |
| C | 5183 | 3 | 0.057882% |
| D | 5183 | 309 | 5.961798% |
Noise dominated data is calculated using 1-second bins in cleaned event files. If a bin has >2000 counts, and if more than 50% of those come from <1% of pixels, then it is considered to be noise-dominated and hence unusable.
| Quadrant | # 1 sec bins | Bins with >0 counts | Bins with >2000 counts | High rate bins dominated by noise | Noise dominated (total time) | Noise dominated (detector-on time) | Marked lightcurve |
|---|---|---|---|---|---|---|---|
| A | 7096 | 5184 | 4 | 4 | 0.06% | 0.08% | 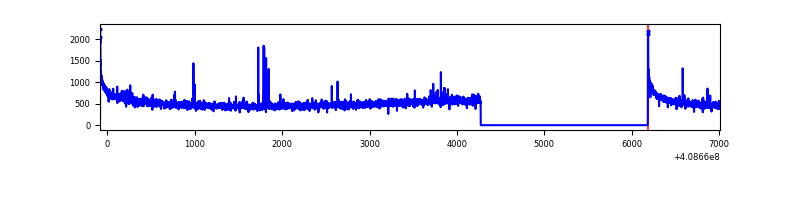 |
| B | 7096 | 5184 | 1 | 1 | 0.01% | 0.02% | 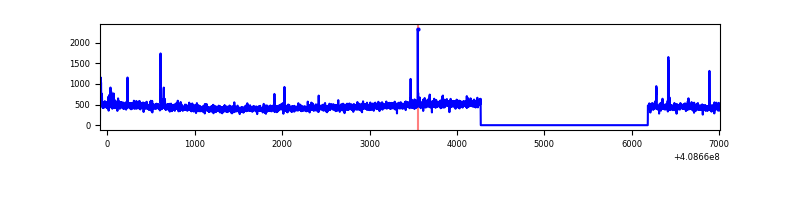 |
| C | 7096 | 5184 | 0 | 0 | 0.00% | 0.00% | 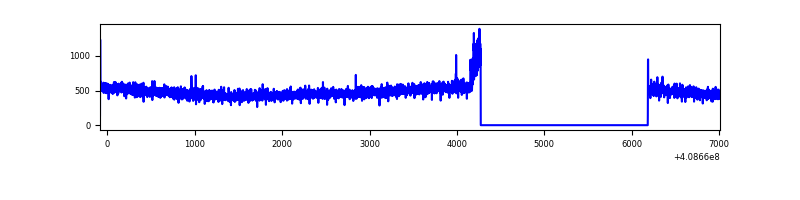 |
| D | 7096 | 5184 | 343 | 343 | 4.83% | 6.62% | 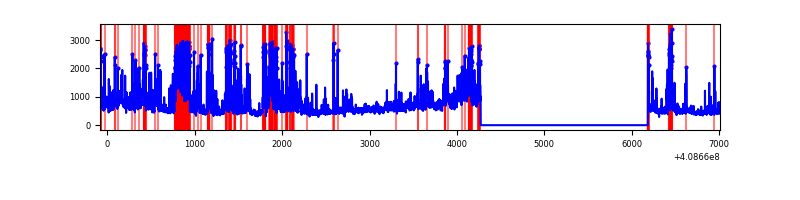 |
Top three noisy pixels from each quadrant. If the there are fewer than three noisy pixels in the level2.evt file, extra rows are filled as -1
| Pixel properties | Quadrant properties | ||||||
|---|---|---|---|---|---|---|---|
| Quadrant | DetID | PixID | Counts | Sigma | Mean | Median | Sigma |
| A | 10 | 83 | 394520 | 3369.81 | 578 | 566 | 116.9 |
| A | 15 | 222 | 39569 | 333.62 | 578 | 566 | 116.9 |
| A | 15 | 223 | 11766 | 95.8 | 578 | 566 | 116.9 |
| B | 5 | 172 | 45387 | 402.16 | 577 | 562 | 111.5 |
| B | 0 | 230 | 15735 | 136.13 | 577 | 562 | 111.5 |
| B | 12 | 111 | 13944 | 120.06 | 577 | 562 | 111.5 |
| C | 15 | 214 | 221363 | 1666.83 | 567 | 573 | 132.5 |
| C | 1 | 128 | 45102 | 336.17 | 567 | 573 | 132.5 |
| C | 14 | 67 | 7155 | 49.69 | 567 | 573 | 132.5 |
| D | 12 | 235 | 1539087 | 11341.03 | 553 | 538 | 135.7 |
| D | 12 | 227 | 540974 | 3983.69 | 553 | 538 | 135.7 |
| D | 2 | 249 | 46990 | 342.41 | 553 | 538 | 135.7 |
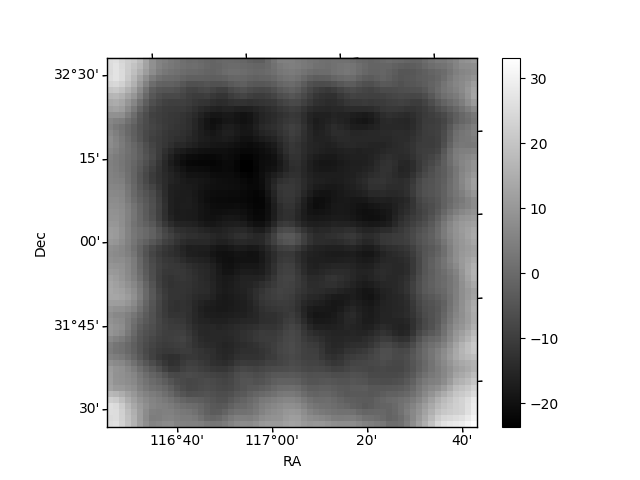
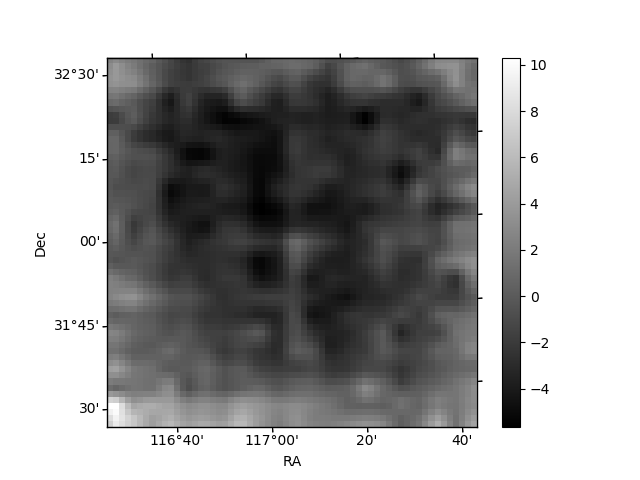
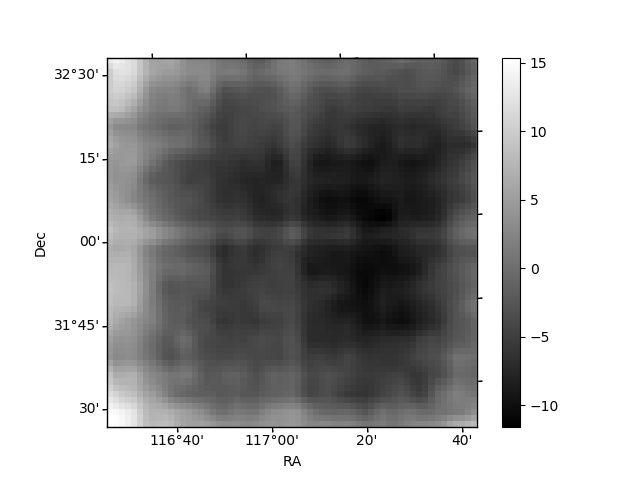
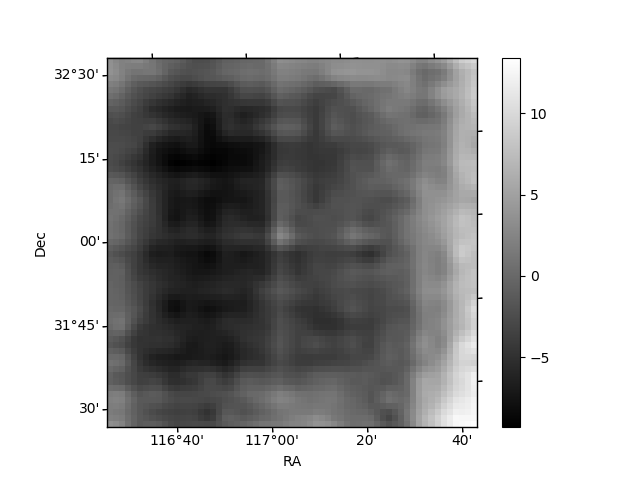
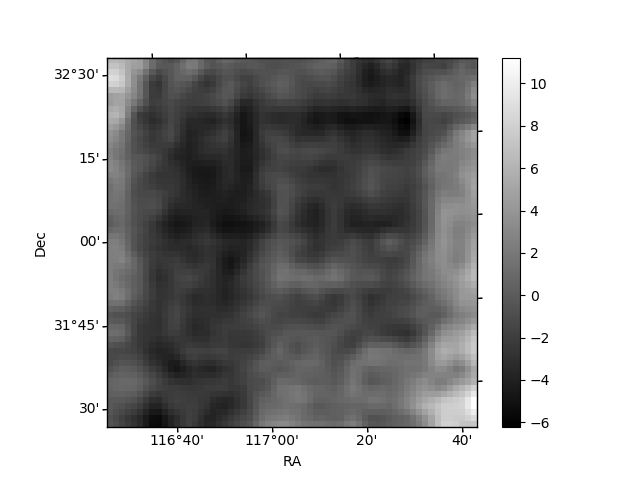
Histogram calculated using DETX and DETY for each event in the final _common_clean file
| Quadrant A | 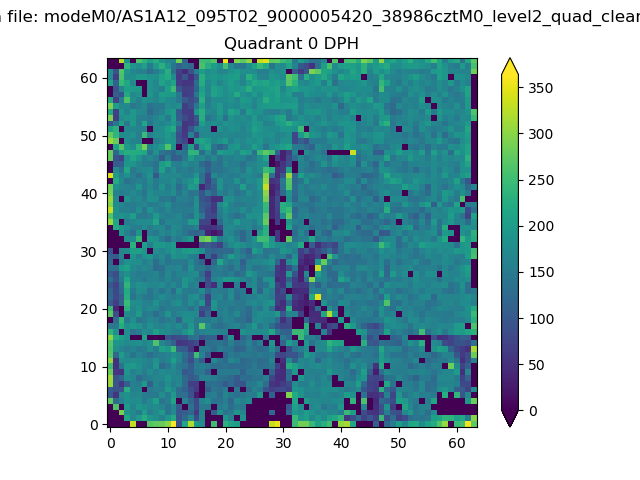 |
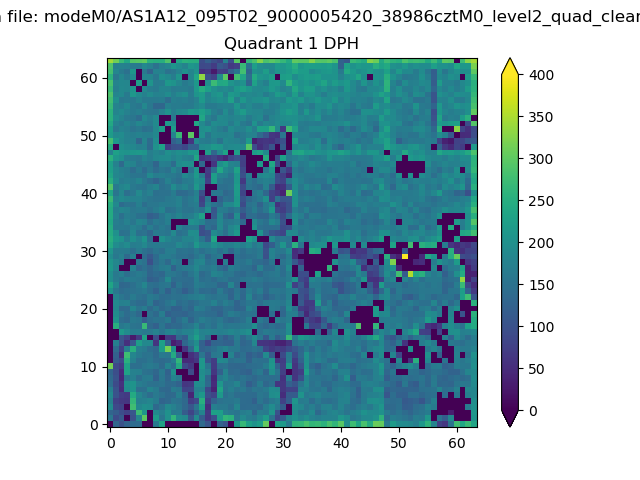 |
Quadrant B |
|---|---|---|---|
| Quadrant D | 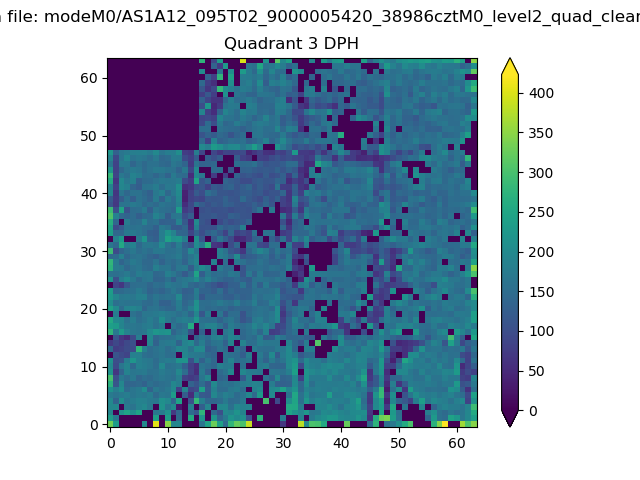 |
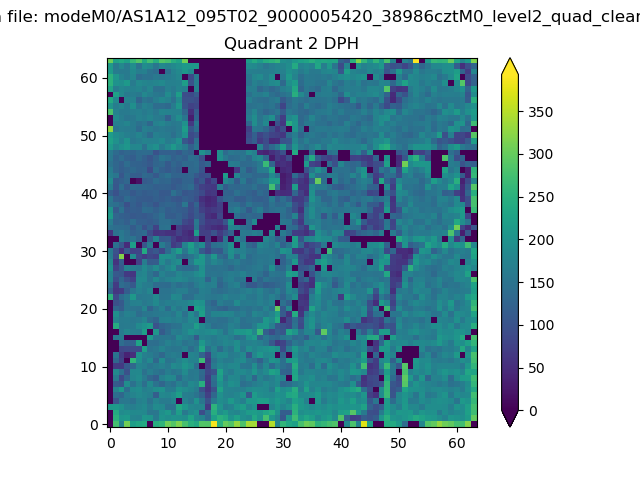 |
Quadrant C |
| Plot type | Count rate plots | Images |
|---|---|---|
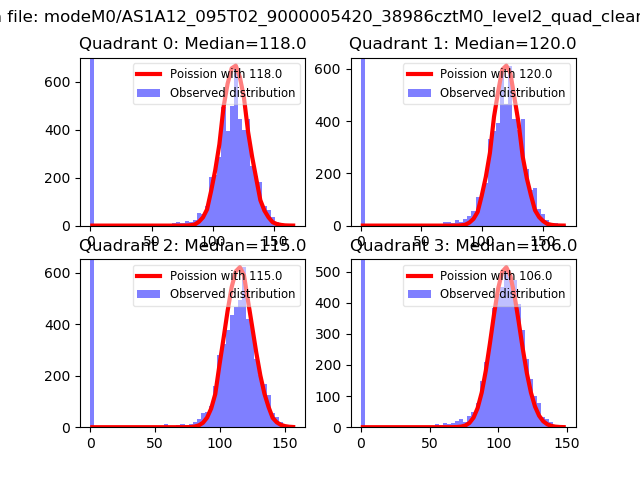
| Comparison with Poisson distribution Blue bars denote a histogram of data divided into 1 sec bins. Red curve is a Poisson curve with rate = median count rate of data. |
 |
 |
| Quadrant-wise count rates Data is divided into 100 sec bins |
 |
|
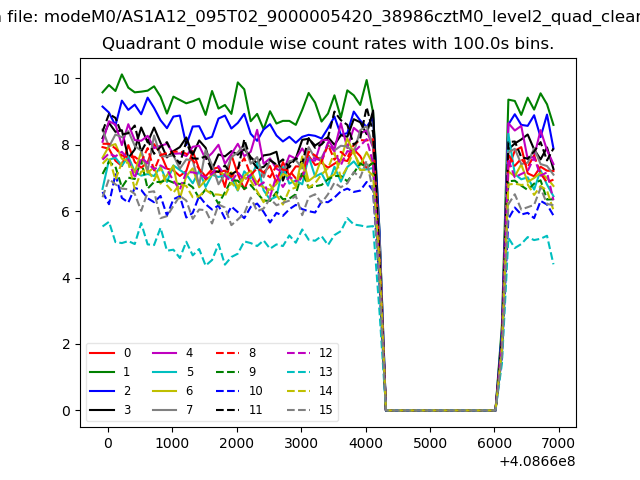
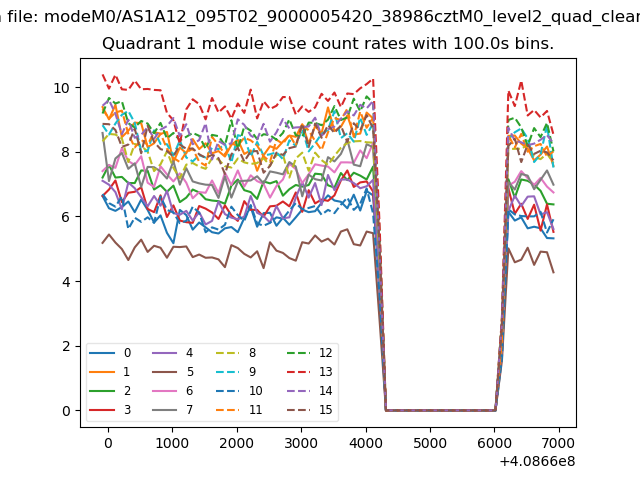
| Module-wise count rates for Quadrant A Data is divided into 100 sec bins |
 |
 |
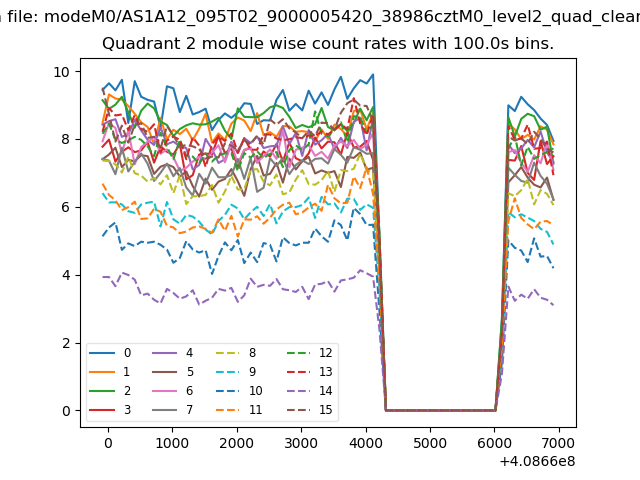
| Module-wise count rates for Quadrant B Data is divided into 100 sec bins |
 |
 |
| Module-wise count rates for Quadrant C Data is divided into 100 sec bins |
 |
 |
| Module-wise count rates for Quadrant D Data is divided into 100 sec bins |
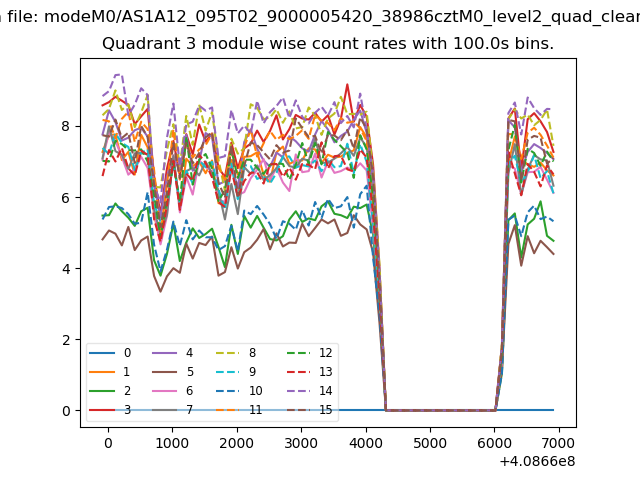 |
 |
| Parameter | Plot |
|---|---|
| CZT HV Monitor | 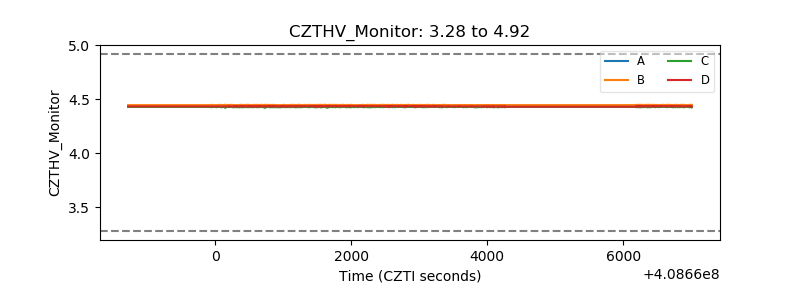 |
| D_VDD | 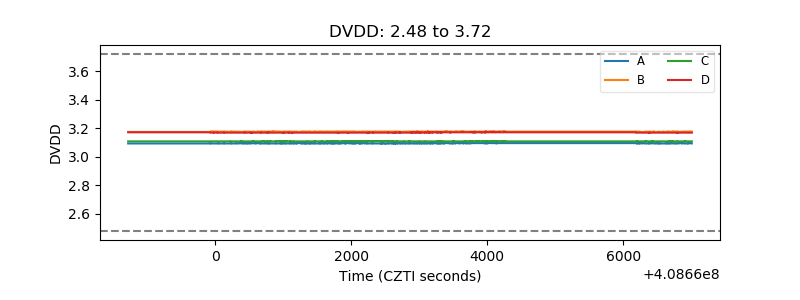 |
| Temperature 1 | 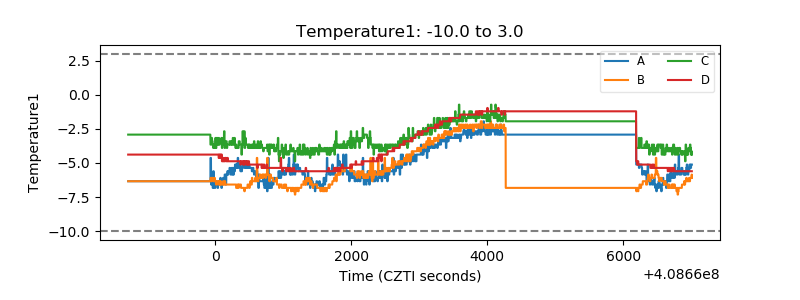 |
| Veto HV Monitor | 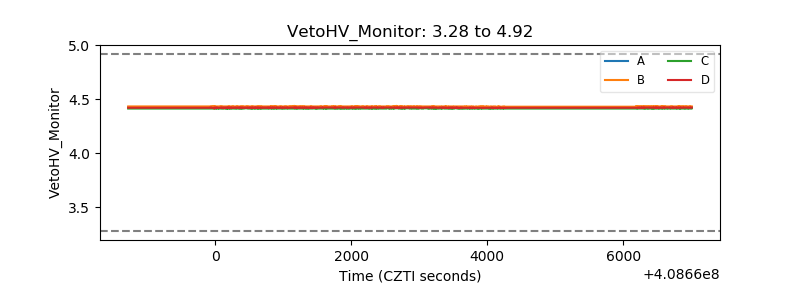 |
| Veto LLD | 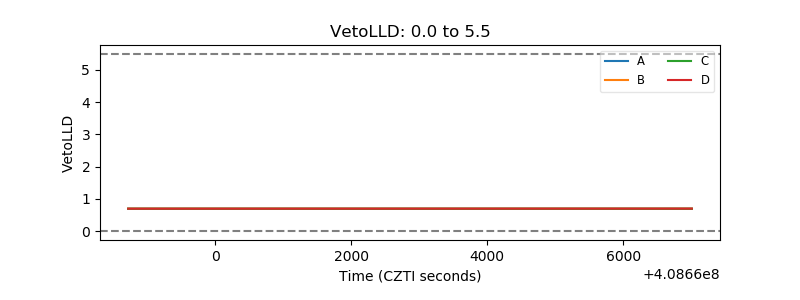 |
| Alpha Counter | 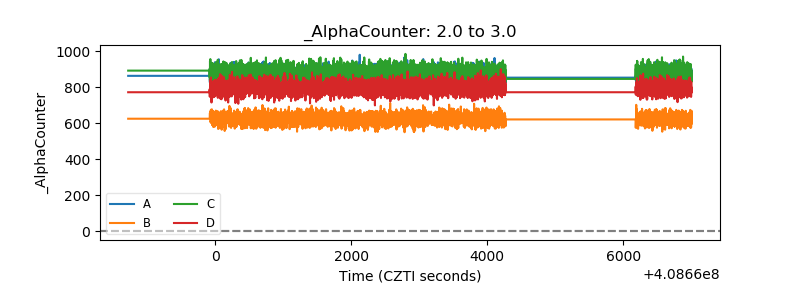 |
| _CPM_Rate | 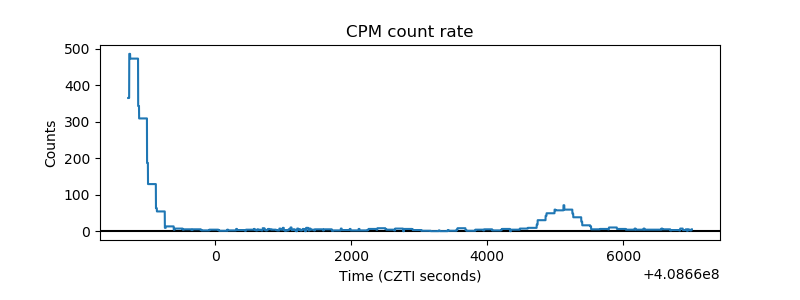 |
| CZT Counter | 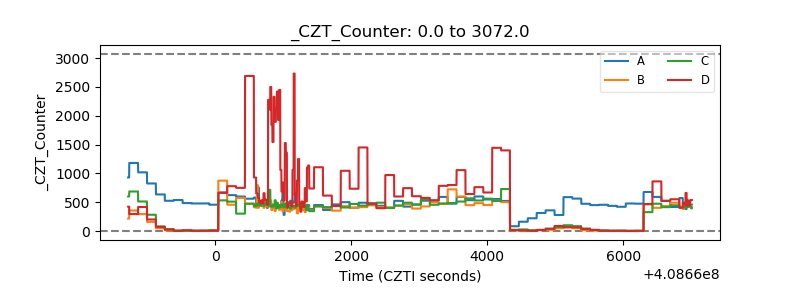 |
| +2.5 Volts monitor | 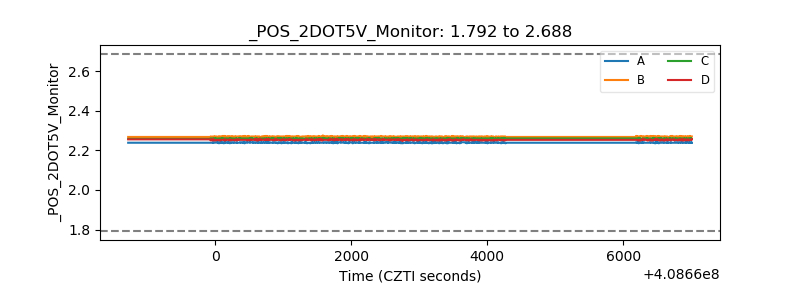 |
| +5 Volts monitor | 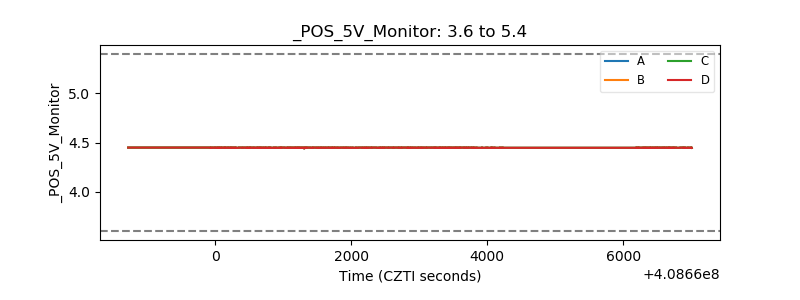 |
| _ROLL_ROT | 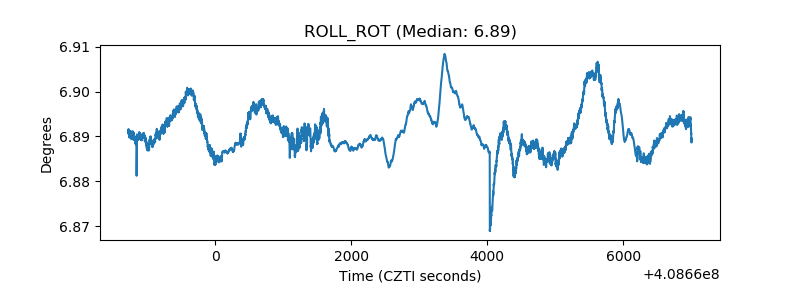 |
| _Roll_DEC | 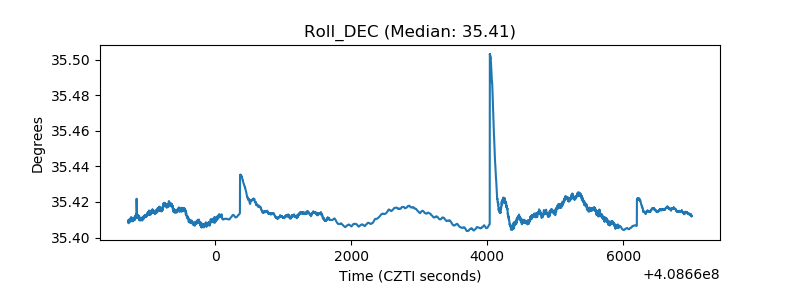 |
| _Roll_RA | 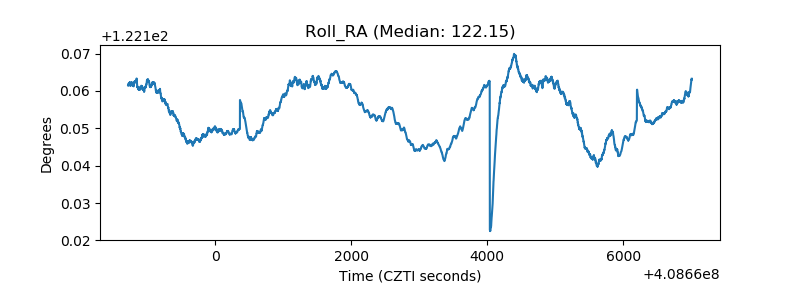 |
| Veto Counter | 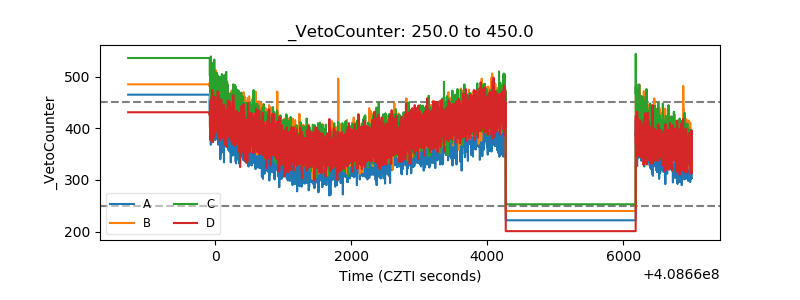 |