| Param | Original file | Final file |
|---|---|---|
| Filename | modeM0/AS1A12_095T02_9000005420_38989cztM0_level2.fits | modeM0/AS1A12_095T02_9000005420_38989cztM0_level2_quad_clean.evt |
| Size (bytes) | 429,765,120 | 111,617,280 |
| Size | 409.9 MB | 106.4 MB |
| Events in quadrant A | 3,587,412 | 763,121 |
| Events in quadrant B | 3,214,338 | 776,641 |
| Events in quadrant C | 3,215,726 | 742,724 |
| Events in quadrant D | 5,364,560 | 625,155 |
| Mode M0 | |||
|---|---|---|---|
| Quadrant | BADHDUFLAG | Total packets | Discarded packets |
| A | 0 | 14569 | 3 |
| B | 0 | 14035 | 5 |
| C | 0 | 13702 | 5 |
| D | 0 | 20739 | 2 |
| Mode SS | |||
|---|---|---|---|
| Quadrant | BADHDUFLAG | Total packets | Discarded packets |
| A | 0 | 140 | 0 |
| B | 0 | 140 | 0 |
| C | 0 | 140 | 0 |
| D | 0 | 140 | 0 |
| Mode M9 | |||
|---|---|---|---|
| Quadrant | BADHDUFLAG | Total packets | Discarded packets |
| A | 0 | 26 | 0 |
| B | 0 | 26 | 0 |
| C | 0 | 26 | 0 |
| D | 0 | 26 | 0 |
| Quadrant | Total seconds | Saturated seconds | Saturation percentage |
|---|---|---|---|
| A | 6769 | 39 | 0.576156% |
| B | 6767 | 29 | 0.428550% |
| C | 6767 | 7 | 0.103443% |
| D | 6769 | 745 | 11.006057% |
Noise dominated data is calculated using 1-second bins in cleaned event files. If a bin has >2000 counts, and if more than 50% of those come from <1% of pixels, then it is considered to be noise-dominated and hence unusable.
| Quadrant | # 1 sec bins | Bins with >0 counts | Bins with >2000 counts | High rate bins dominated by noise | Noise dominated (total time) | Noise dominated (detector-on time) | Marked lightcurve |
|---|---|---|---|---|---|---|---|
| A | 9393 | 6771 | 34 | 34 | 0.36% | 0.50% | 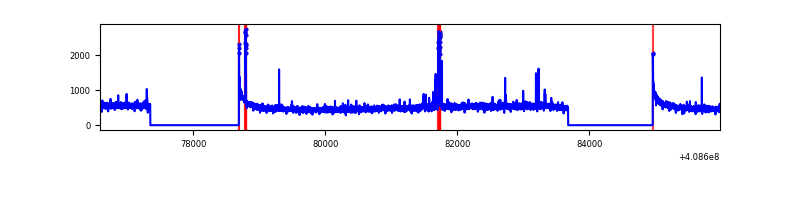 |
| B | 9393 | 6770 | 12 | 12 | 0.13% | 0.18% | 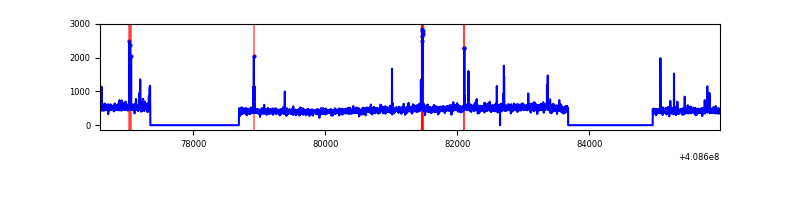 |
| C | 9393 | 6770 | 0 | 0 | 0.00% | 0.00% | 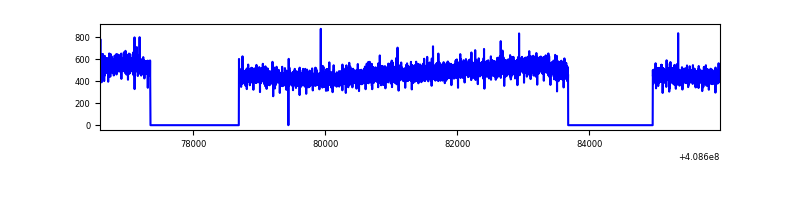 |
| D | 9393 | 6771 | 731 | 731 | 7.78% | 10.80% | 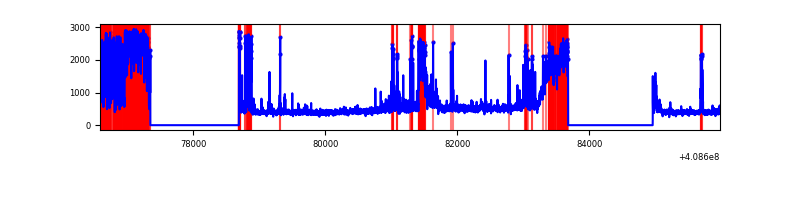 |
Top three noisy pixels from each quadrant. If the there are fewer than three noisy pixels in the level2.evt file, extra rows are filled as -1
| Pixel properties | Quadrant properties | ||||||
|---|---|---|---|---|---|---|---|
| Quadrant | DetID | PixID | Counts | Sigma | Mean | Median | Sigma |
| A | 10 | 83 | 478700 | 3050.11 | 772 | 757 | 156.7 |
| A | 13 | 248 | 75467 | 476.78 | 772 | 757 | 156.7 |
| A | 15 | 223 | 28552 | 177.38 | 772 | 757 | 156.7 |
| B | 5 | 172 | 120881 | 805.42 | 766 | 744 | 149.2 |
| B | 0 | 230 | 43312 | 285.38 | 766 | 744 | 149.2 |
| B | 0 | 197 | 19885 | 128.32 | 766 | 744 | 149.2 |
| C | 15 | 214 | 278053 | 1570.37 | 753 | 757 | 176.6 |
| C | 13 | 61 | 4993 | 23.99 | 753 | 757 | 176.6 |
| C | 4 | 0 | 2142 | 7.84 | 753 | 757 | 176.6 |
| D | 12 | 235 | 1618442 | 9174.85 | 720 | 698 | 176.3 |
| D | 2 | 153 | 808409 | 4580.84 | 720 | 698 | 176.3 |
| D | 13 | 249 | 53133 | 297.38 | 720 | 698 | 176.3 |
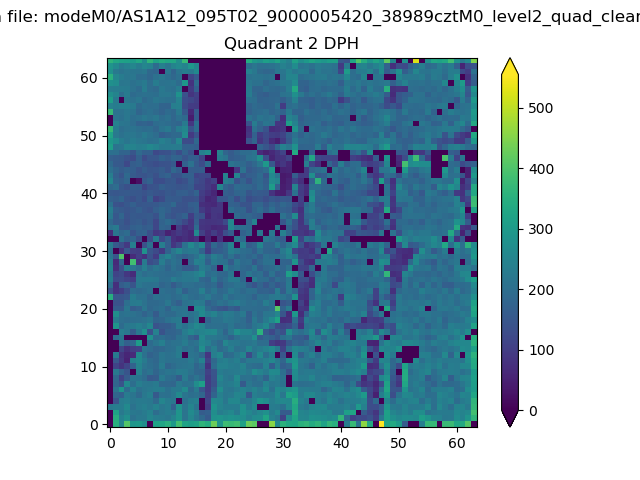
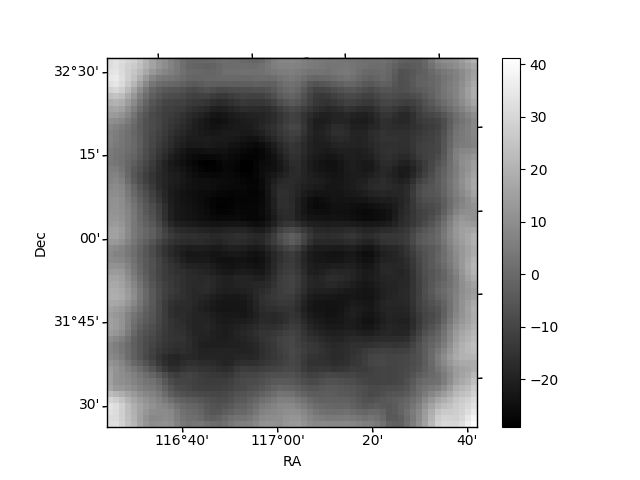
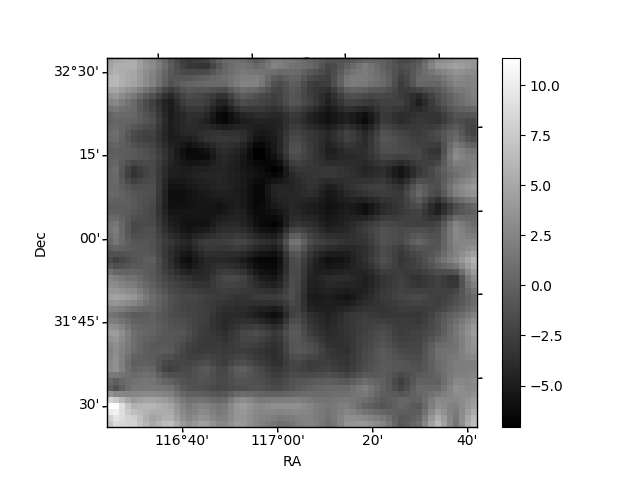
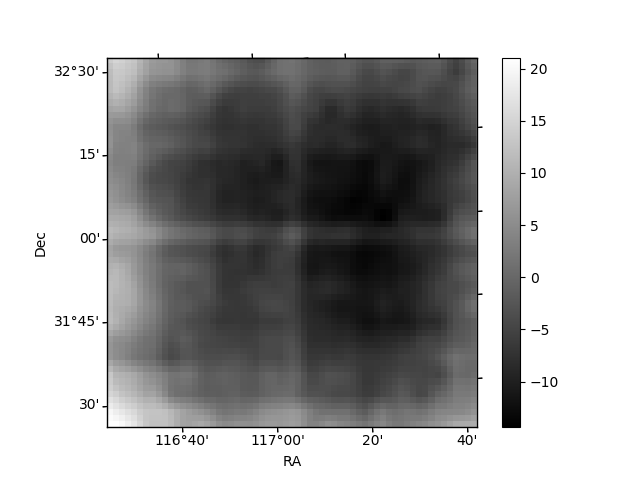
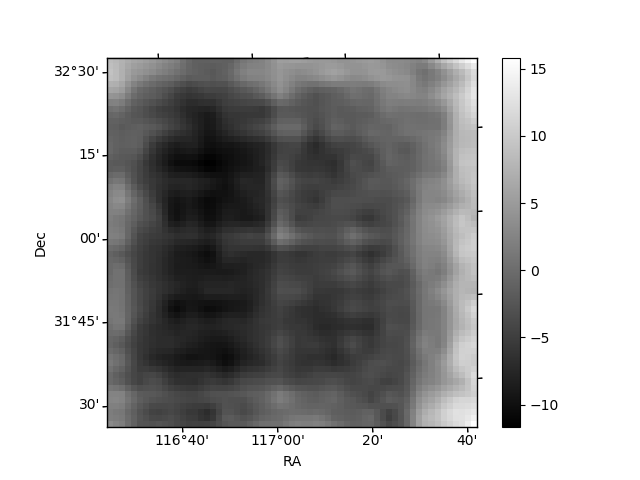
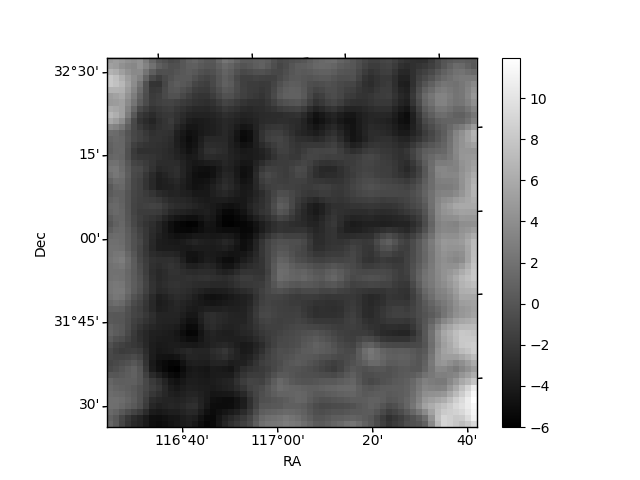
Histogram calculated using DETX and DETY for each event in the final _common_clean file
| Quadrant A | 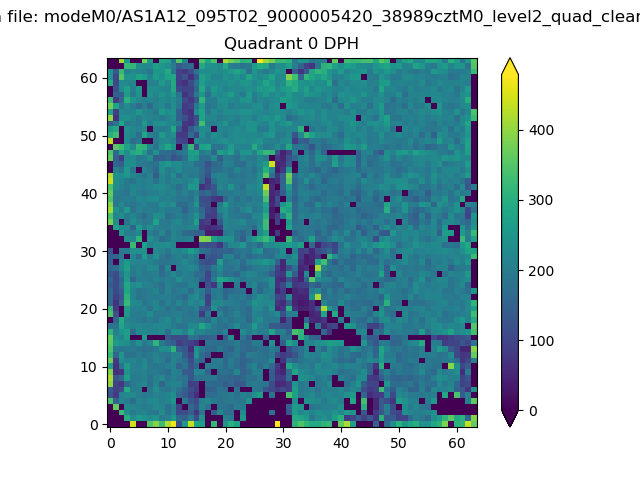 |
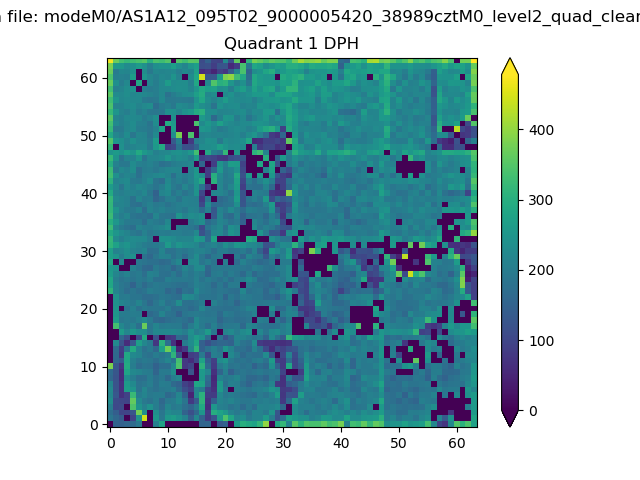 |
Quadrant B |
|---|---|---|---|
| Quadrant D | 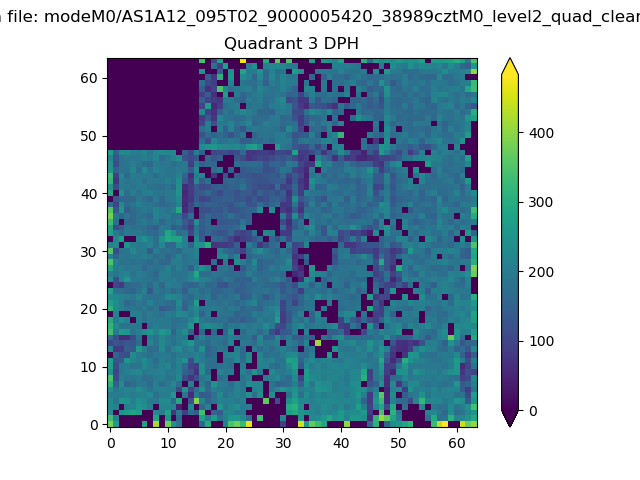 |
 |
Quadrant C |
| Plot type | Count rate plots | Images |
|---|---|---|
| Comparison with Poisson distribution Blue bars denote a histogram of data divided into 1 sec bins. Red curve is a Poisson curve with rate = median count rate of data. |
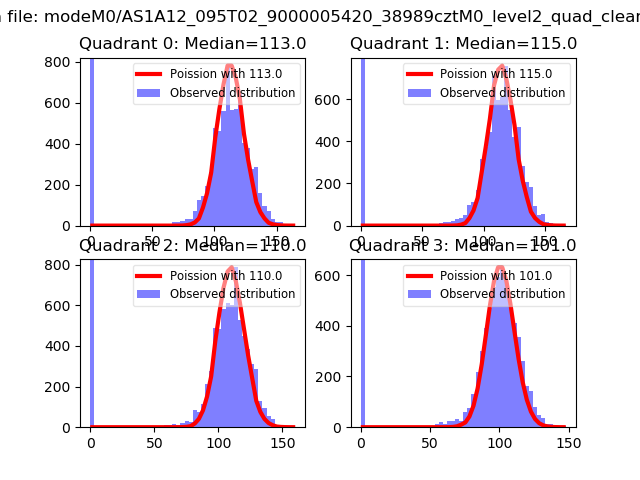 |
 |
| Quadrant-wise count rates Data is divided into 100 sec bins |
 |
|
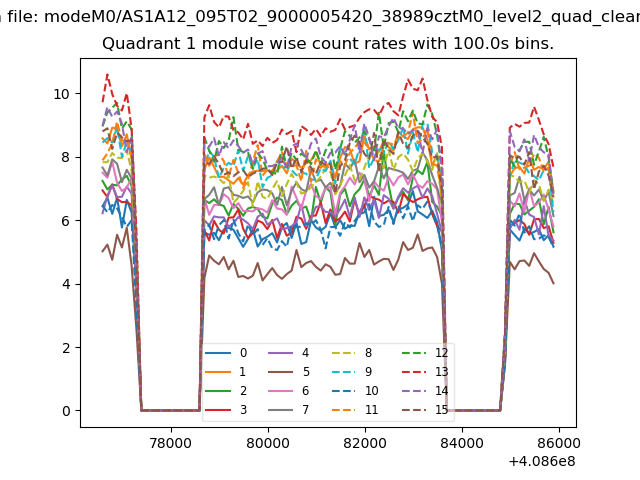
| Module-wise count rates for Quadrant A Data is divided into 100 sec bins |
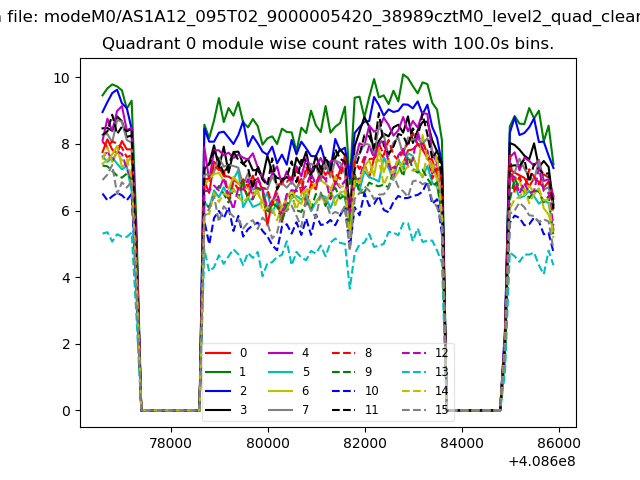 |
 |
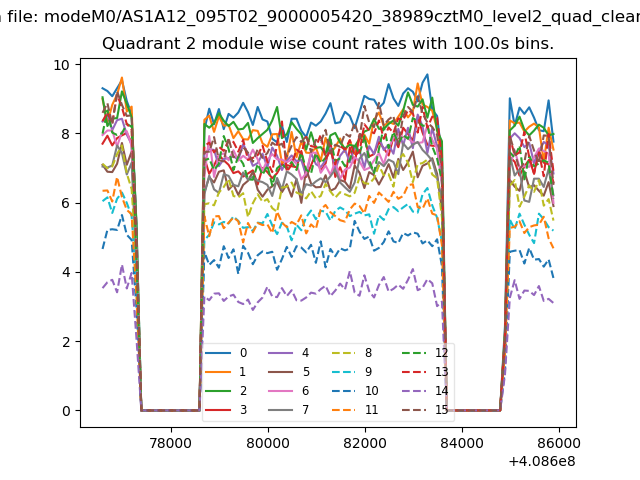
| Module-wise count rates for Quadrant B Data is divided into 100 sec bins |
 |
 |
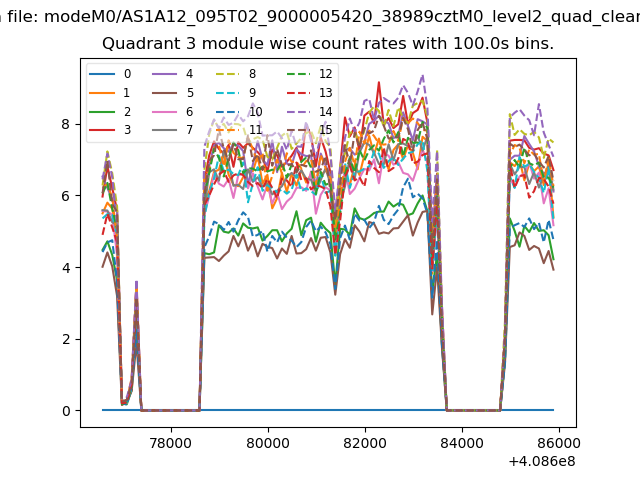
| Module-wise count rates for Quadrant C Data is divided into 100 sec bins |
 |
 |
| Module-wise count rates for Quadrant D Data is divided into 100 sec bins |
 |
 |
| Parameter | Plot |
|---|---|
| CZT HV Monitor | 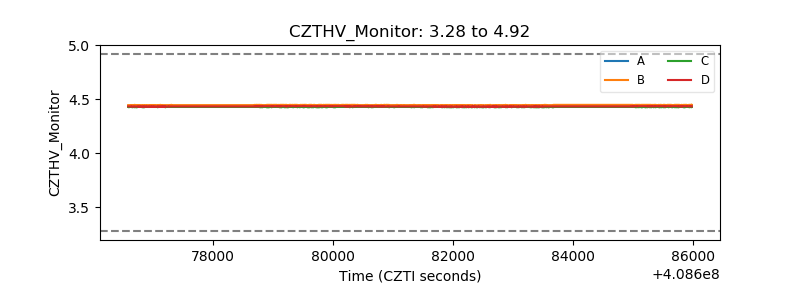 |
| D_VDD | 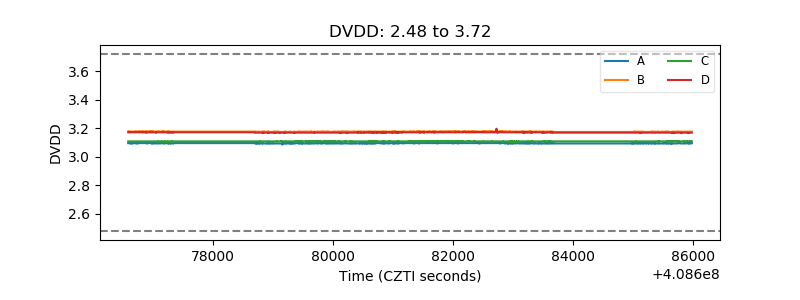 |
| Temperature 1 | 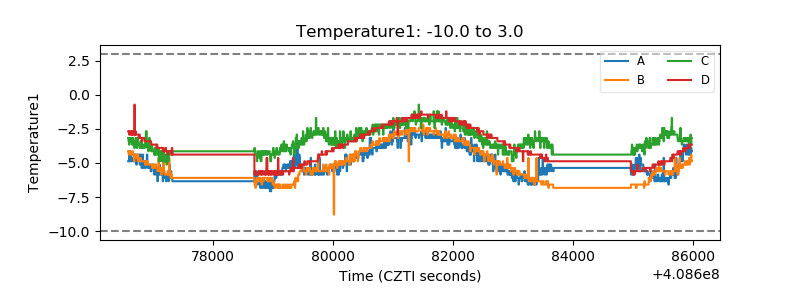 |
| Veto HV Monitor | 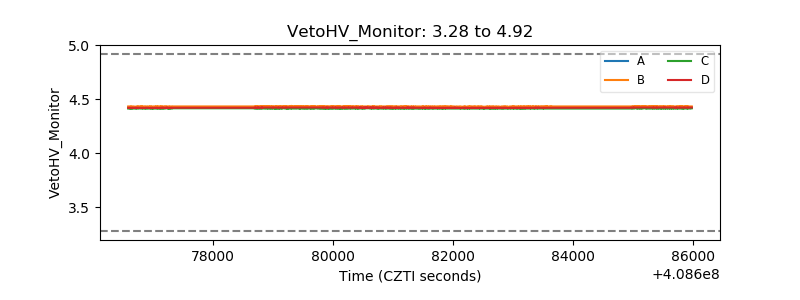 |
| Veto LLD | 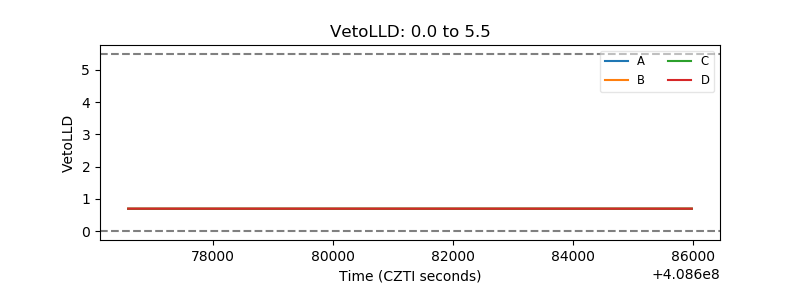 |
| Alpha Counter | 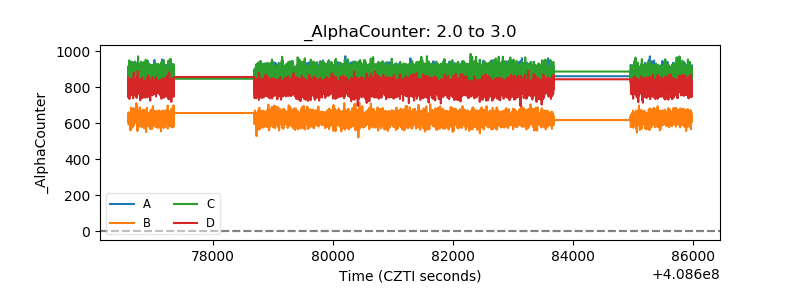 |
| _CPM_Rate | 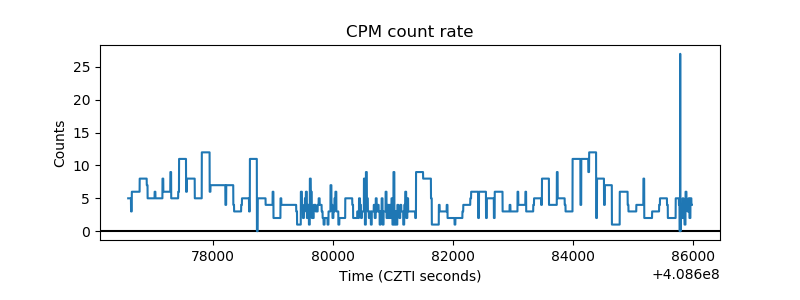 |
| CZT Counter | 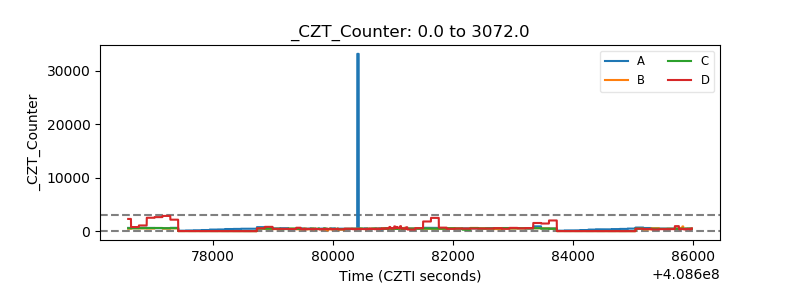 |
| +2.5 Volts monitor | 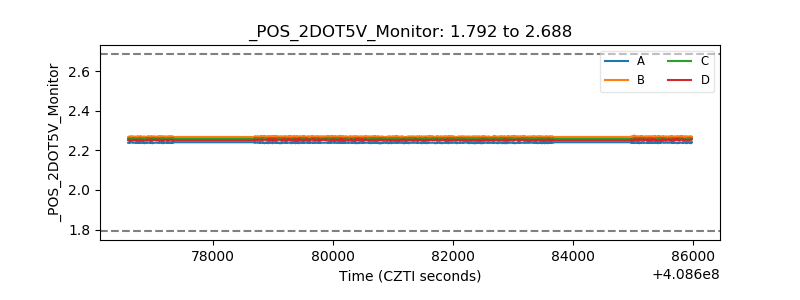 |
| +5 Volts monitor | 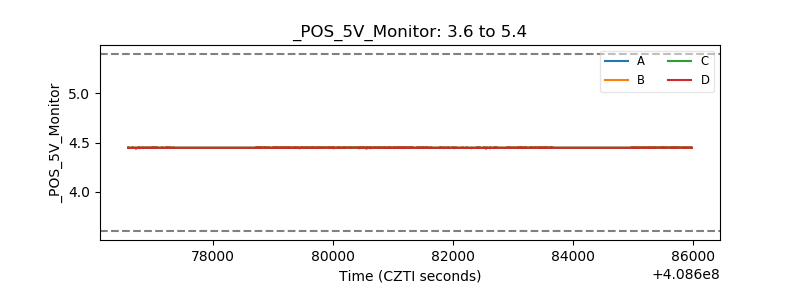 |
| _ROLL_ROT | 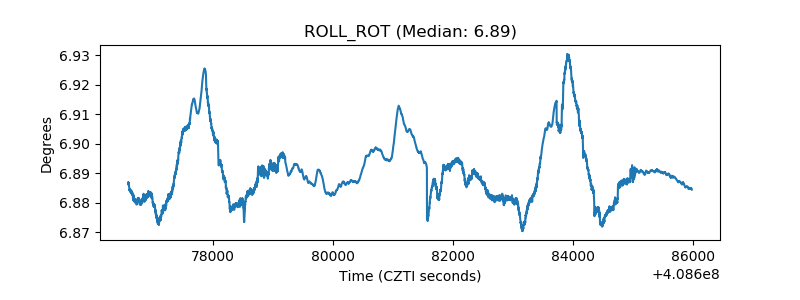 |
| _Roll_DEC | 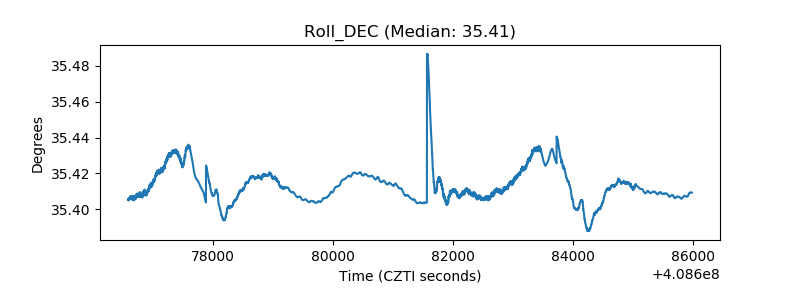 |
| _Roll_RA | 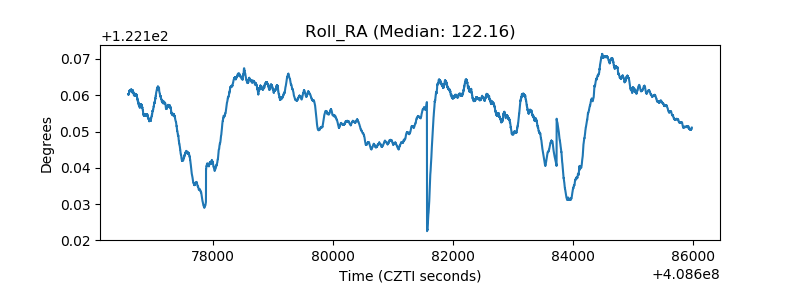 |
| Veto Counter | 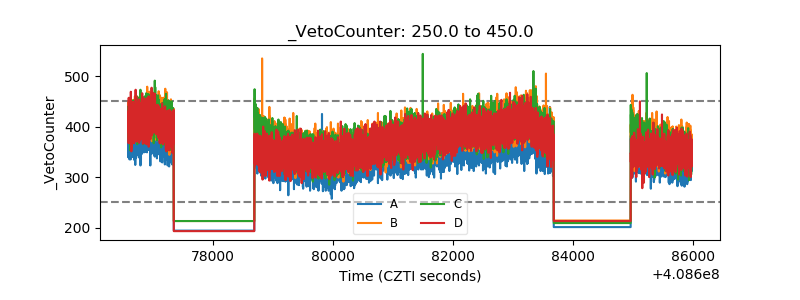 |