| Param | Original file | Final file |
|---|---|---|
| Filename | modeM0/AS1A12_095T02_9000005420_38991cztM0_level2.fits | modeM0/AS1A12_095T02_9000005420_38991cztM0_level2_quad_clean.evt |
| Size (bytes) | 631,883,520 | 163,321,920 |
| Size | 602.6 MB | 155.8 MB |
| Events in quadrant A | 5,461,630 | 1,090,968 |
| Events in quadrant B | 4,840,345 | 1,124,297 |
| Events in quadrant C | 4,715,849 | 1,072,503 |
| Events in quadrant D | 7,605,888 | 972,135 |
| Mode M0 | |||
|---|---|---|---|
| Quadrant | BADHDUFLAG | Total packets | Discarded packets |
| A | 0 | 21850 | 3 |
| B | 0 | 20902 | 2 |
| C | 0 | 19928 | 2 |
| D | 0 | 29476 | 2 |
| Mode SS | |||
|---|---|---|---|
| Quadrant | BADHDUFLAG | Total packets | Discarded packets |
| A | 0 | 202 | 0 |
| B | 0 | 202 | 0 |
| C | 0 | 202 | 0 |
| D | 0 | 202 | 0 |
| Mode M9 | |||
|---|---|---|---|
| Quadrant | BADHDUFLAG | Total packets | Discarded packets |
| A | 0 | 27 | 0 |
| B | 0 | 27 | 0 |
| C | 0 | 27 | 0 |
| D | 0 | 27 | 0 |
| Quadrant | Total seconds | Saturated seconds | Saturation percentage |
|---|---|---|---|
| A | 9884 | 153 | 1.547956% |
| B | 9884 | 87 | 0.880210% |
| C | 9884 | 14 | 0.141643% |
| D | 9884 | 301 | 3.045326% |
Noise dominated data is calculated using 1-second bins in cleaned event files. If a bin has >2000 counts, and if more than 50% of those come from <1% of pixels, then it is considered to be noise-dominated and hence unusable.
| Quadrant | # 1 sec bins | Bins with >0 counts | Bins with >2000 counts | High rate bins dominated by noise | Noise dominated (total time) | Noise dominated (detector-on time) | Marked lightcurve |
|---|---|---|---|---|---|---|---|
| A | 12509 | 9886 | 137 | 137 | 1.10% | 1.39% | 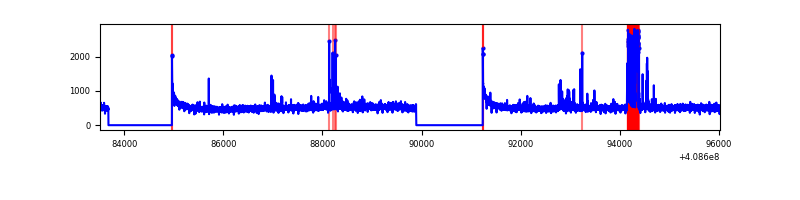 |
| B | 12509 | 9886 | 54 | 54 | 0.43% | 0.55% | 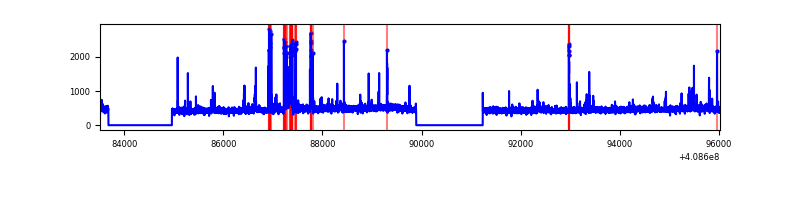 |
| C | 12509 | 9886 | 1 | 1 | 0.01% | 0.01% | 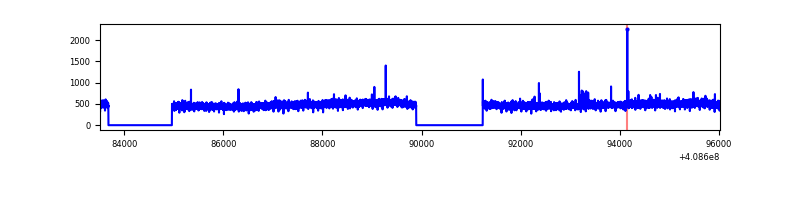 |
| D | 12509 | 9886 | 296 | 296 | 2.37% | 2.99% | 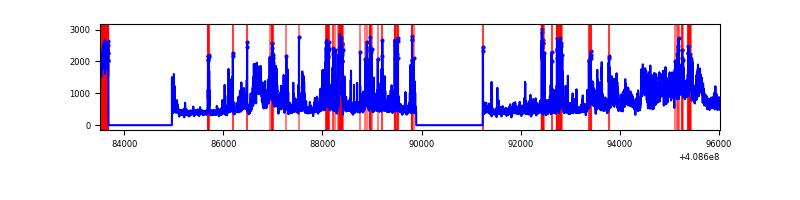 |
Top three noisy pixels from each quadrant. If the there are fewer than three noisy pixels in the level2.evt file, extra rows are filled as -1
| Pixel properties | Quadrant properties | ||||||
|---|---|---|---|---|---|---|---|
| Quadrant | DetID | PixID | Counts | Sigma | Mean | Median | Sigma |
| A | 10 | 83 | 636375 | 2829.7 | 1117 | 1093 | 224.5 |
| A | 13 | 248 | 452680 | 2011.48 | 1117 | 1093 | 224.5 |
| A | 6 | 10 | 32542 | 140.08 | 1117 | 1093 | 224.5 |
| B | 5 | 172 | 282274 | 1300.11 | 1116 | 1082 | 216.3 |
| B | 0 | 199 | 75422 | 343.72 | 1116 | 1082 | 216.3 |
| B | 15 | 85 | 45745 | 206.5 | 1116 | 1082 | 216.3 |
| C | 15 | 214 | 400520 | 1555.07 | 1099 | 1105 | 256.8 |
| C | 15 | 208 | 15237 | 55.02 | 1099 | 1105 | 256.8 |
| C | 13 | 61 | 7558 | 25.12 | 1099 | 1105 | 256.8 |
| D | 2 | 153 | 1964575 | 7402.07 | 1088 | 1056 | 265.3 |
| D | 12 | 235 | 961529 | 3620.79 | 1088 | 1056 | 265.3 |
| D | 13 | 249 | 204976 | 768.74 | 1088 | 1056 | 265.3 |
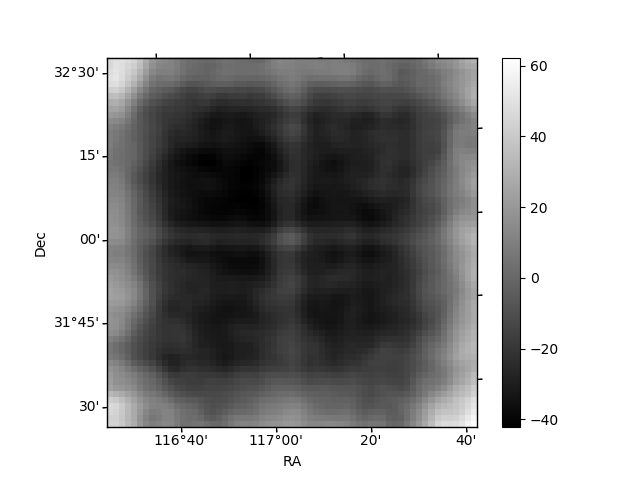
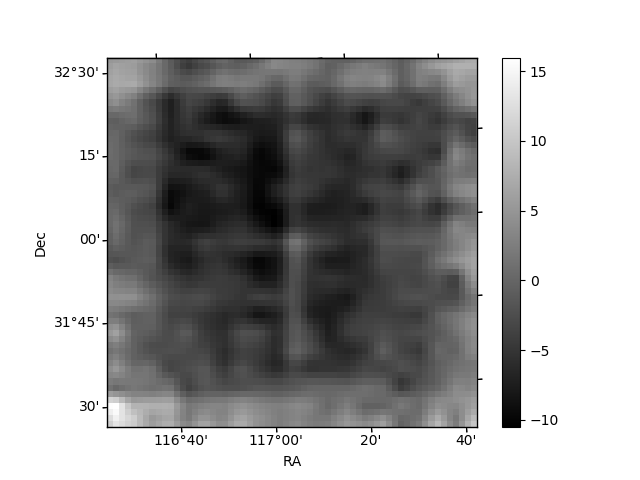
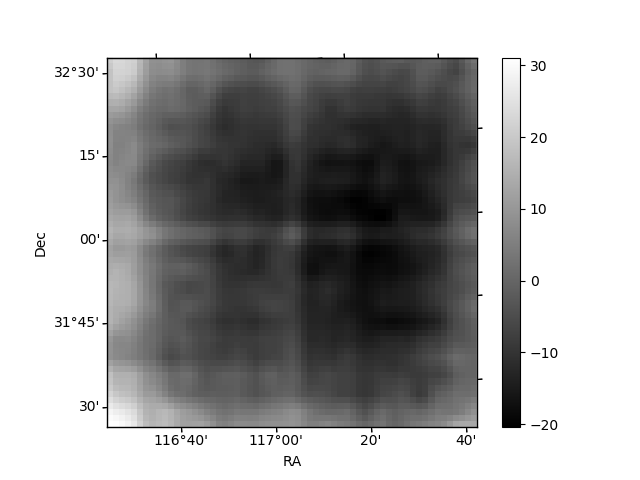
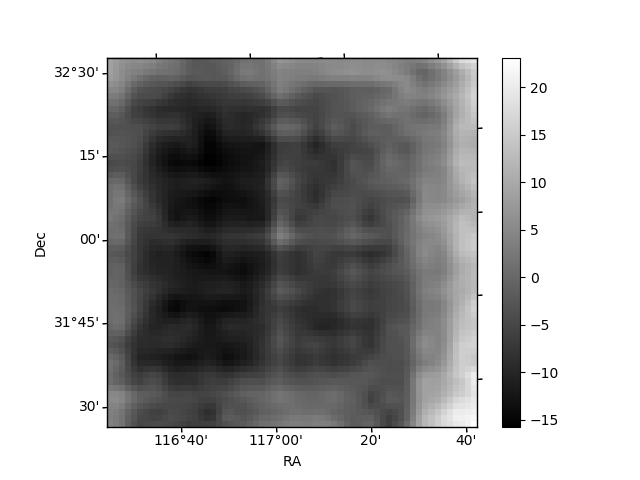
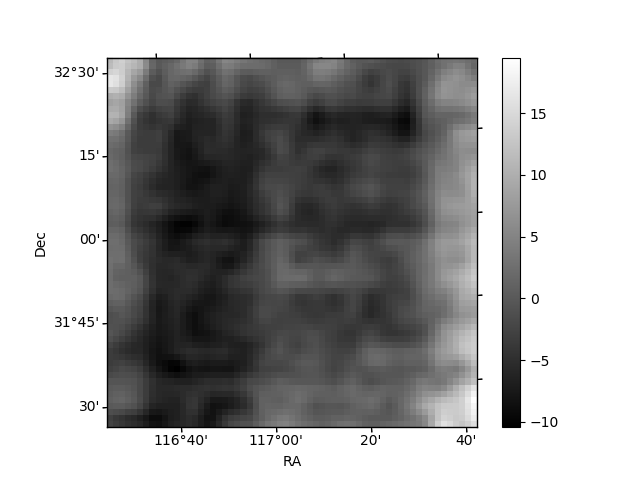
Histogram calculated using DETX and DETY for each event in the final _common_clean file
| Quadrant A | 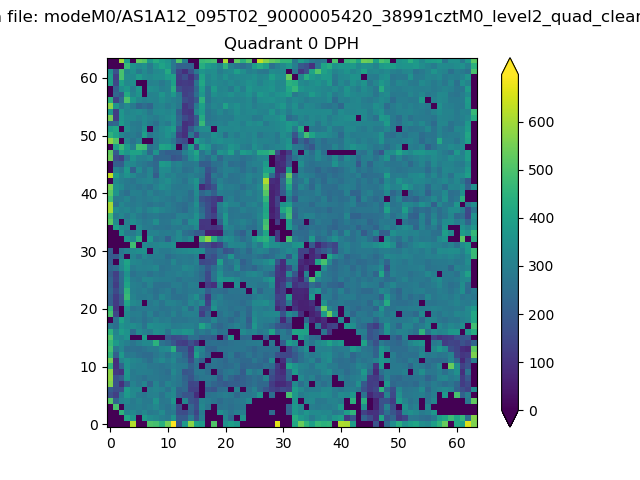 |
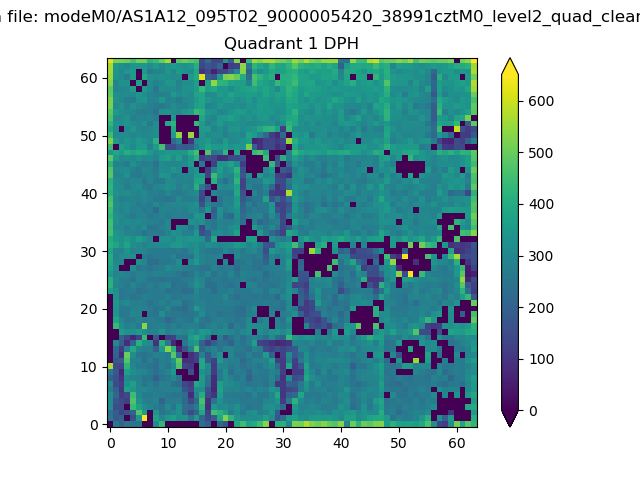 |
Quadrant B |
|---|---|---|---|
| Quadrant D | 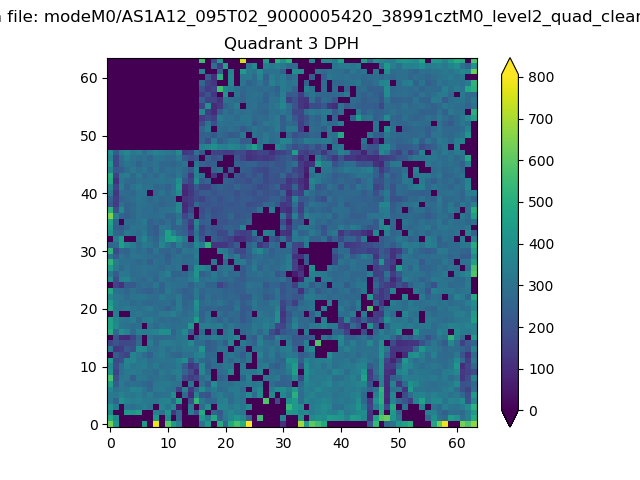 |
 |
Quadrant C |
| Plot type | Count rate plots | Images |
|---|---|---|
| Comparison with Poisson distribution Blue bars denote a histogram of data divided into 1 sec bins. Red curve is a Poisson curve with rate = median count rate of data. |
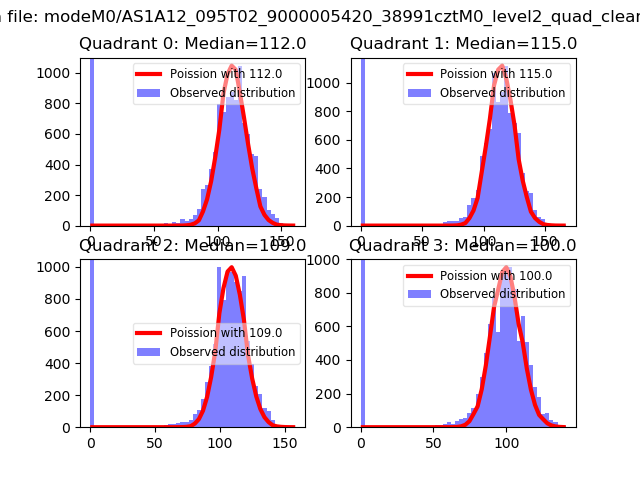 |
 |
| Quadrant-wise count rates Data is divided into 100 sec bins |
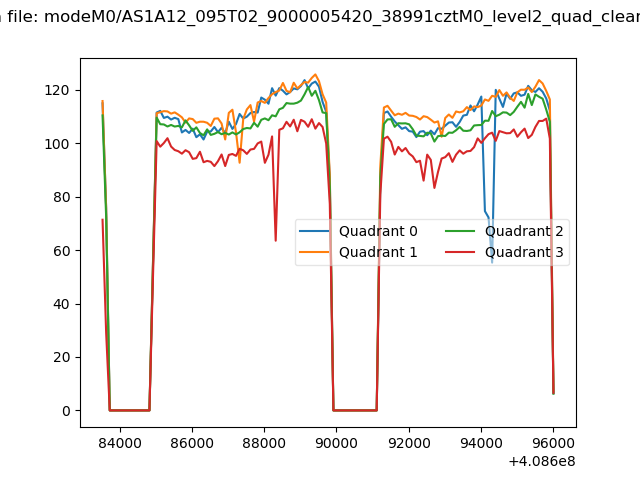 |
|
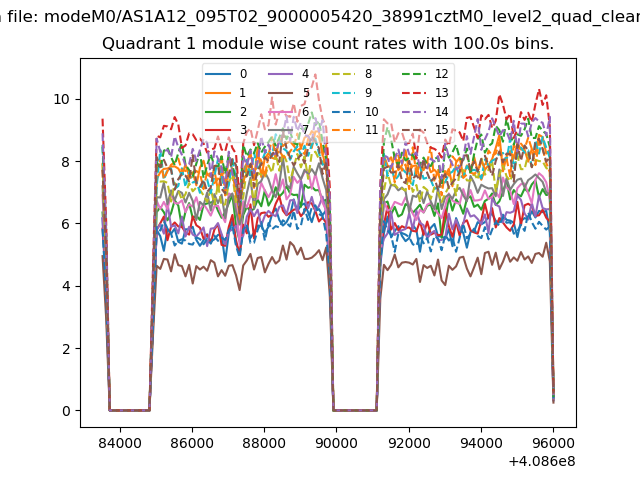
| Module-wise count rates for Quadrant A Data is divided into 100 sec bins |
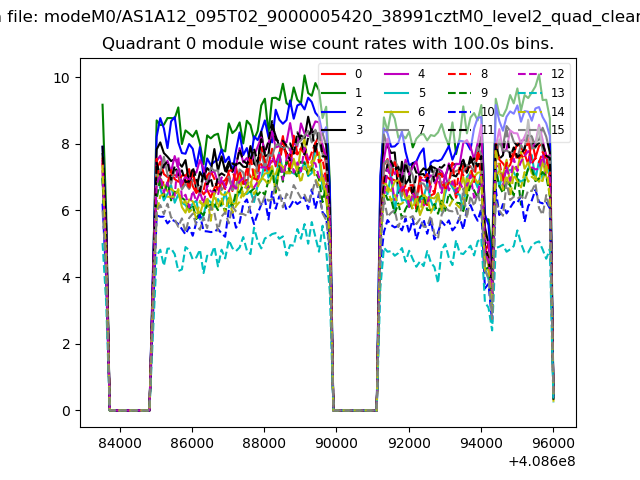 |
 |
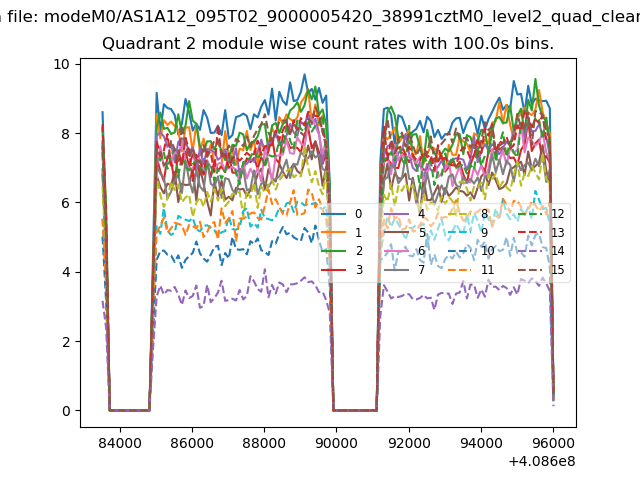
| Module-wise count rates for Quadrant B Data is divided into 100 sec bins |
 |
 |
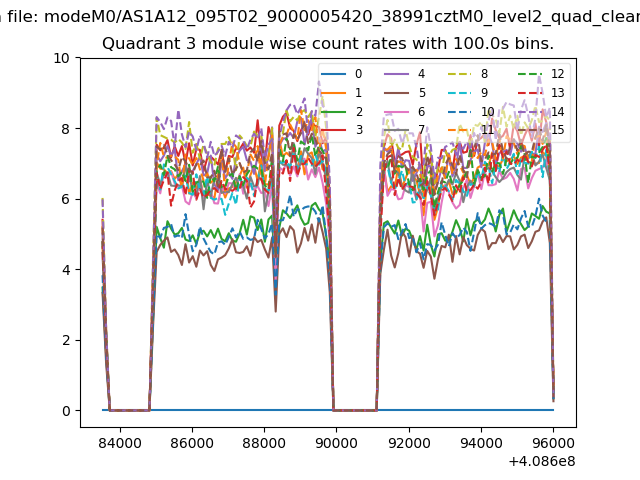
| Module-wise count rates for Quadrant C Data is divided into 100 sec bins |
 |
 |
| Module-wise count rates for Quadrant D Data is divided into 100 sec bins |
 |
 |
| Parameter | Plot |
|---|---|
| CZT HV Monitor | 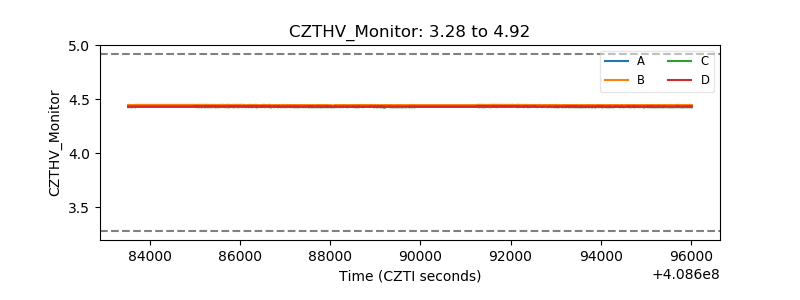 |
| D_VDD | 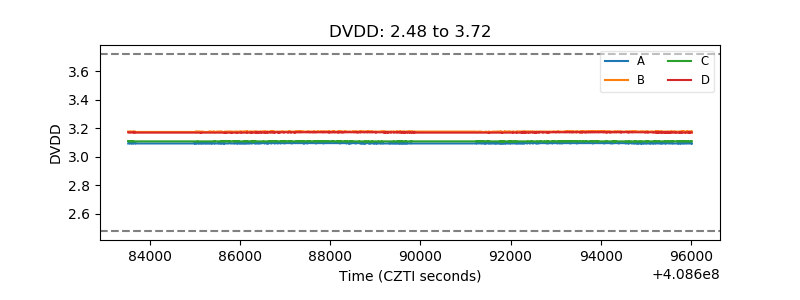 |
| Temperature 1 | 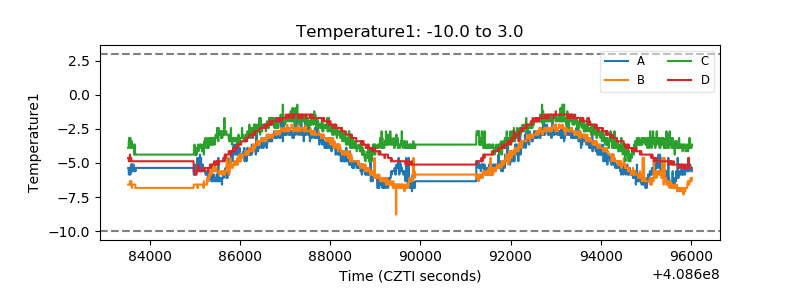 |
| Veto HV Monitor | 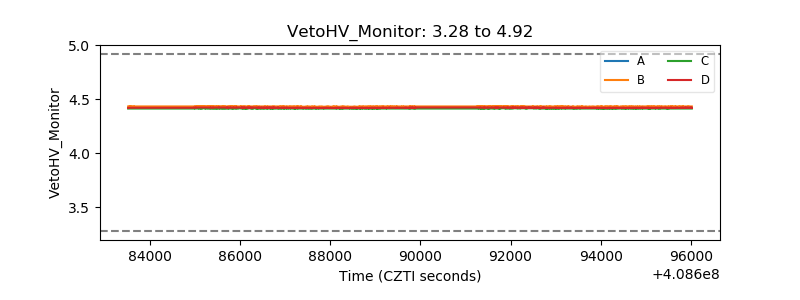 |
| Veto LLD | 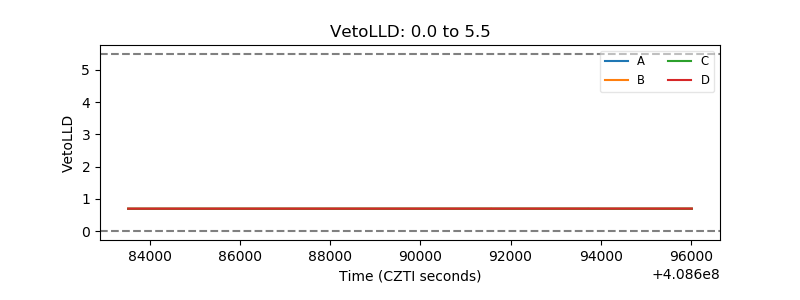 |
| Alpha Counter | 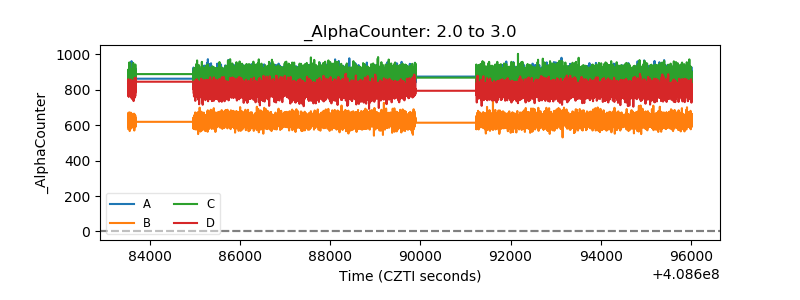 |
| _CPM_Rate | 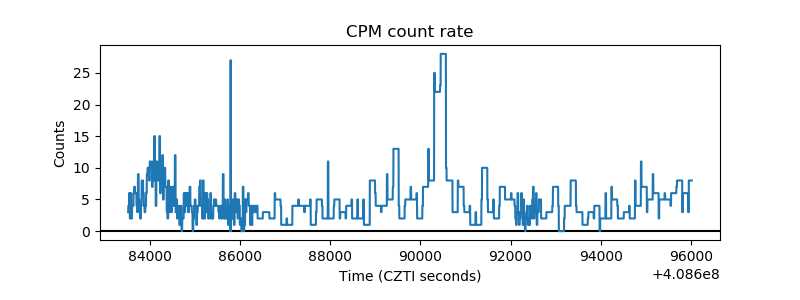 |
| CZT Counter |  |
| +2.5 Volts monitor | 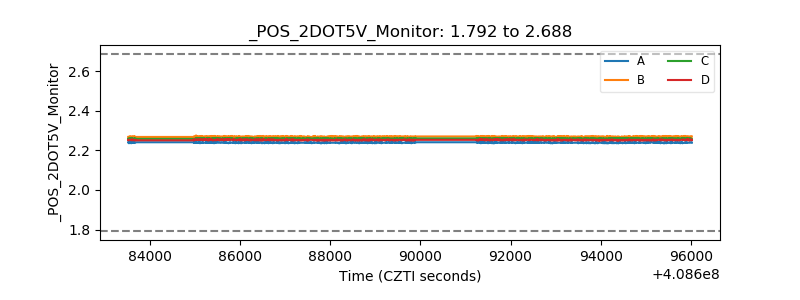 |
| +5 Volts monitor | 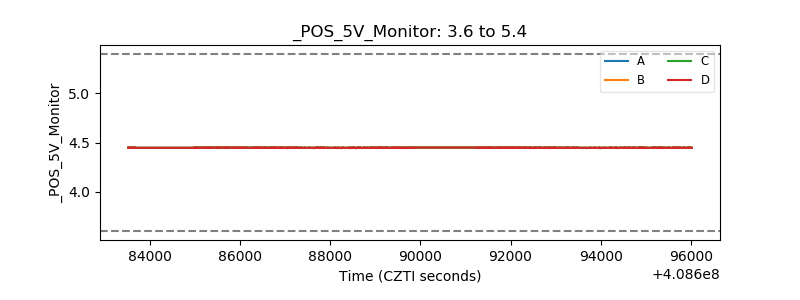 |
| _ROLL_ROT | 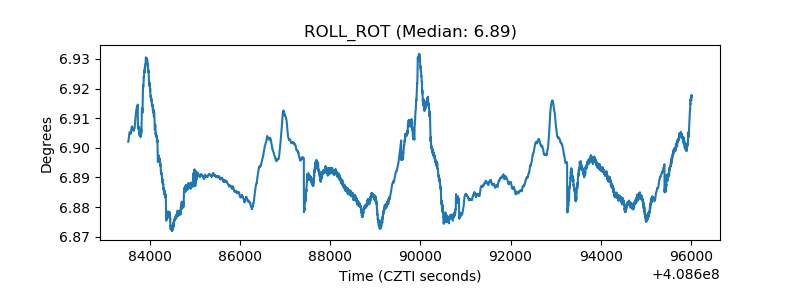 |
| _Roll_DEC | 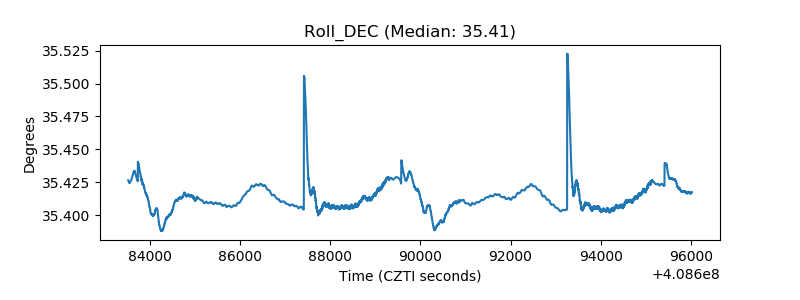 |
| _Roll_RA | 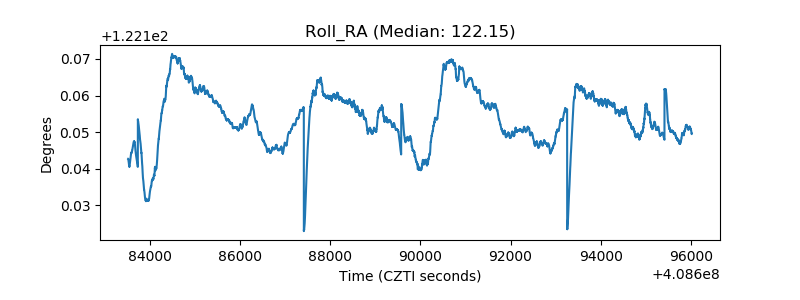 |
| Veto Counter | 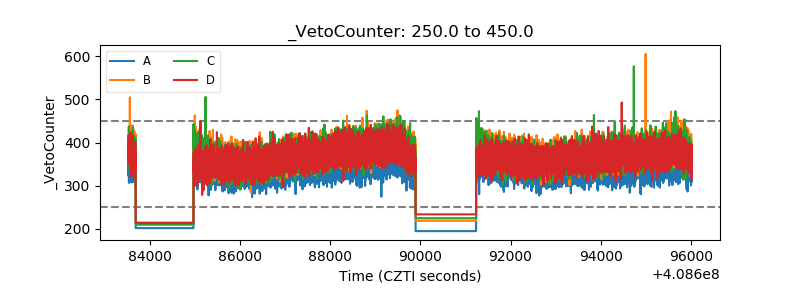 |