| Param | Original file | Final file |
|---|---|---|
| Filename | modeM0/AS1A12_095T02_9000005420_38992cztM0_level2.fits | modeM0/AS1A12_095T02_9000005420_38992cztM0_level2_quad_clean.evt |
| Size (bytes) | 559,987,200 | 129,597,120 |
| Size | 534.0 MB | 123.6 MB |
| Events in quadrant A | 4,974,248 | 857,969 |
| Events in quadrant B | 3,600,194 | 903,011 |
| Events in quadrant C | 3,691,254 | 859,571 |
| Events in quadrant D | 7,850,793 | 754,207 |
| Mode M0 | |||
|---|---|---|---|
| Quadrant | BADHDUFLAG | Total packets | Discarded packets |
| A | 0 | 19738 | 4 |
| B | 0 | 16024 | 2 |
| C | 0 | 15876 | 2 |
| D | 0 | 28871 | 6 |
| Mode SS | |||
|---|---|---|---|
| Quadrant | BADHDUFLAG | Total packets | Discarded packets |
| A | 0 | 164 | 0 |
| B | 0 | 164 | 0 |
| C | 0 | 164 | 0 |
| D | 0 | 164 | 0 |
| Mode M9 | |||
|---|---|---|---|
| Quadrant | BADHDUFLAG | Total packets | Discarded packets |
| A | 0 | 29 | 0 |
| B | 0 | 29 | 0 |
| C | 0 | 29 | 0 |
| D | 0 | 29 | 0 |
| Quadrant | Total seconds | Saturated seconds | Saturation percentage |
|---|---|---|---|
| A | 7895 | 310 | 3.926536% |
| B | 7895 | 12 | 0.151995% |
| C | 7895 | 5 | 0.063331% |
| D | 7893 | 623 | 7.893070% |
Noise dominated data is calculated using 1-second bins in cleaned event files. If a bin has >2000 counts, and if more than 50% of those come from <1% of pixels, then it is considered to be noise-dominated and hence unusable.
| Quadrant | # 1 sec bins | Bins with >0 counts | Bins with >2000 counts | High rate bins dominated by noise | Noise dominated (total time) | Noise dominated (detector-on time) | Marked lightcurve |
|---|---|---|---|---|---|---|---|
| A | 38600 | 7898 | 283 | 283 | 0.73% | 3.58% |  |
| B | 38600 | 7898 | 0 | 0 | 0.00% | 0.00% | 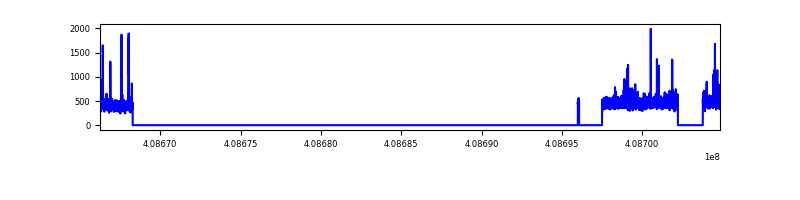 |
| C | 38600 | 7898 | 0 | 0 | 0.00% | 0.00% | 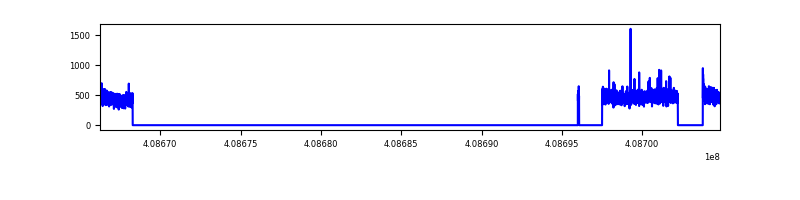 |
| D | 38600 | 7897 | 619 | 619 | 1.60% | 7.84% |  |
Top three noisy pixels from each quadrant. If the there are fewer than three noisy pixels in the level2.evt file, extra rows are filled as -1
| Pixel properties | Quadrant properties | ||||||
|---|---|---|---|---|---|---|---|
| Quadrant | DetID | PixID | Counts | Sigma | Mean | Median | Sigma |
| A | 13 | 248 | 1015709 | 5832.83 | 862 | 845 | 174.0 |
| A | 10 | 83 | 580669 | 3332.48 | 862 | 845 | 174.0 |
| A | 6 | 10 | 29836 | 166.62 | 862 | 845 | 174.0 |
| B | 5 | 172 | 78734 | 457.65 | 875 | 851 | 170.2 |
| B | 0 | 230 | 54310 | 314.13 | 875 | 851 | 170.2 |
| B | 12 | 111 | 21554 | 121.65 | 875 | 851 | 170.2 |
| C | 15 | 214 | 329306 | 1648.75 | 856 | 862 | 199.2 |
| C | 15 | 208 | 10462 | 48.19 | 856 | 862 | 199.2 |
| C | 14 | 67 | 8212 | 36.9 | 856 | 862 | 199.2 |
| D | 12 | 235 | 2431264 | 12081.78 | 834 | 808 | 201.2 |
| D | 2 | 153 | 1523904 | 7571.3 | 834 | 808 | 201.2 |
| D | 2 | 249 | 337372 | 1673.05 | 834 | 808 | 201.2 |
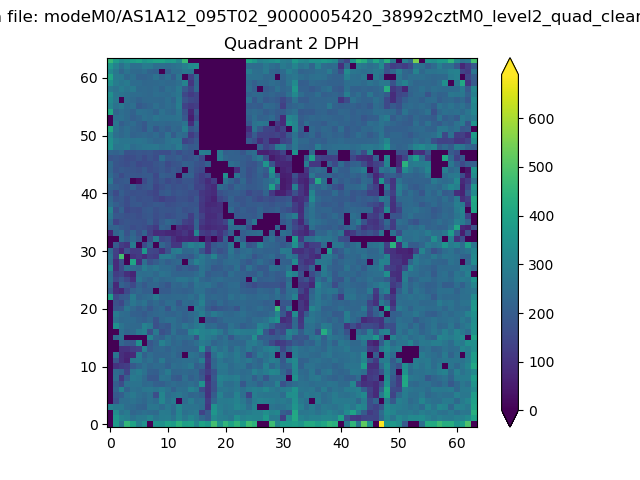
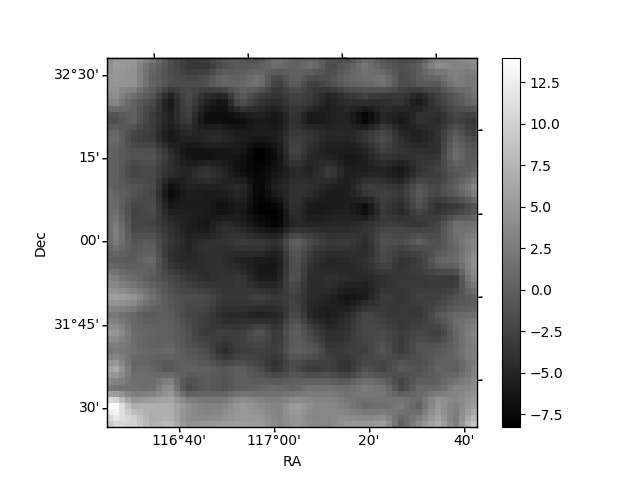
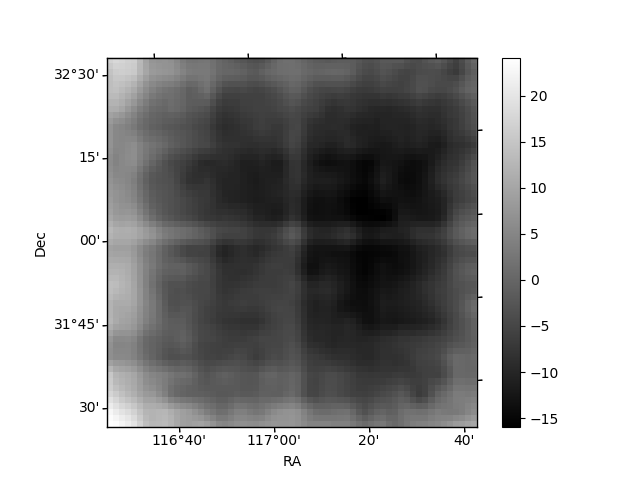
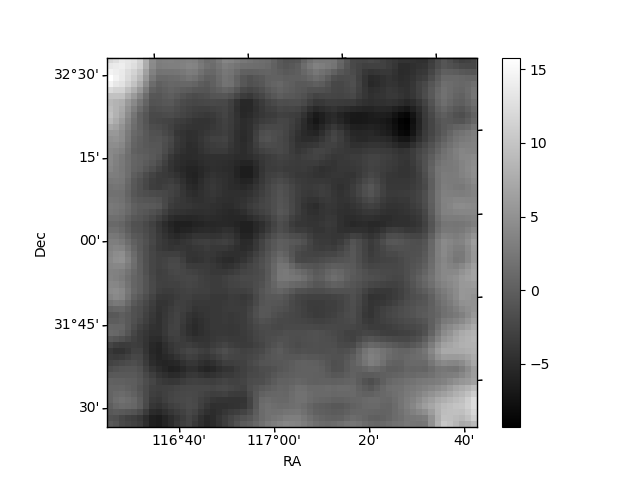
Histogram calculated using DETX and DETY for each event in the final _common_clean file
| Quadrant A | 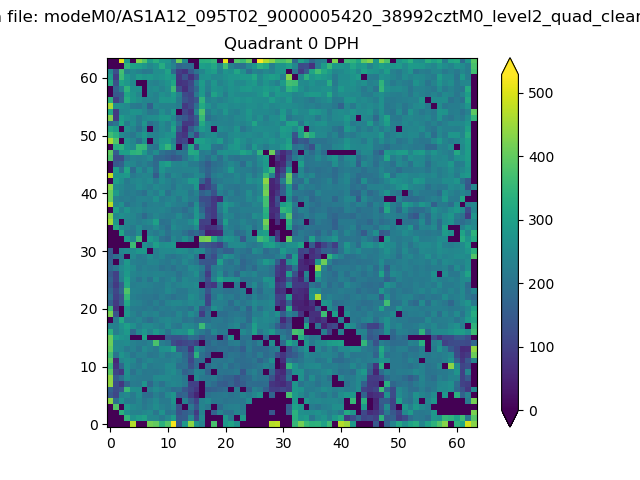 |
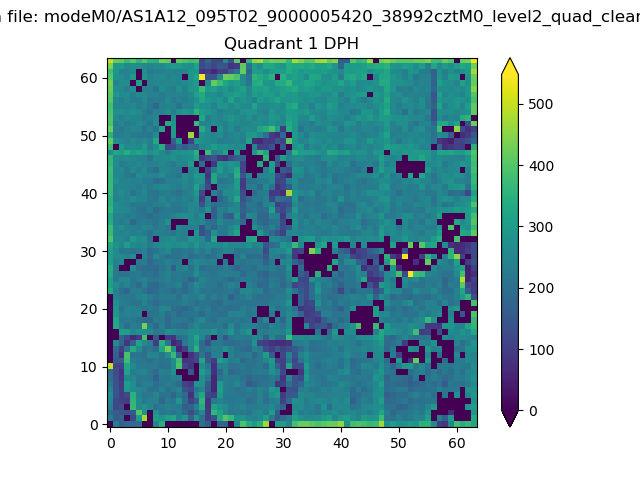 |
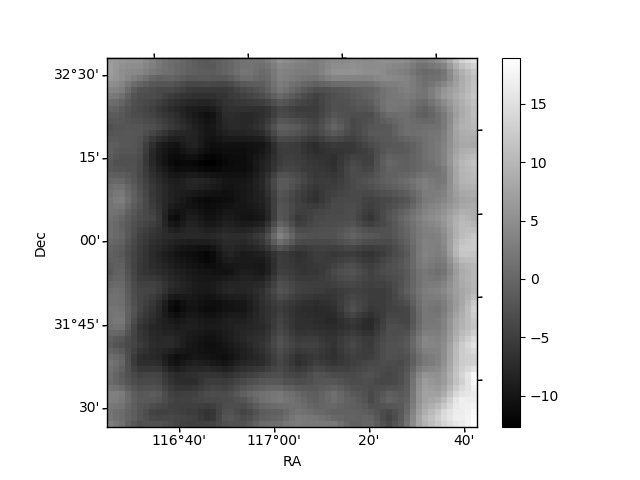
Quadrant B |
|---|---|---|---|
| Quadrant D | 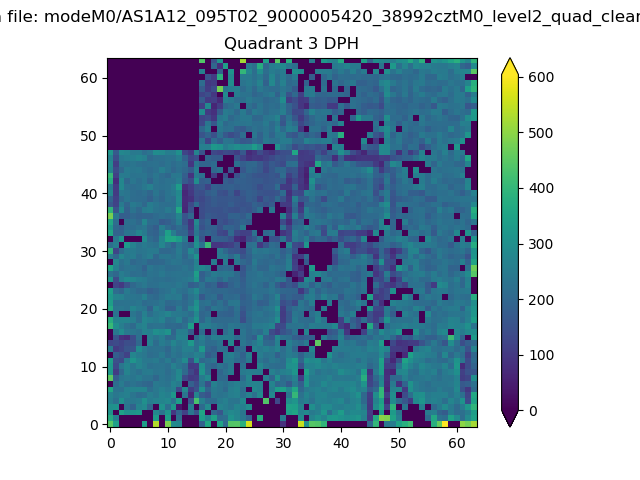 |
 |
Quadrant C |
| Plot type | Count rate plots | Images |
|---|---|---|
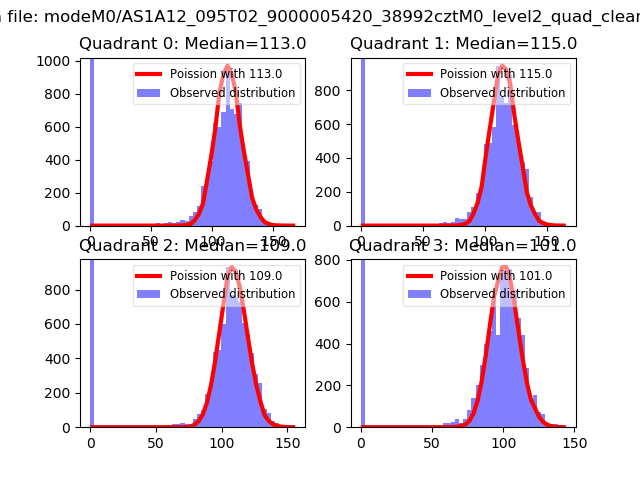
| Comparison with Poisson distribution Blue bars denote a histogram of data divided into 1 sec bins. Red curve is a Poisson curve with rate = median count rate of data. |
 |
 |
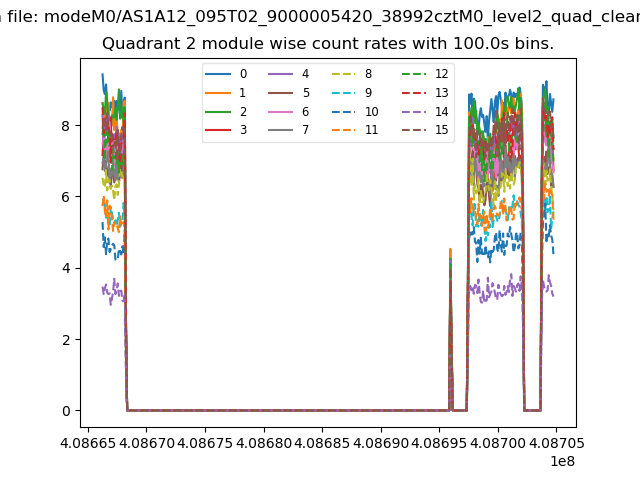
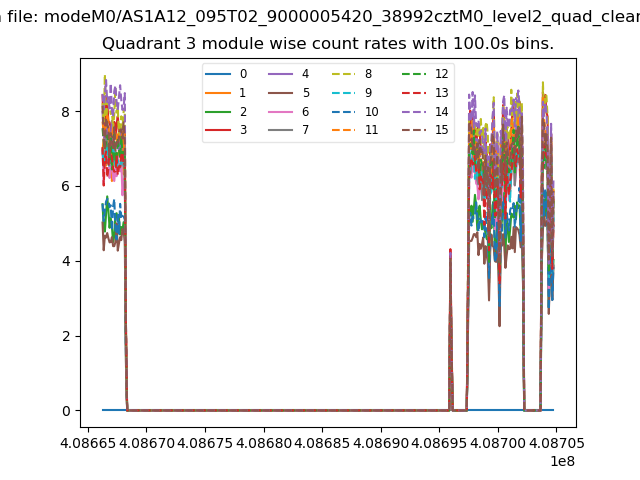
| Quadrant-wise count rates Data is divided into 100 sec bins |
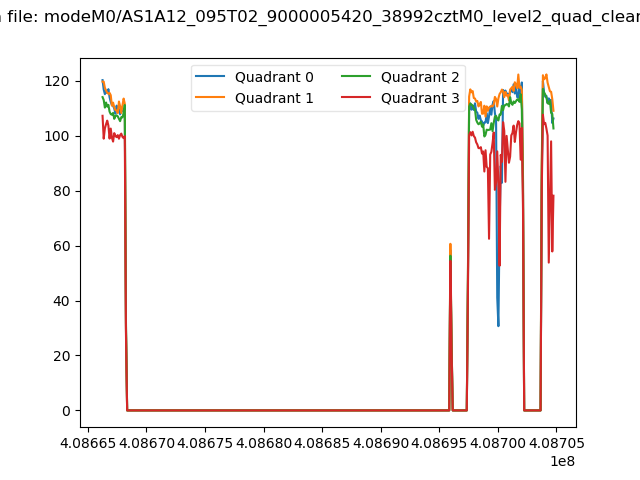 |
|
| Module-wise count rates for Quadrant A Data is divided into 100 sec bins |
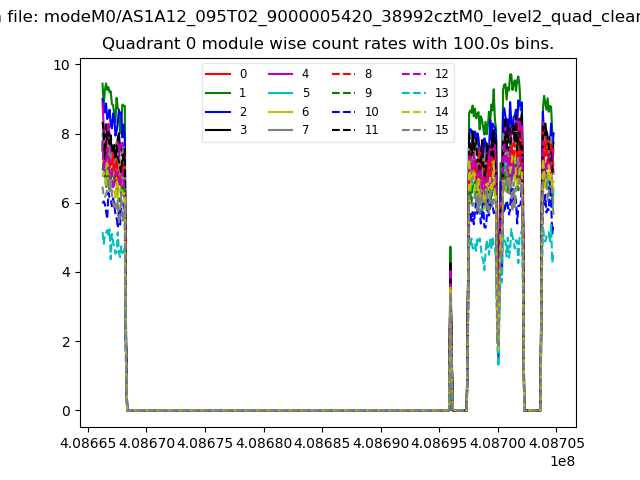 |
 |
| Module-wise count rates for Quadrant B Data is divided into 100 sec bins |
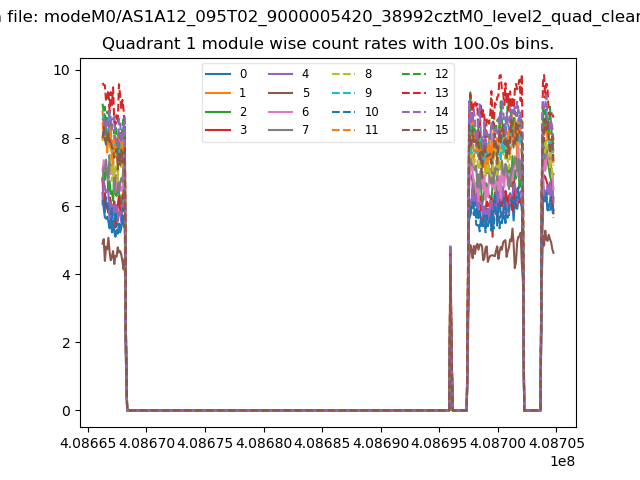 |
 |
| Module-wise count rates for Quadrant C Data is divided into 100 sec bins |
 |
 |
| Module-wise count rates for Quadrant D Data is divided into 100 sec bins |
 |
 |
| Parameter | Plot |
|---|---|
| CZT HV Monitor | 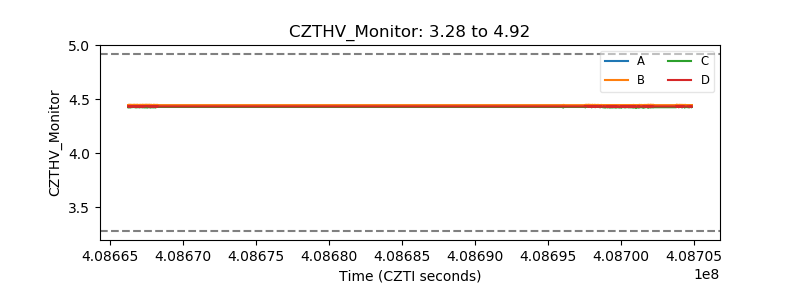 |
| D_VDD | 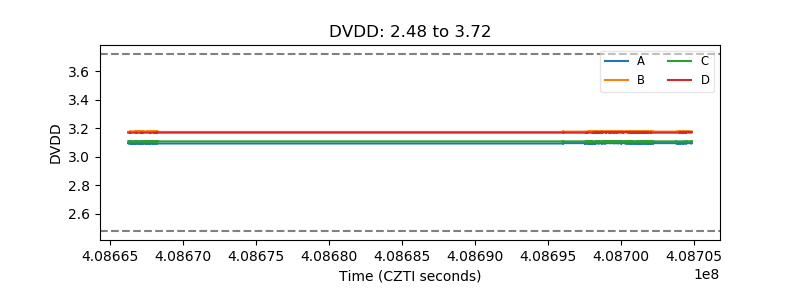 |
| Temperature 1 | 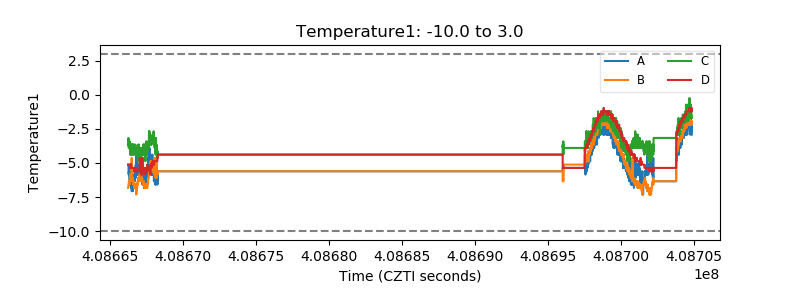 |
| Veto HV Monitor | 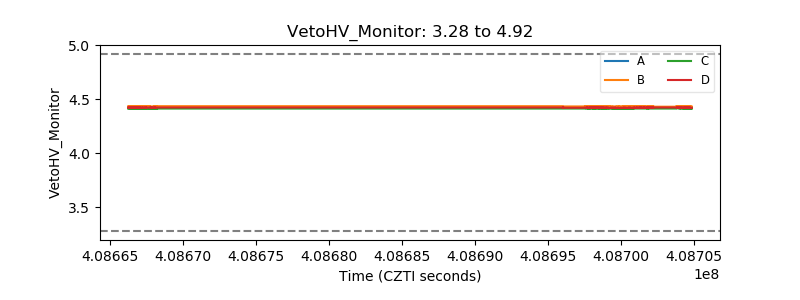 |
| Veto LLD | 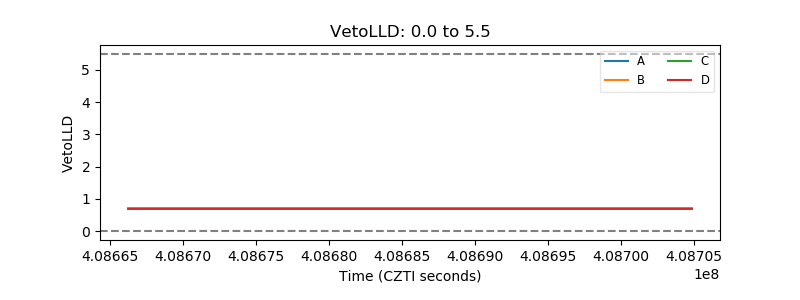 |
| Alpha Counter | 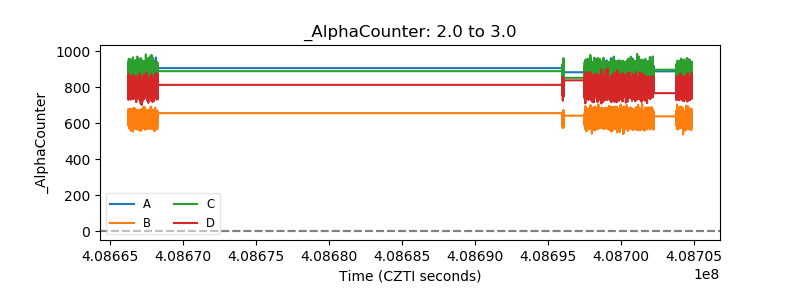 |
| _CPM_Rate | 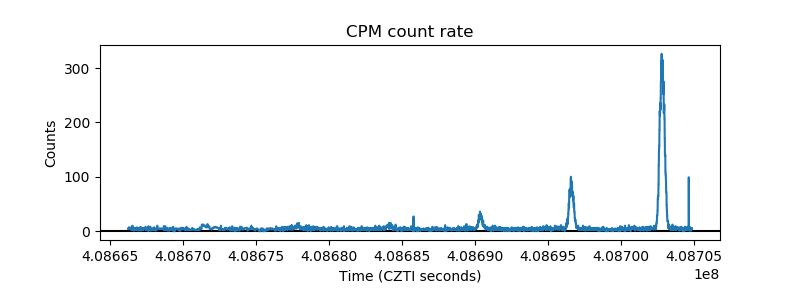 |
| CZT Counter | 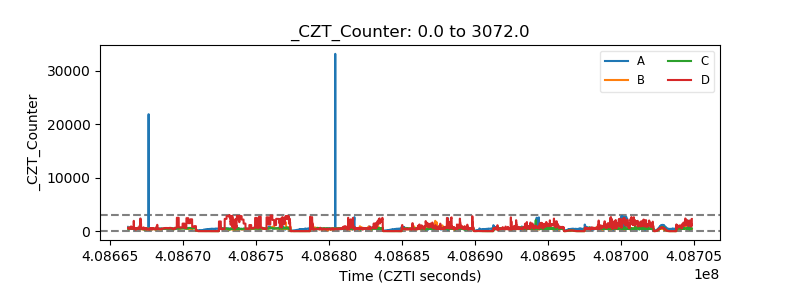 |
| +2.5 Volts monitor | 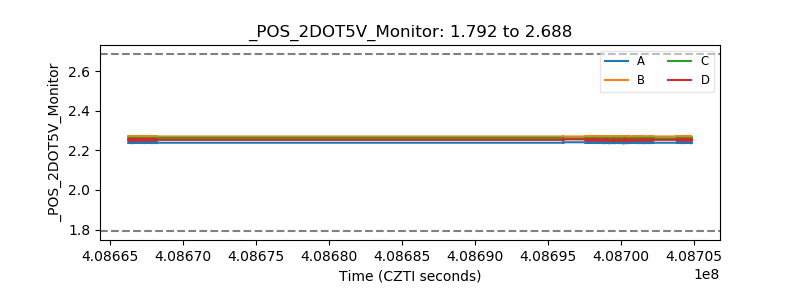 |
| +5 Volts monitor | 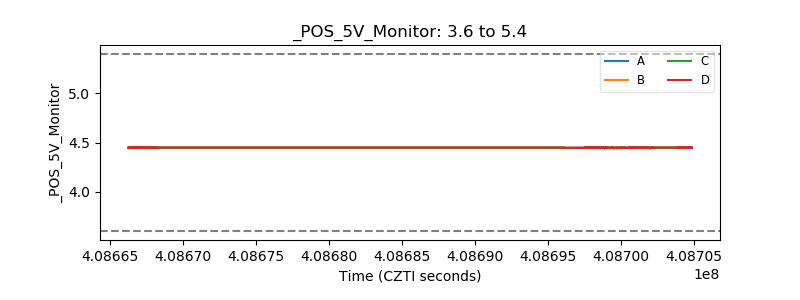 |
| _ROLL_ROT | 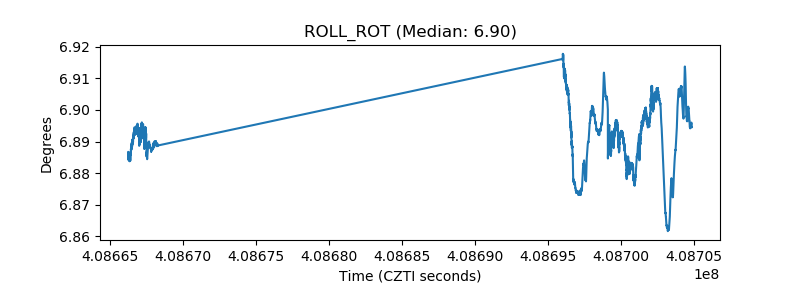 |
| _Roll_DEC | 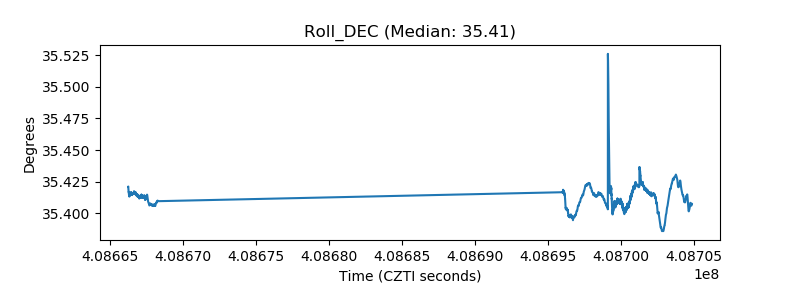 |
| _Roll_RA | 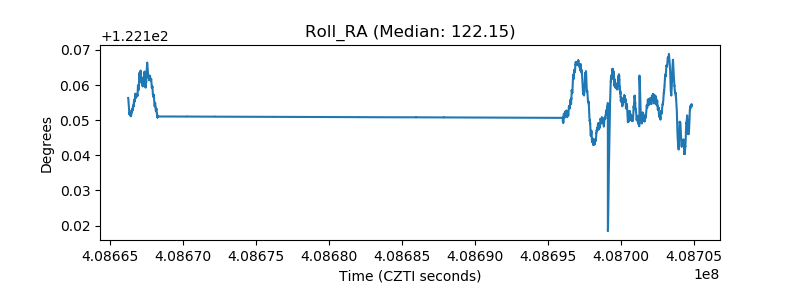 |
| Veto Counter | 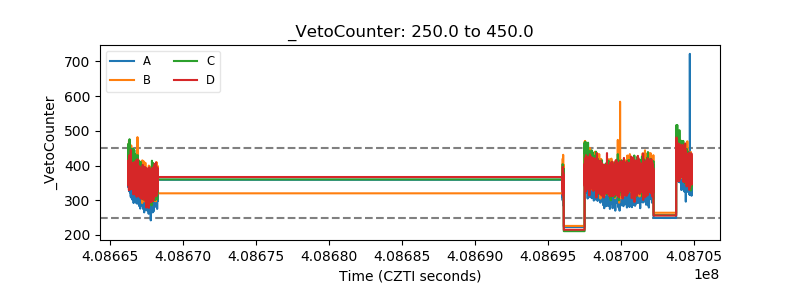 |