| Param | Original file | Final file |
|---|---|---|
| Filename | modeM0/AS1A12_095T02_9000005420_38993cztM0_level2.fits | modeM0/AS1A12_095T02_9000005420_38993cztM0_level2_quad_clean.evt |
| Size (bytes) | 2,033,942,400 | 496,019,520 |
| Size | 1.9 GB | 473.0 MB |
| Events in quadrant A | 16,761,239 | 3,370,690 |
| Events in quadrant B | 14,474,418 | 3,483,828 |
| Events in quadrant C | 14,340,721 | 3,321,875 |
| Events in quadrant D | 27,382,500 | 2,769,789 |
| Mode M0 | |||
|---|---|---|---|
| Quadrant | BADHDUFLAG | Total packets | Discarded packets |
| A | 0 | 67738 | 9 |
| B | 0 | 63037 | 7 |
| C | 0 | 60930 | 7 |
| D | 0 | 102267 | 7 |
| Mode SS | |||
|---|---|---|---|
| Quadrant | BADHDUFLAG | Total packets | Discarded packets |
| A | 0 | 614 | 0 |
| B | 0 | 614 | 0 |
| C | 0 | 614 | 0 |
| D | 0 | 614 | 0 |
| Mode M9 | |||
|---|---|---|---|
| Quadrant | BADHDUFLAG | Total packets | Discarded packets |
| A | 0 | 95 | 0 |
| B | 0 | 96 | 0 |
| C | 0 | 96 | 0 |
| D | 0 | 96 | 0 |
| Quadrant | Total seconds | Saturated seconds | Saturation percentage |
|---|---|---|---|
| A | 30151 | 523 | 1.734603% |
| B | 30151 | 203 | 0.673278% |
| C | 30151 | 27 | 0.089549% |
| D | 30151 | 3501 | 11.611555% |
Noise dominated data is calculated using 1-second bins in cleaned event files. If a bin has >2000 counts, and if more than 50% of those come from <1% of pixels, then it is considered to be noise-dominated and hence unusable.
| Quadrant | # 1 sec bins | Bins with >0 counts | Bins with >2000 counts | High rate bins dominated by noise | Noise dominated (total time) | Noise dominated (detector-on time) | Marked lightcurve |
|---|---|---|---|---|---|---|---|
| A | 44723 | 30158 | 461 | 461 | 1.03% | 1.53% | 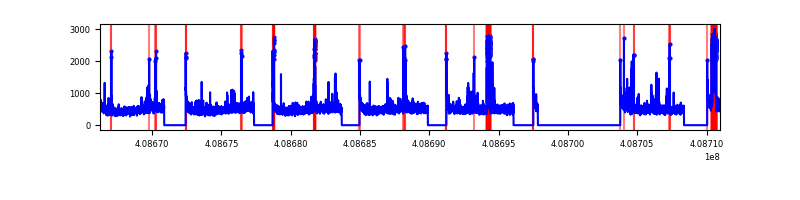 |
| B | 44723 | 30158 | 116 | 116 | 0.26% | 0.38% | 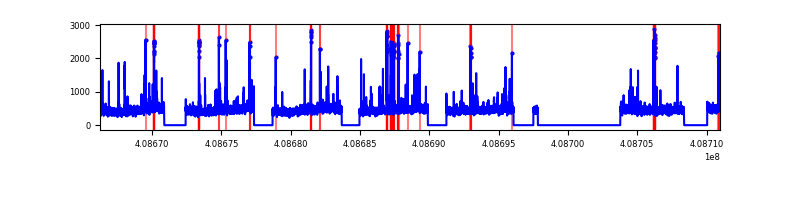 |
| C | 44723 | 30158 | 1 | 1 | 0.00% | 0.00% | 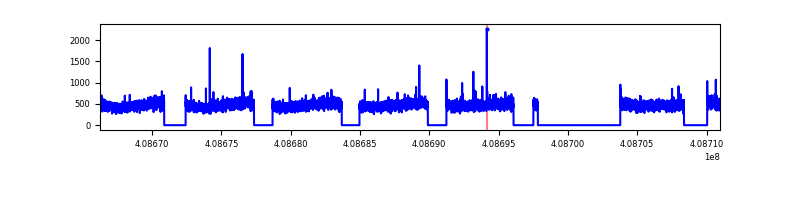 |
| D | 44723 | 30158 | 3418 | 3418 | 7.64% | 11.33% | 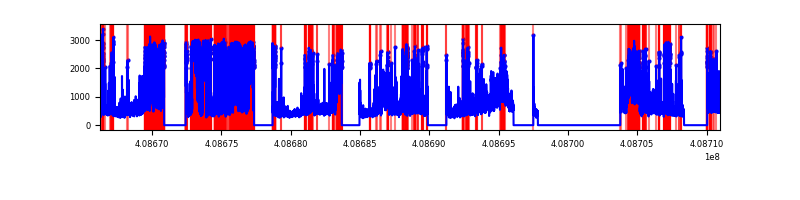 |
Top three noisy pixels from each quadrant. If the there are fewer than three noisy pixels in the level2.evt file, extra rows are filled as -1
| Pixel properties | Quadrant properties | ||||||
|---|---|---|---|---|---|---|---|
| Quadrant | DetID | PixID | Counts | Sigma | Mean | Median | Sigma |
| A | 10 | 83 | 2025889 | 2964.52 | 3413 | 3350 | 682.2 |
| A | 13 | 248 | 1360928 | 1989.86 | 3413 | 3350 | 682.2 |
| A | 15 | 222 | 85803 | 120.85 | 3413 | 3350 | 682.2 |
| B | 5 | 172 | 705770 | 1074.33 | 3406 | 3307 | 653.9 |
| B | 0 | 230 | 160094 | 239.79 | 3406 | 3307 | 653.9 |
| B | 15 | 85 | 102132 | 151.14 | 3406 | 3307 | 653.9 |
| C | 15 | 214 | 1228795 | 1581.03 | 3345 | 3369 | 775.1 |
| C | 13 | 61 | 22512 | 24.7 | 3345 | 3369 | 775.1 |
| C | 15 | 208 | 22434 | 24.6 | 3345 | 3369 | 775.1 |
| D | 12 | 235 | 9125878 | 11764.56 | 3177 | 3082 | 775.4 |
| D | 2 | 153 | 3336704 | 4298.97 | 3177 | 3082 | 775.4 |
| D | 12 | 227 | 1298193 | 1670.15 | 3177 | 3082 | 775.4 |
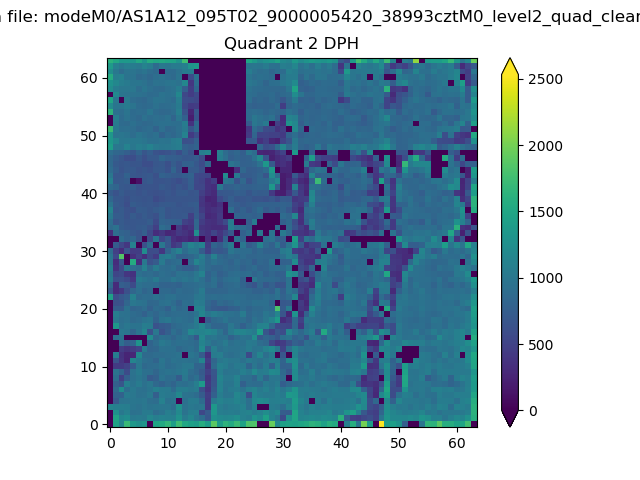
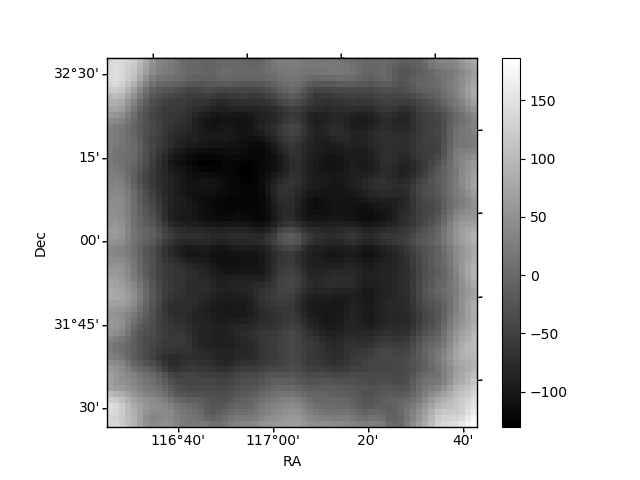
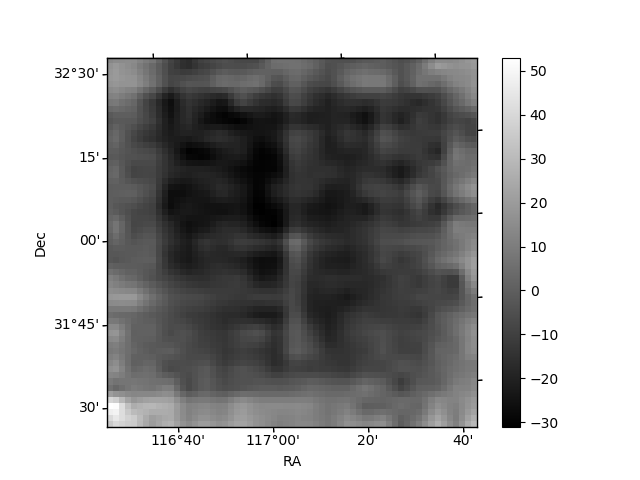
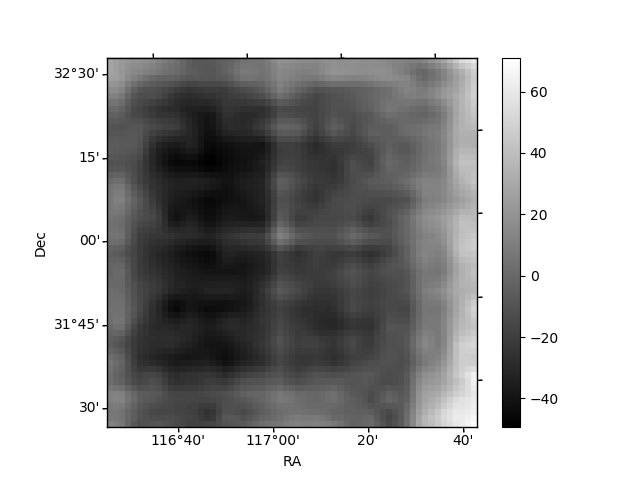
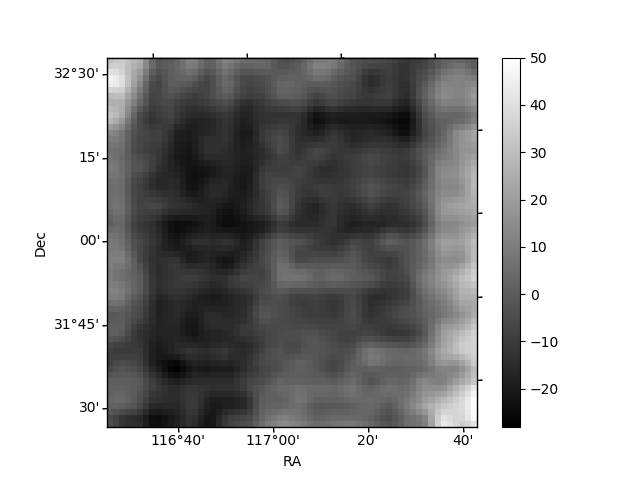
Histogram calculated using DETX and DETY for each event in the final _common_clean file
| Quadrant A | 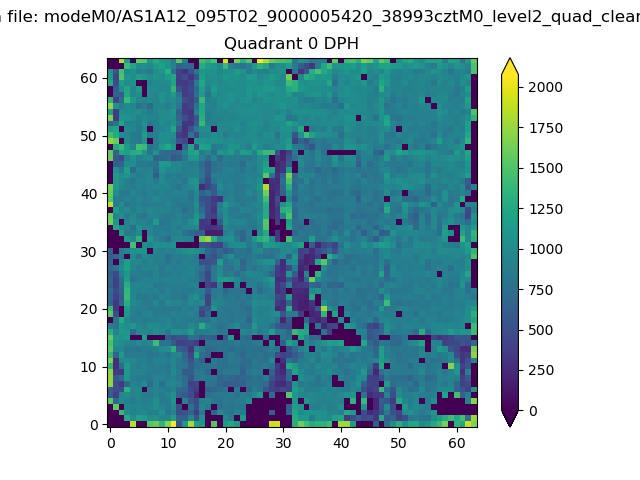 |
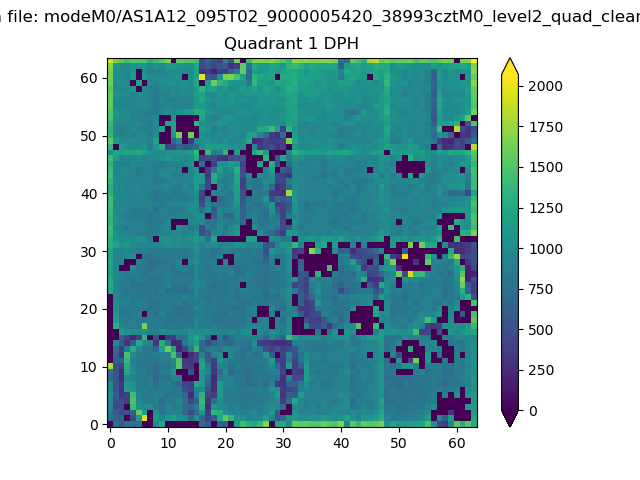 |
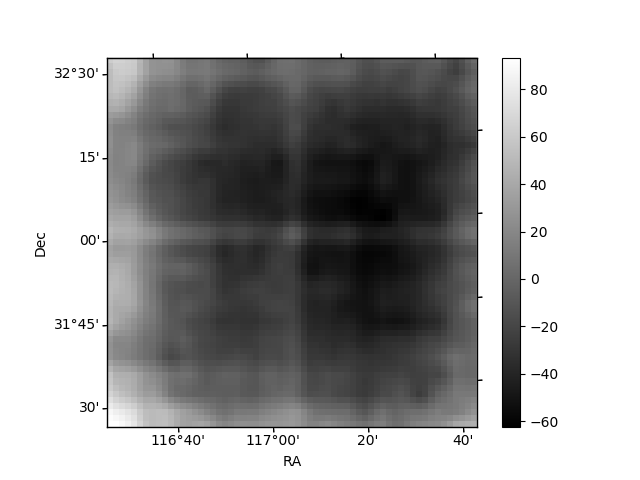
Quadrant B |
|---|---|---|---|
| Quadrant D | 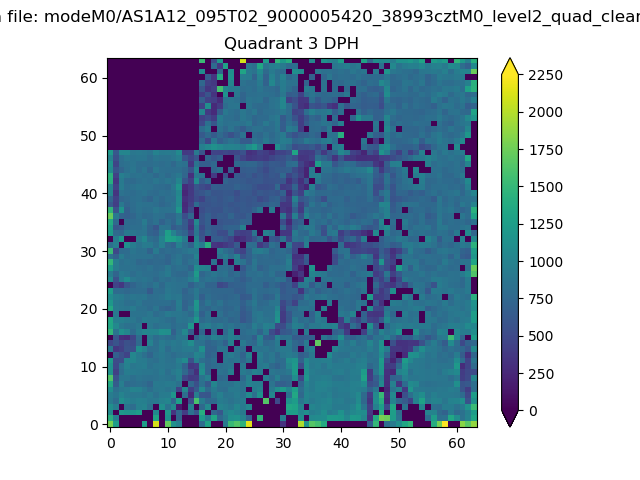 |
 |
Quadrant C |
| Plot type | Count rate plots | Images |
|---|---|---|
| Comparison with Poisson distribution Blue bars denote a histogram of data divided into 1 sec bins. Red curve is a Poisson curve with rate = median count rate of data. |
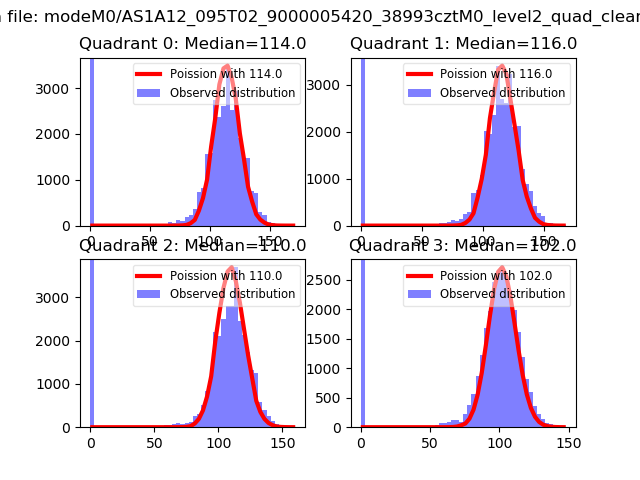 |
 |
| Quadrant-wise count rates Data is divided into 100 sec bins |
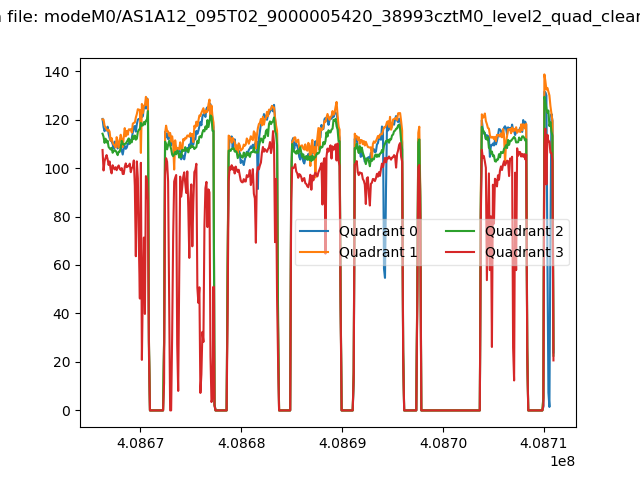 |
|
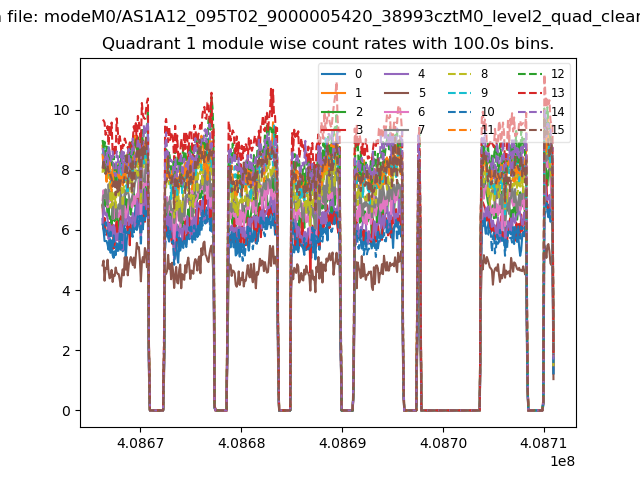
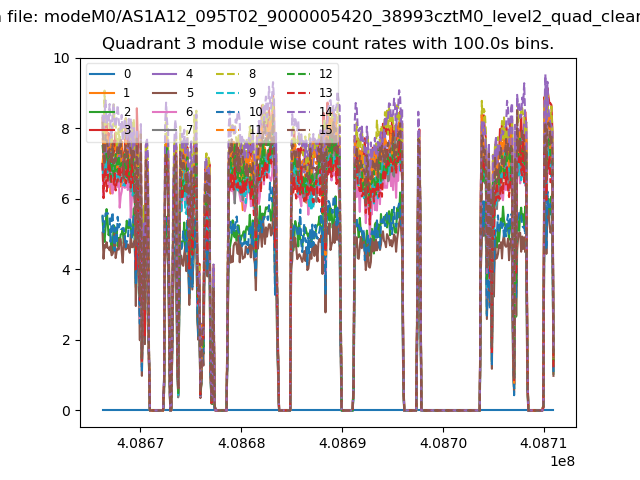
| Module-wise count rates for Quadrant A Data is divided into 100 sec bins |
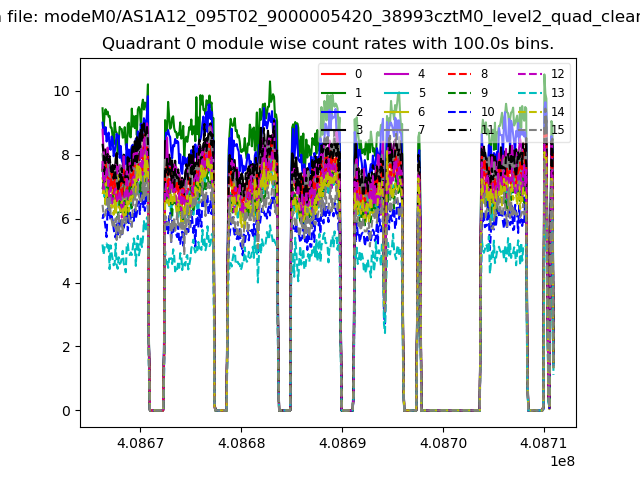 |
 |
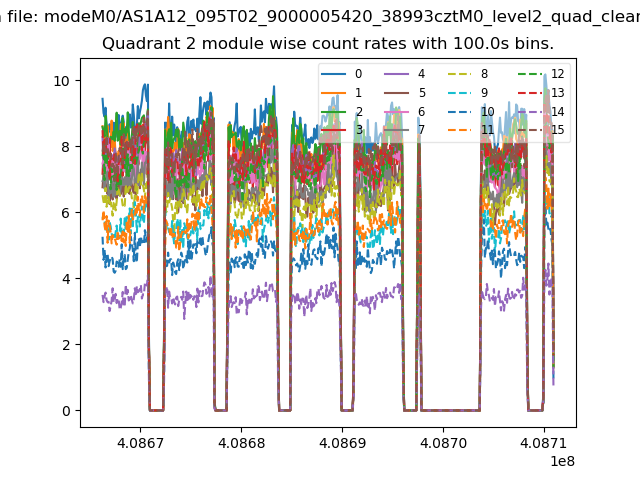
| Module-wise count rates for Quadrant B Data is divided into 100 sec bins |
 |
 |
| Module-wise count rates for Quadrant C Data is divided into 100 sec bins |
 |
 |
| Module-wise count rates for Quadrant D Data is divided into 100 sec bins |
 |
 |
| Parameter | Plot |
|---|---|
| CZT HV Monitor | 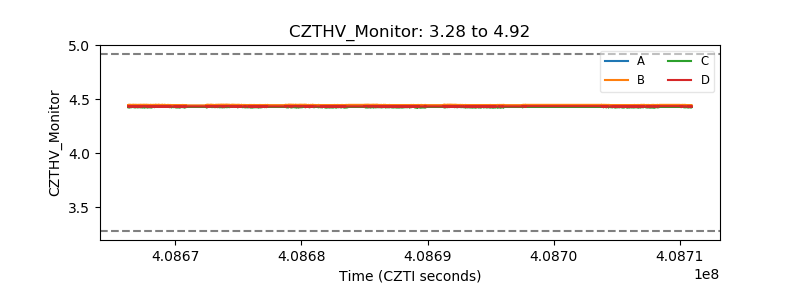 |
| D_VDD | 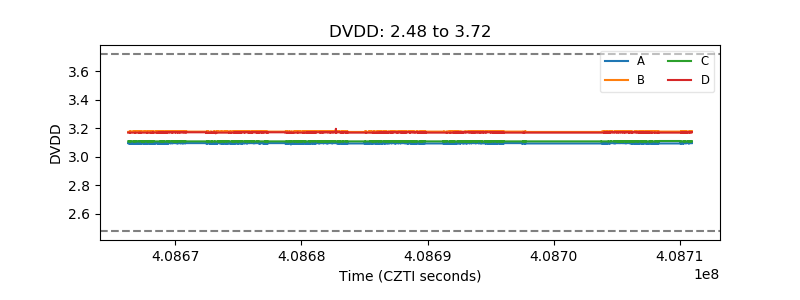 |
| Temperature 1 | 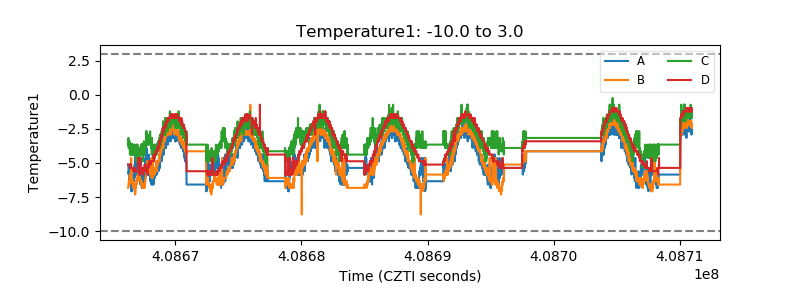 |
| Veto HV Monitor | 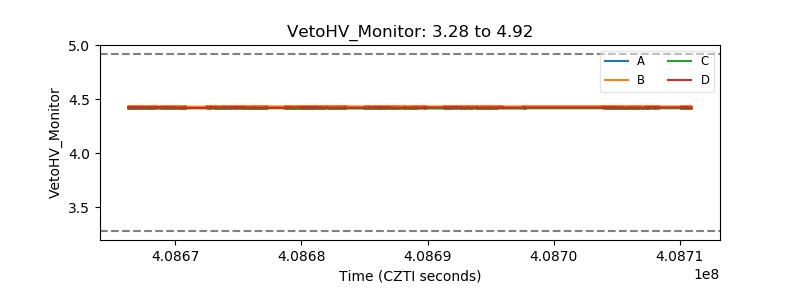 |
| Veto LLD | 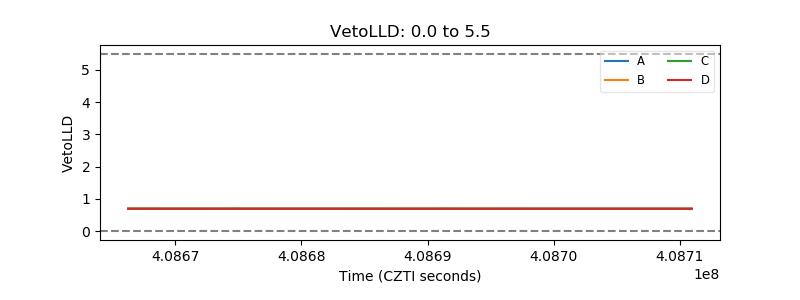 |
| Alpha Counter | 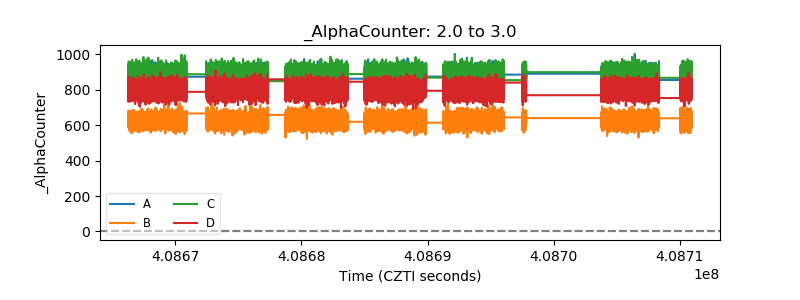 |
| _CPM_Rate | 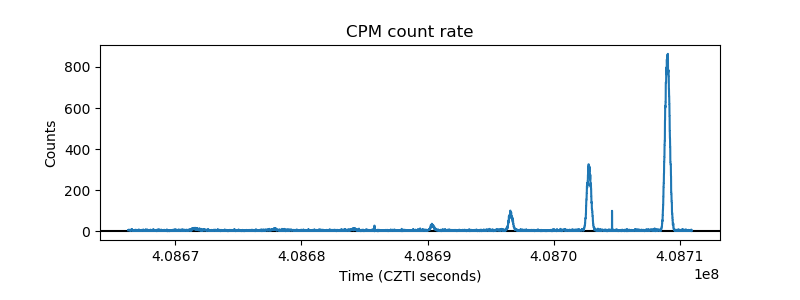 |
| CZT Counter | 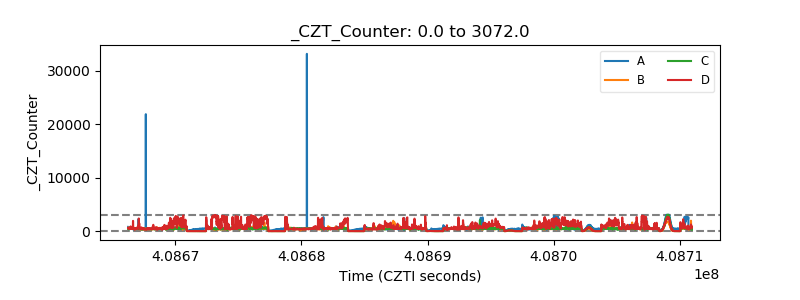 |
| +2.5 Volts monitor | 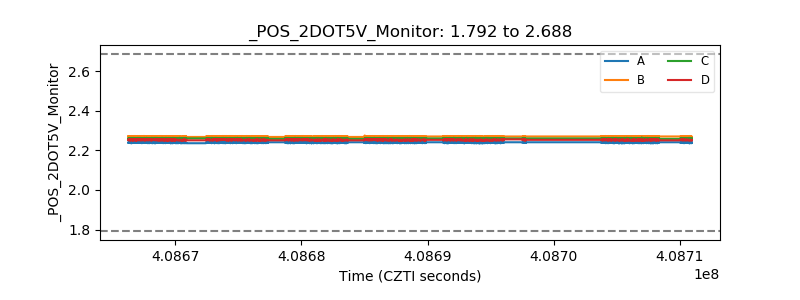 |
| +5 Volts monitor | 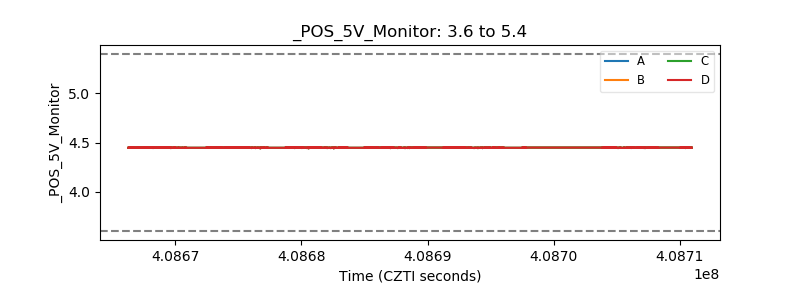 |
| _ROLL_ROT | 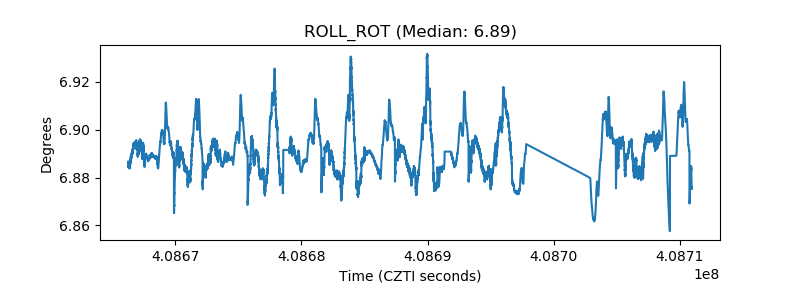 |
| _Roll_DEC | 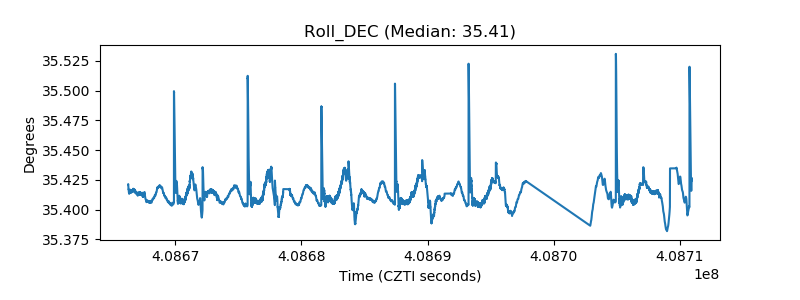 |
| _Roll_RA | 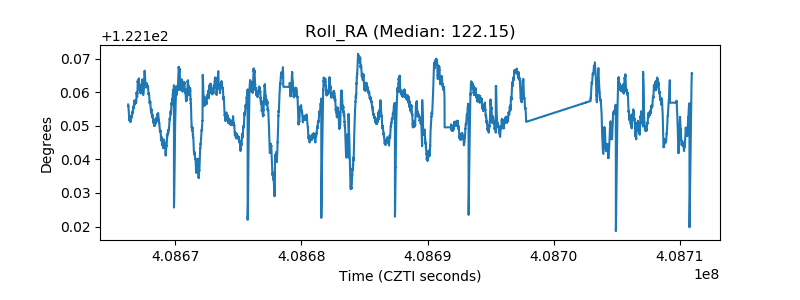 |
| Veto Counter | 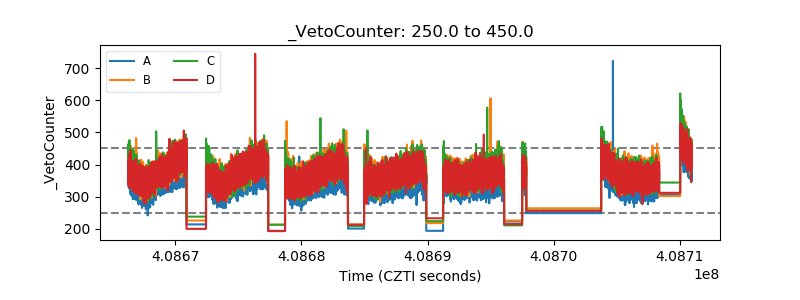 |