| Param | Original file | Final file |
|---|---|---|
| Filename | modeM0/AS1A12_095T02_9000005420_38995cztM0_level2.fits | modeM0/AS1A12_095T02_9000005420_38995cztM0_level2_quad_clean.evt |
| Size (bytes) | 374,264,640 | 95,702,400 |
| Size | 356.9 MB | 91.3 MB |
| Events in quadrant A | 4,305,401 | 608,525 |
| Events in quadrant B | 2,700,810 | 677,045 |
| Events in quadrant C | 2,740,452 | 641,338 |
| Events in quadrant D | 3,686,481 | 593,120 |
| Mode M0 | |||
|---|---|---|---|
| Quadrant | BADHDUFLAG | Total packets | Discarded packets |
| A | 0 | 16255 | 2 |
| B | 0 | 11356 | 1 |
| C | 0 | 11354 | 1 |
| D | 0 | 14731 | 1 |
| Mode SS | |||
|---|---|---|---|
| Quadrant | BADHDUFLAG | Total packets | Discarded packets |
| A | 0 | 108 | 0 |
| B | 0 | 108 | 0 |
| C | 0 | 108 | 0 |
| D | 0 | 108 | 0 |
| Mode M9 | |||
|---|---|---|---|
| Quadrant | BADHDUFLAG | Total packets | Discarded packets |
| A | 0 | 24 | 0 |
| B | 0 | 24 | 0 |
| C | 0 | 24 | 0 |
| D | 0 | 25 | 0 |
| Quadrant | Total seconds | Saturated seconds | Saturation percentage |
|---|---|---|---|
| A | 5408 | 549 | 10.151627% |
| B | 5408 | 21 | 0.388314% |
| C | 5408 | 7 | 0.129438% |
| D | 5408 | 95 | 1.756657% |
Noise dominated data is calculated using 1-second bins in cleaned event files. If a bin has >2000 counts, and if more than 50% of those come from <1% of pixels, then it is considered to be noise-dominated and hence unusable.
| Quadrant | # 1 sec bins | Bins with >0 counts | Bins with >2000 counts | High rate bins dominated by noise | Noise dominated (total time) | Noise dominated (detector-on time) | Marked lightcurve |
|---|---|---|---|---|---|---|---|
| A | 7231 | 5409 | 504 | 504 | 6.97% | 9.32% | 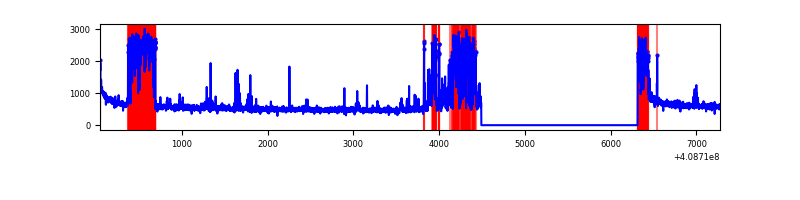 |
| B | 7231 | 5409 | 9 | 9 | 0.12% | 0.17% | 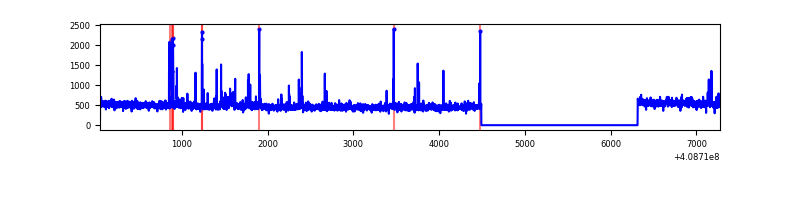 |
| C | 7231 | 5409 | 0 | 0 | 0.00% | 0.00% | 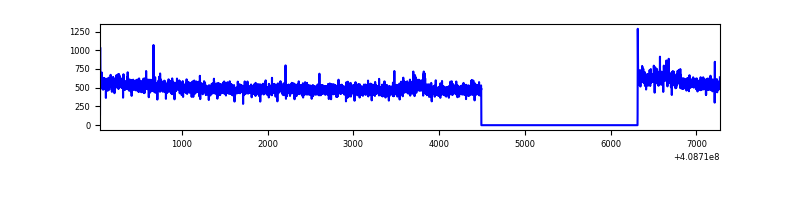 |
| D | 7231 | 5409 | 81 | 81 | 1.12% | 1.50% | 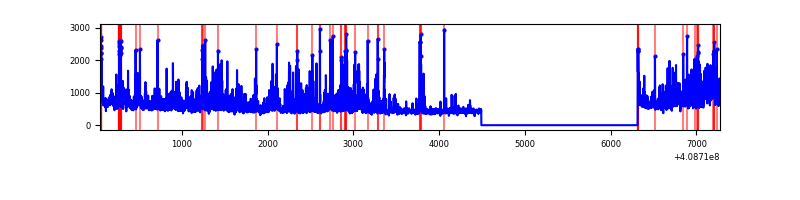 |
Top three noisy pixels from each quadrant. If the there are fewer than three noisy pixels in the level2.evt file, extra rows are filled as -1
| Pixel properties | Quadrant properties | ||||||
|---|---|---|---|---|---|---|---|
| Quadrant | DetID | PixID | Counts | Sigma | Mean | Median | Sigma |
| A | 13 | 248 | 1461921 | 11693.44 | 617 | 605 | 125.0 |
| A | 10 | 83 | 408913 | 3267.28 | 617 | 605 | 125.0 |
| A | 6 | 10 | 24281 | 189.46 | 617 | 605 | 125.0 |
| B | 5 | 172 | 67644 | 542.1 | 642 | 625 | 123.6 |
| B | 0 | 230 | 43917 | 350.18 | 642 | 625 | 123.6 |
| B | 5 | 184 | 30727 | 243.49 | 642 | 625 | 123.6 |
| C | 15 | 214 | 225347 | 1519.07 | 632 | 635 | 147.9 |
| C | 1 | 128 | 43982 | 293.03 | 632 | 635 | 147.9 |
| C | 13 | 61 | 4295 | 24.74 | 632 | 635 | 147.9 |
| D | 12 | 235 | 758707 | 4946.19 | 630 | 612 | 153.3 |
| D | 12 | 227 | 196003 | 1274.83 | 630 | 612 | 153.3 |
| D | 2 | 249 | 168969 | 1098.44 | 630 | 612 | 153.3 |
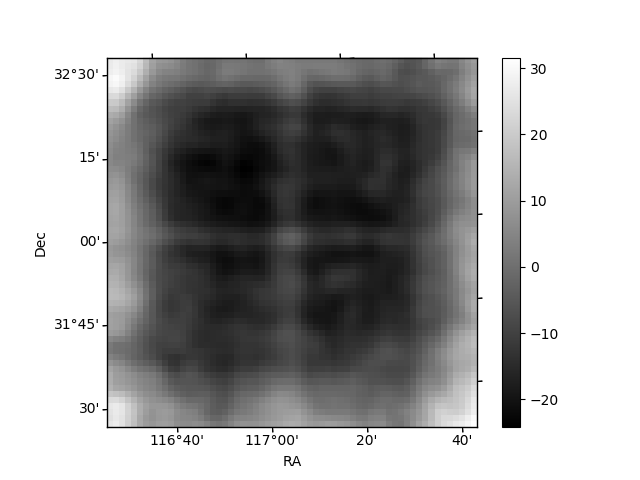
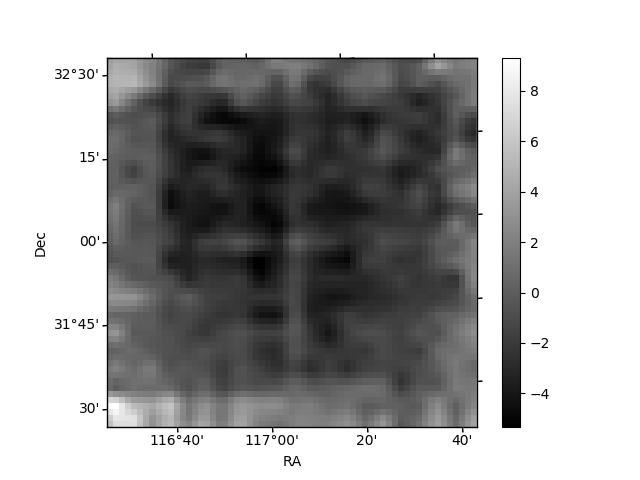
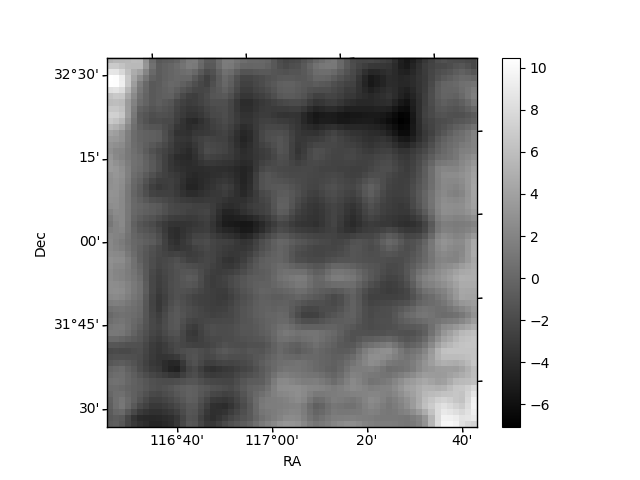
Histogram calculated using DETX and DETY for each event in the final _common_clean file
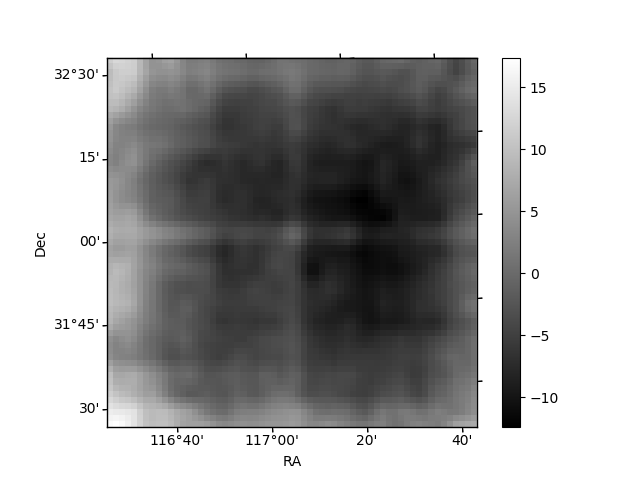
| Quadrant A | 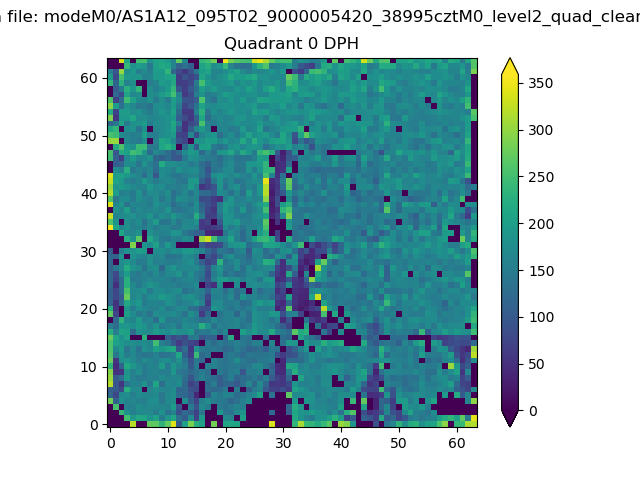 |
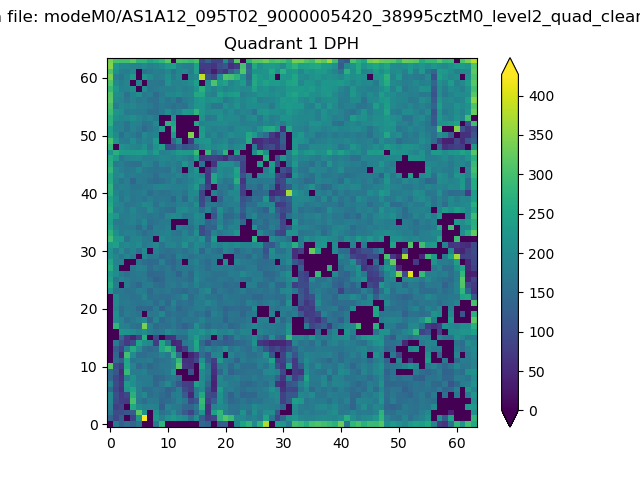 |
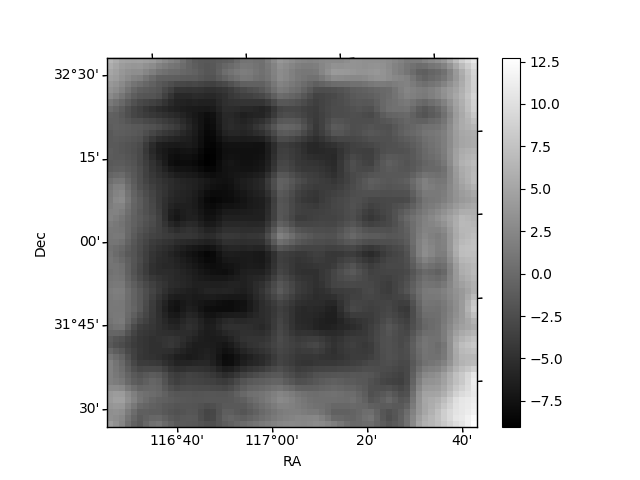
Quadrant B |
|---|---|---|---|
| Quadrant D |  |
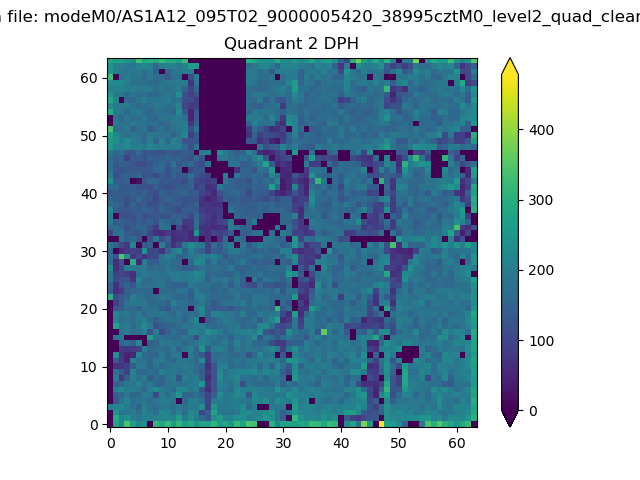 |
Quadrant C |
| Plot type | Count rate plots | Images |
|---|---|---|
| Comparison with Poisson distribution Blue bars denote a histogram of data divided into 1 sec bins. Red curve is a Poisson curve with rate = median count rate of data. |
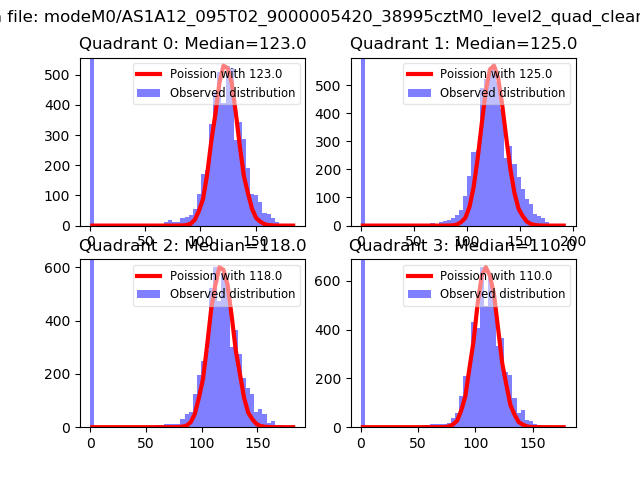 |
 |
| Quadrant-wise count rates Data is divided into 100 sec bins |
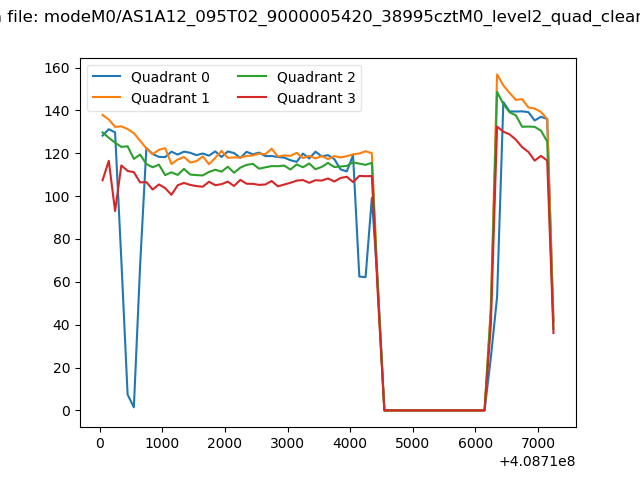 |
|
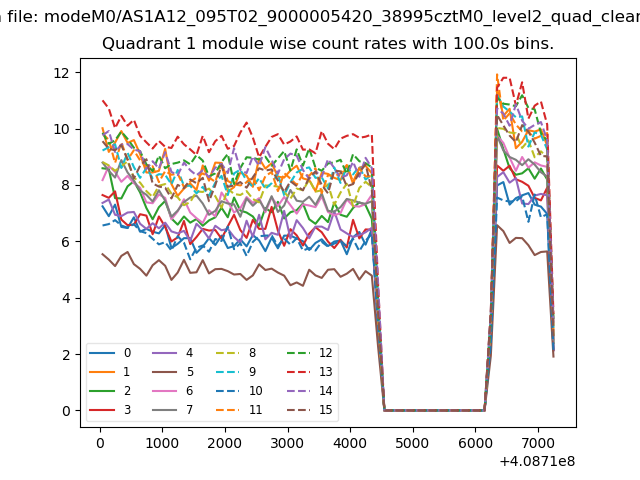
| Module-wise count rates for Quadrant A Data is divided into 100 sec bins |
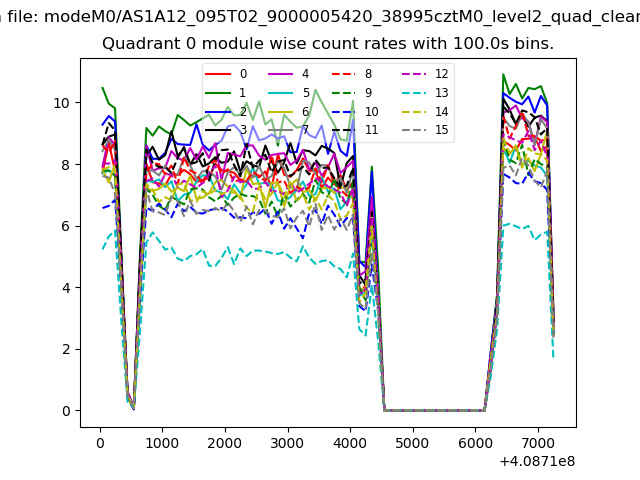 |
 |
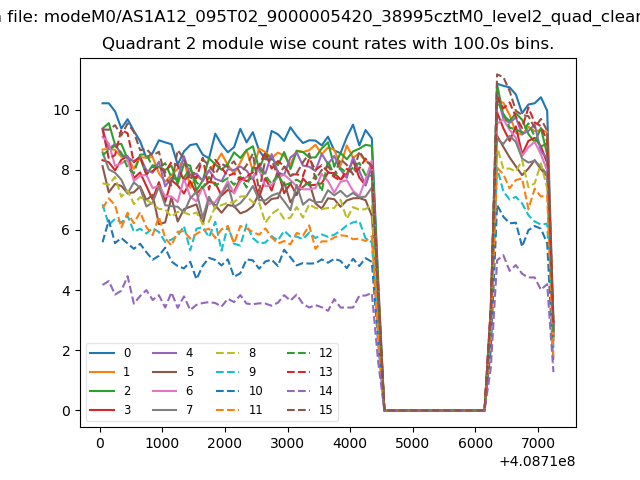
| Module-wise count rates for Quadrant B Data is divided into 100 sec bins |
 |
 |
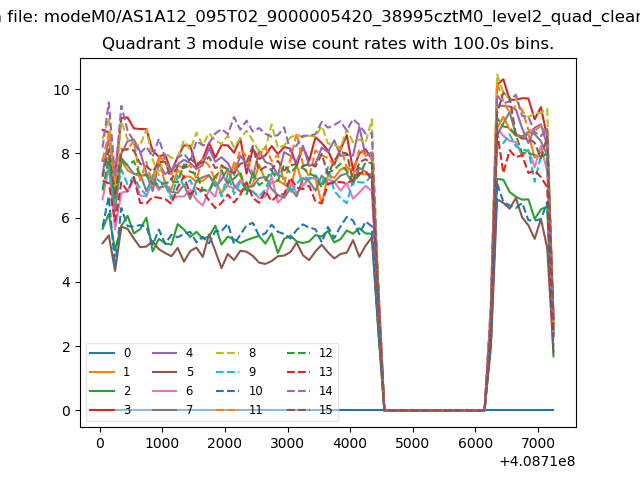
| Module-wise count rates for Quadrant C Data is divided into 100 sec bins |
 |
 |
| Module-wise count rates for Quadrant D Data is divided into 100 sec bins |
 |
 |
| Parameter | Plot |
|---|---|
| CZT HV Monitor | 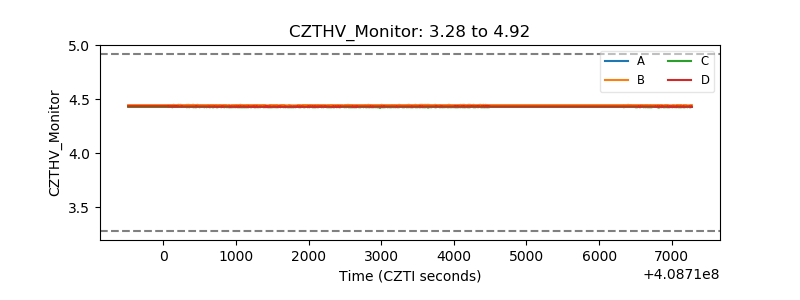 |
| D_VDD | 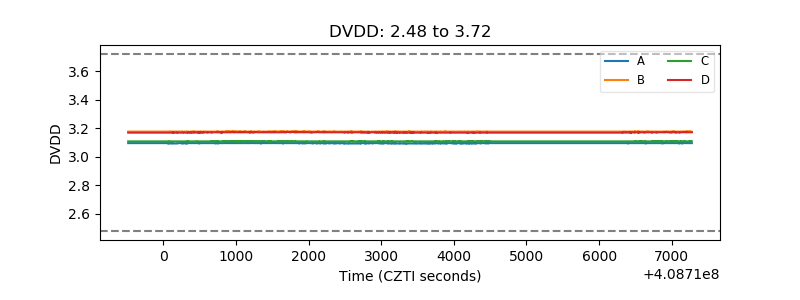 |
| Temperature 1 | 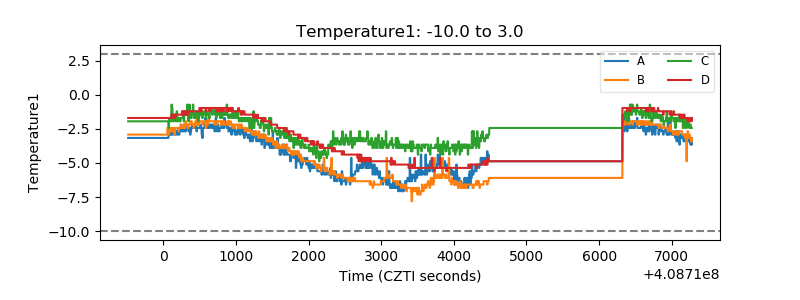 |
| Veto HV Monitor | 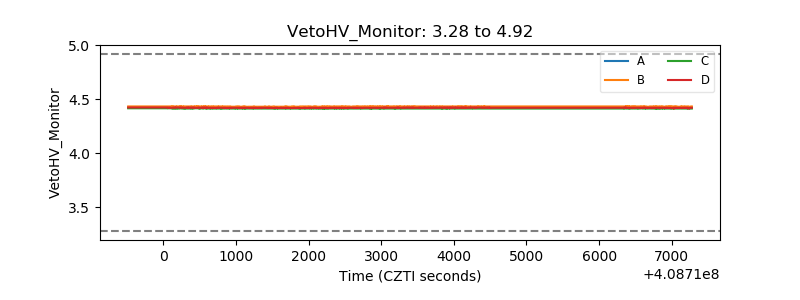 |
| Veto LLD | 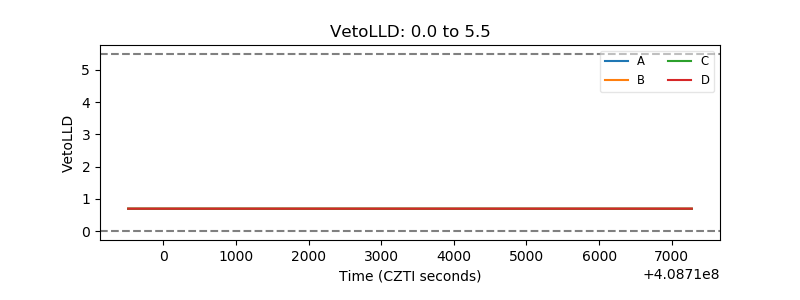 |
| Alpha Counter | 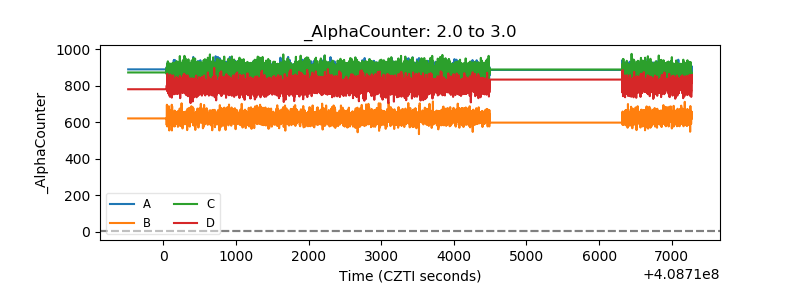 |
| _CPM_Rate | 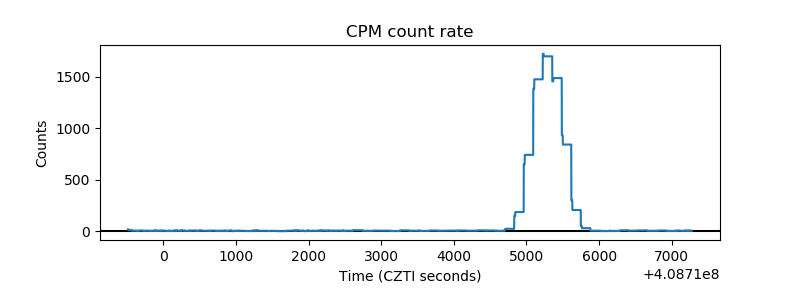 |
| CZT Counter | 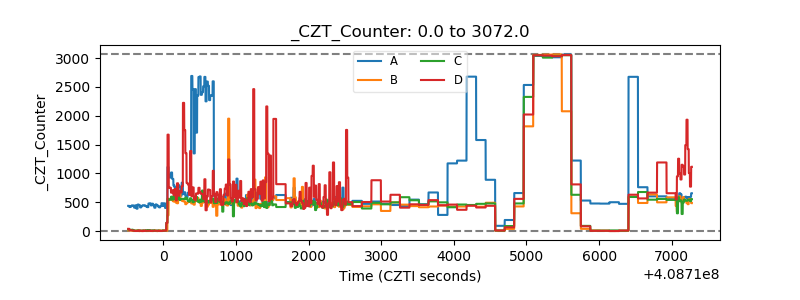 |
| +2.5 Volts monitor | 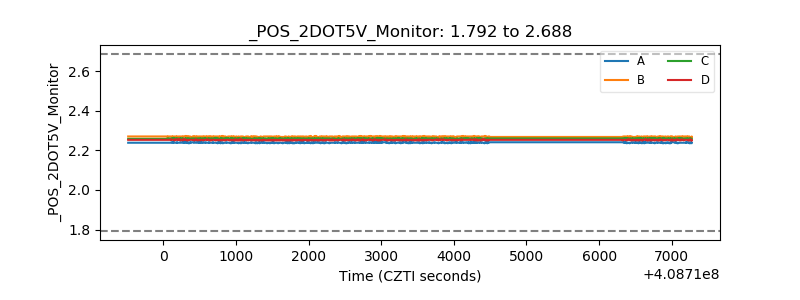 |
| +5 Volts monitor | 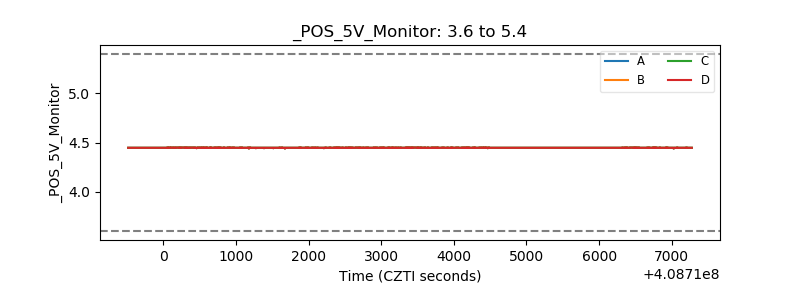 |
| _ROLL_ROT | 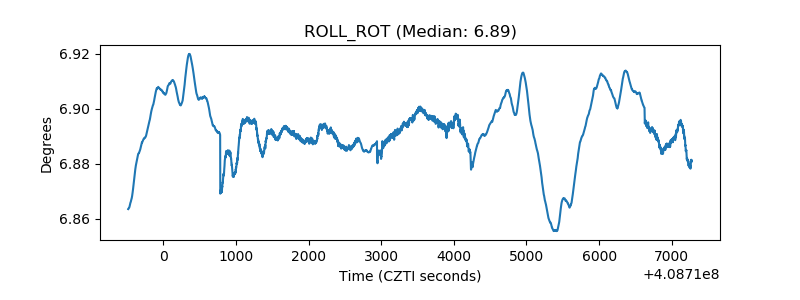 |
| _Roll_DEC | 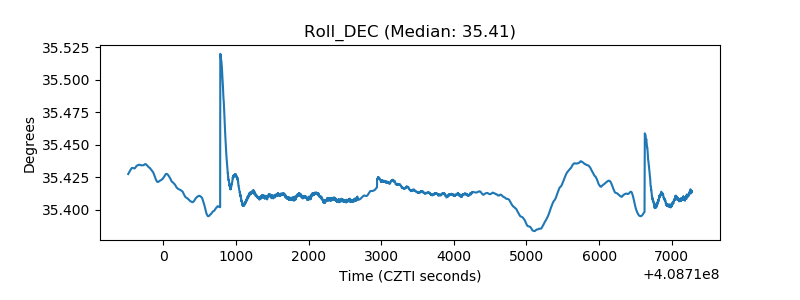 |
| _Roll_RA | 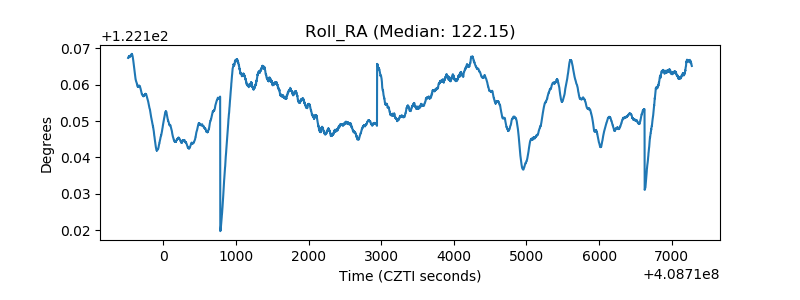 |
| Veto Counter | 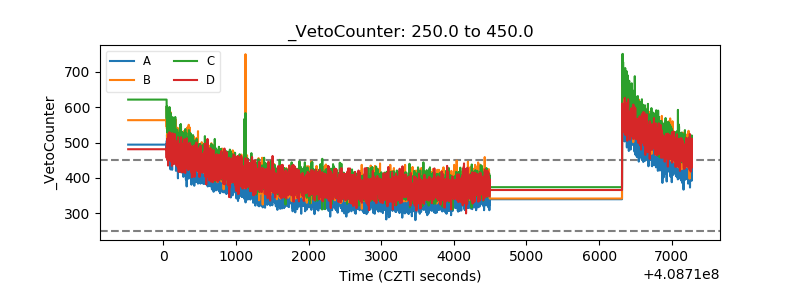 |