| Param | Original file | Final file |
|---|---|---|
| Filename | modeM0/AS1A12_095T02_9000005420_38997cztM0_level2.fits | modeM0/AS1A12_095T02_9000005420_38997cztM0_level2_quad_clean.evt |
| Size (bytes) | 403,335,360 | 98,291,520 |
| Size | 384.7 MB | 93.7 MB |
| Events in quadrant A | 5,332,671 | 630,998 |
| Events in quadrant B | 2,955,092 | 689,076 |
| Events in quadrant C | 2,750,800 | 682,955 |
| Events in quadrant D | 3,497,027 | 618,268 |
| Mode M0 | |||
|---|---|---|---|
| Quadrant | BADHDUFLAG | Total packets | Discarded packets |
| A | 0 | 19351 | 3 |
| B | 0 | 11979 | 2 |
| C | 0 | 11321 | 2 |
| D | 0 | 13795 | 2 |
| Mode SS | |||
|---|---|---|---|
| Quadrant | BADHDUFLAG | Total packets | Discarded packets |
| A | 0 | 102 | 0 |
| B | 0 | 102 | 0 |
| C | 0 | 102 | 0 |
| D | 0 | 102 | 0 |
| Mode M9 | |||
|---|---|---|---|
| Quadrant | BADHDUFLAG | Total packets | Discarded packets |
| A | 0 | 31 | 0 |
| B | 0 | 31 | 0 |
| C | 0 | 31 | 0 |
| D | 0 | 32 | 0 |
| Quadrant | Total seconds | Saturated seconds | Saturation percentage |
|---|---|---|---|
| A | 5075 | 702 | 13.832512% |
| B | 5075 | 182 | 3.586207% |
| C | 5075 | 11 | 0.216749% |
| D | 5075 | 164 | 3.231527% |
Noise dominated data is calculated using 1-second bins in cleaned event files. If a bin has >2000 counts, and if more than 50% of those come from <1% of pixels, then it is considered to be noise-dominated and hence unusable.
| Quadrant | # 1 sec bins | Bins with >0 counts | Bins with >2000 counts | High rate bins dominated by noise | Noise dominated (total time) | Noise dominated (detector-on time) | Marked lightcurve |
|---|---|---|---|---|---|---|---|
| A | 7109 | 5076 | 677 | 677 | 9.52% | 13.34% | 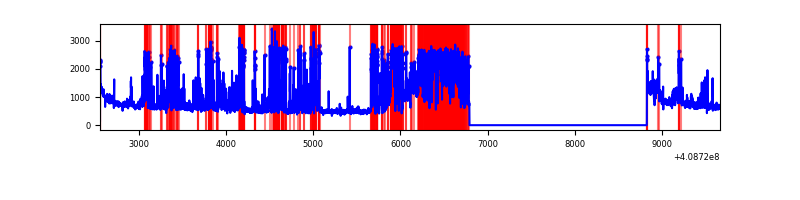 |
| B | 7109 | 5076 | 127 | 127 | 1.79% | 2.50% | 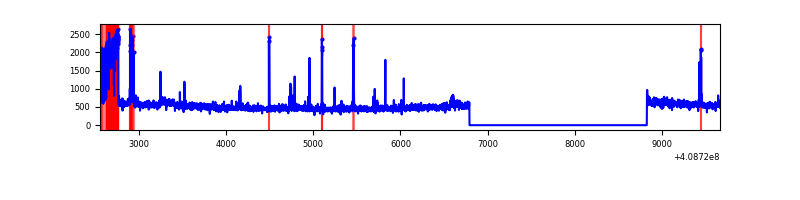 |
| C | 7109 | 5076 | 5 | 5 | 0.07% | 0.10% | 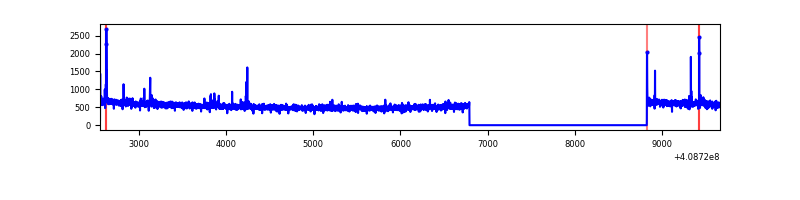 |
| D | 7109 | 5076 | 152 | 152 | 2.14% | 2.99% | 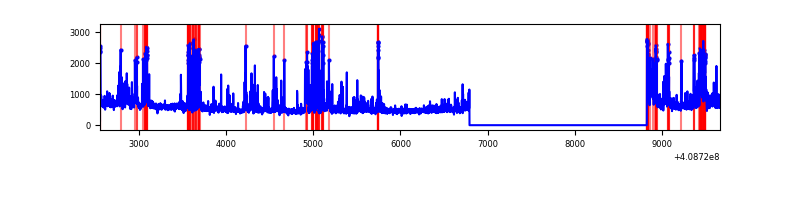 |
Top three noisy pixels from each quadrant. If the there are fewer than three noisy pixels in the level2.evt file, extra rows are filled as -1
| Pixel properties | Quadrant properties | ||||||
|---|---|---|---|---|---|---|---|
| Quadrant | DetID | PixID | Counts | Sigma | Mean | Median | Sigma |
| A | 15 | 222 | 2390698 | 19272.21 | 615 | 605 | 124.0 |
| A | 10 | 83 | 410225 | 3302.92 | 615 | 605 | 124.0 |
| A | 9 | 143 | 82684 | 661.83 | 615 | 605 | 124.0 |
| B | 5 | 172 | 407609 | 3414.46 | 628 | 610 | 119.2 |
| B | 0 | 230 | 60525 | 502.65 | 628 | 610 | 119.2 |
| B | 5 | 184 | 16656 | 134.61 | 628 | 610 | 119.2 |
| C | 15 | 214 | 210279 | 1430.52 | 635 | 640 | 146.5 |
| C | 2 | 16 | 39101 | 262.45 | 635 | 640 | 146.5 |
| C | 0 | 207 | 7142 | 44.37 | 635 | 640 | 146.5 |
| D | 12 | 235 | 560267 | 3698.88 | 625 | 609 | 151.3 |
| D | 2 | 249 | 235557 | 1552.82 | 625 | 609 | 151.3 |
| D | 13 | 249 | 128601 | 845.92 | 625 | 609 | 151.3 |
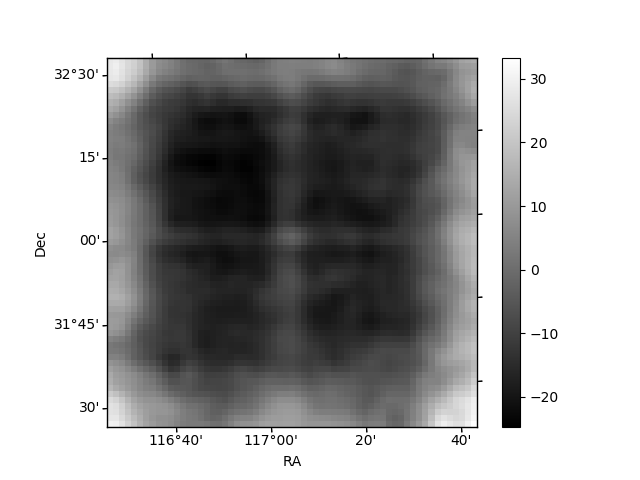
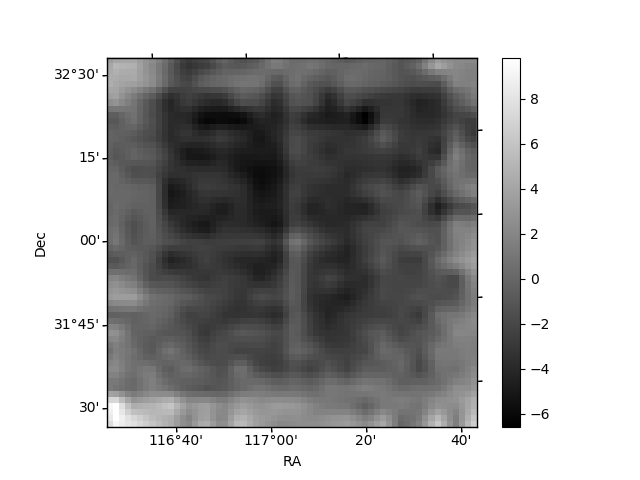
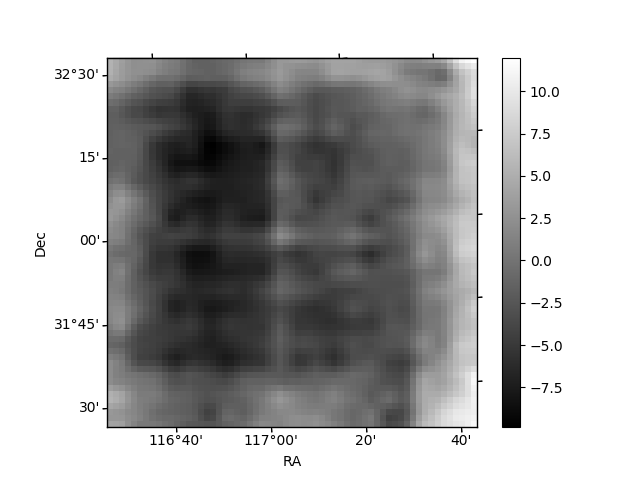
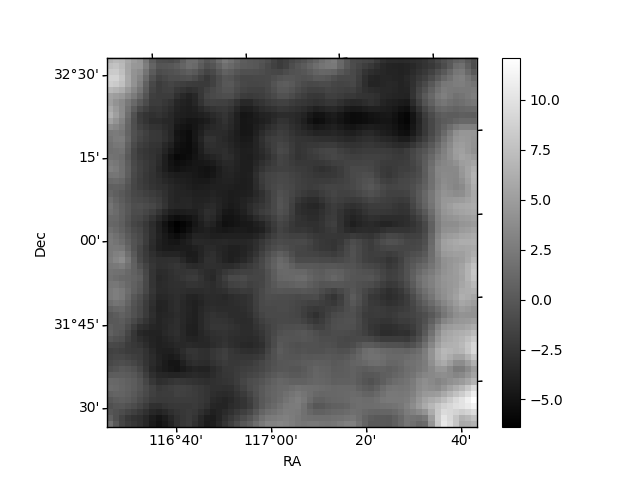
Histogram calculated using DETX and DETY for each event in the final _common_clean file
| Quadrant A | 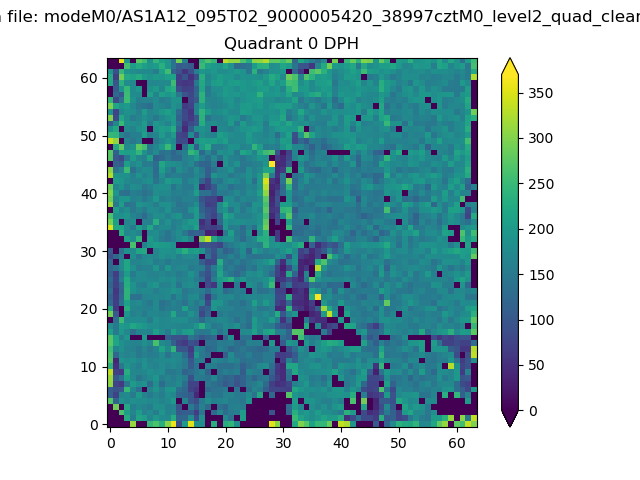 |
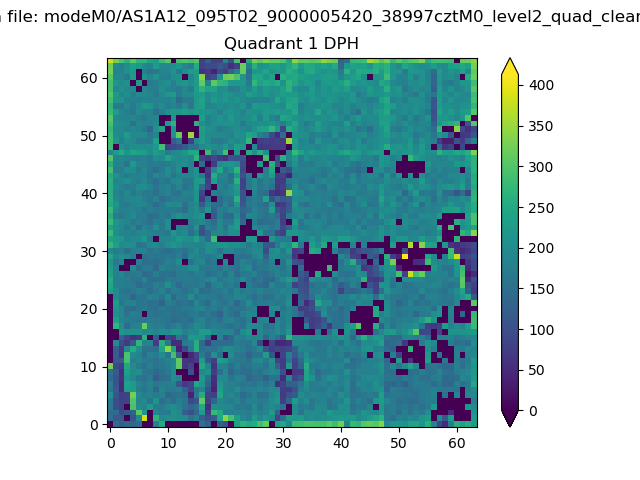 |
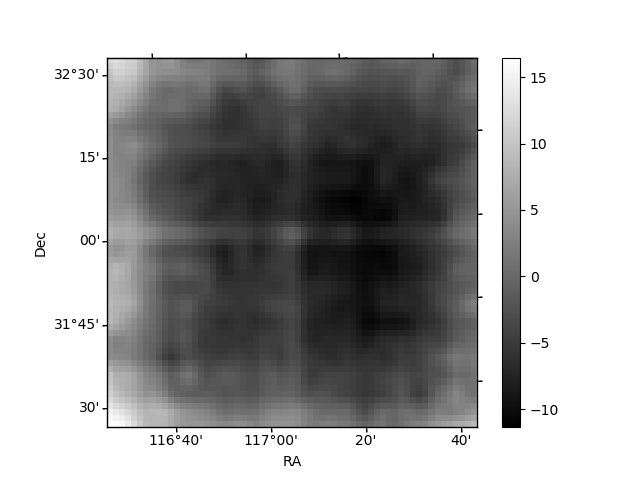
Quadrant B |
|---|---|---|---|
| Quadrant D | 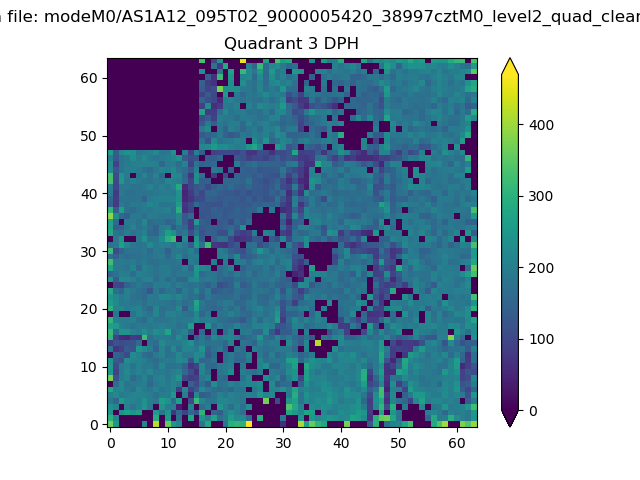 |
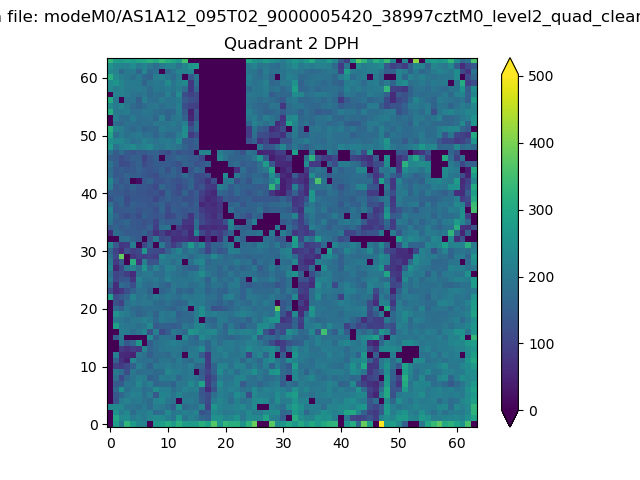 |
Quadrant C |
| Plot type | Count rate plots | Images |
|---|---|---|
| Comparison with Poisson distribution Blue bars denote a histogram of data divided into 1 sec bins. Red curve is a Poisson curve with rate = median count rate of data. |
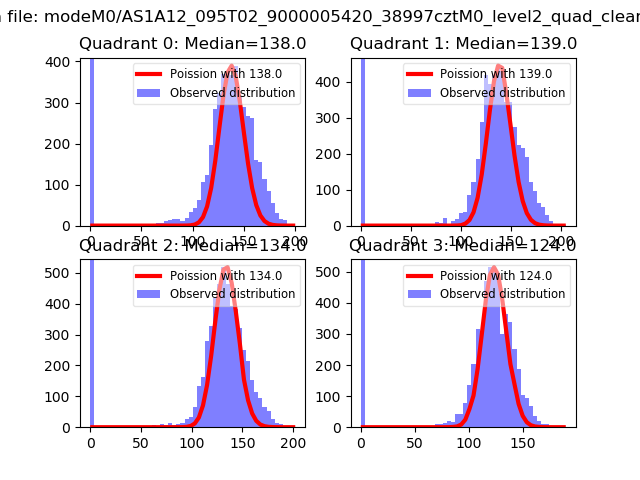 |
 |
| Quadrant-wise count rates Data is divided into 100 sec bins |
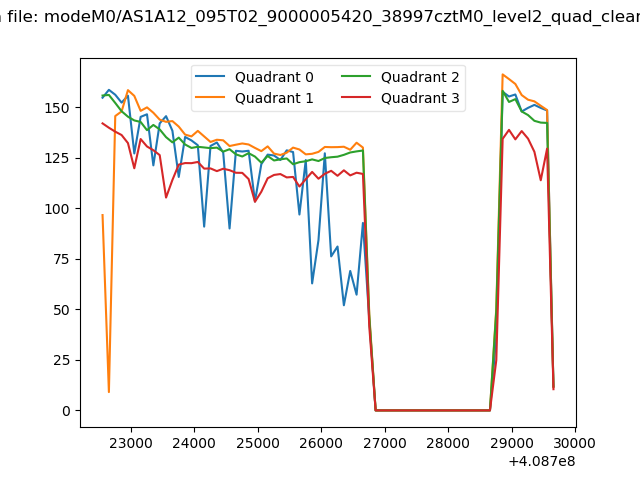 |
|
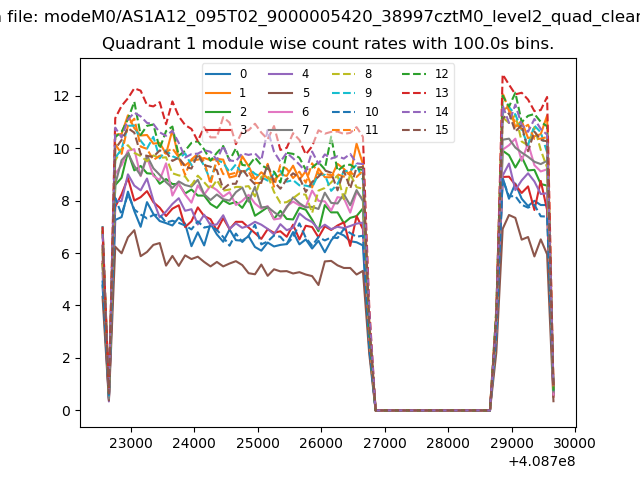
| Module-wise count rates for Quadrant A Data is divided into 100 sec bins |
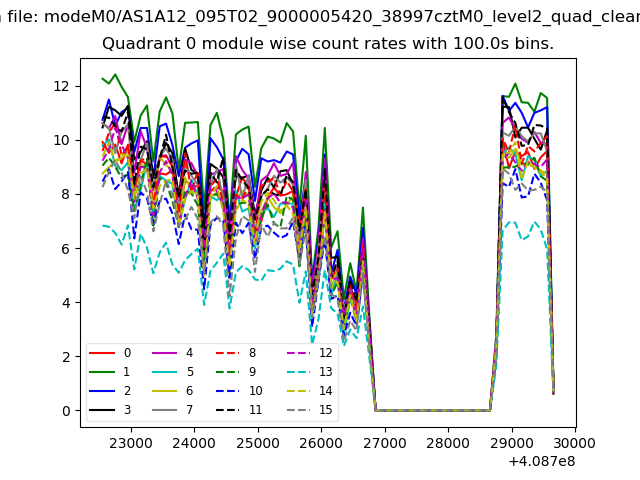 |
 |
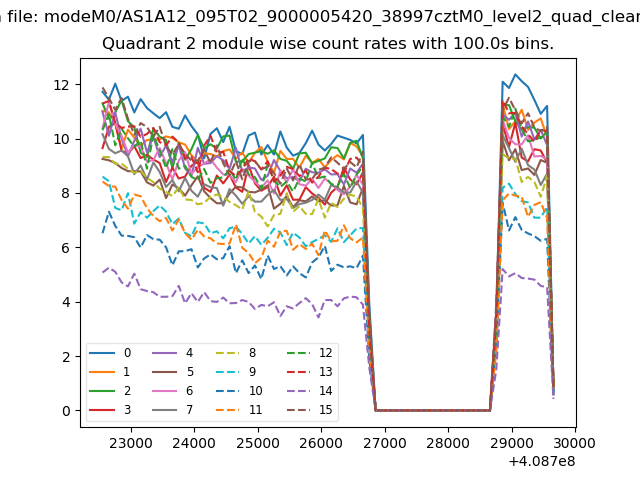
| Module-wise count rates for Quadrant B Data is divided into 100 sec bins |
 |
 |
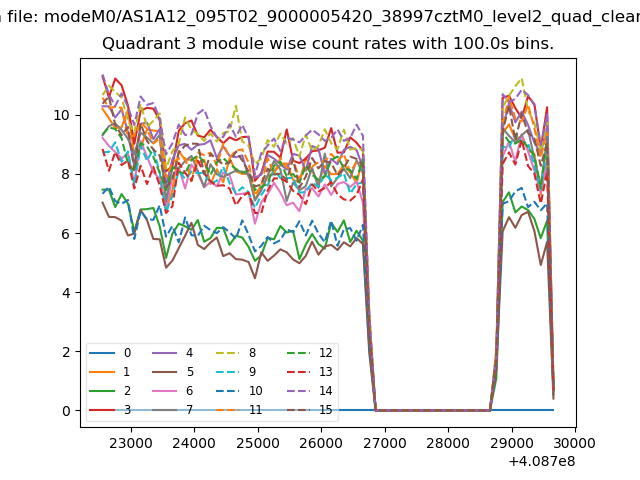
| Module-wise count rates for Quadrant C Data is divided into 100 sec bins |
 |
 |
| Module-wise count rates for Quadrant D Data is divided into 100 sec bins |
 |
 |
| Parameter | Plot |
|---|---|
| CZT HV Monitor | 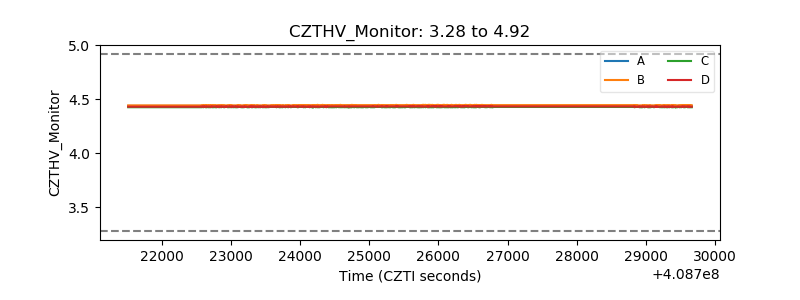 |
| D_VDD | 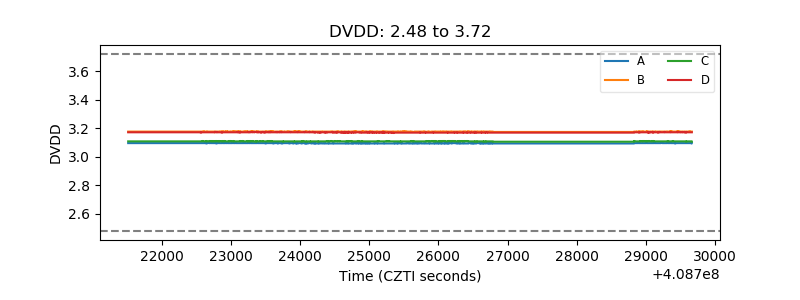 |
| Temperature 1 | 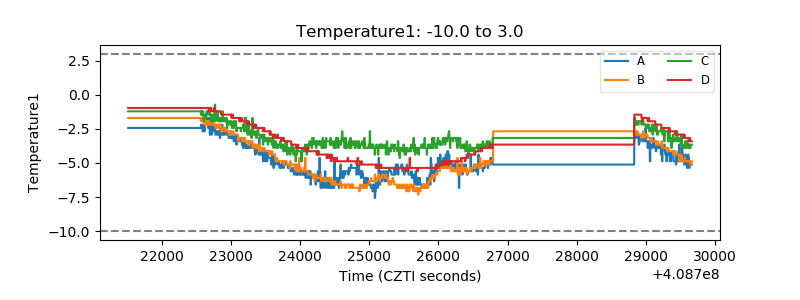 |
| Veto HV Monitor | 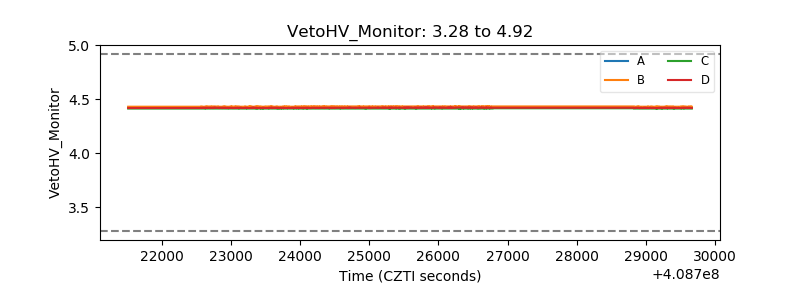 |
| Veto LLD | 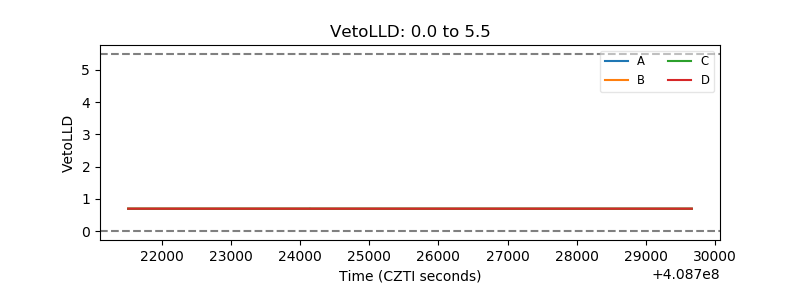 |
| Alpha Counter | 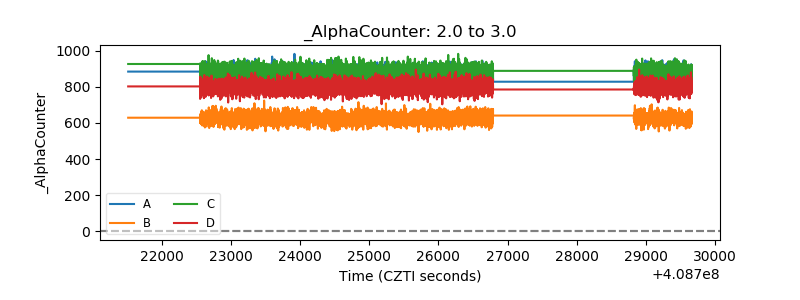 |
| _CPM_Rate | 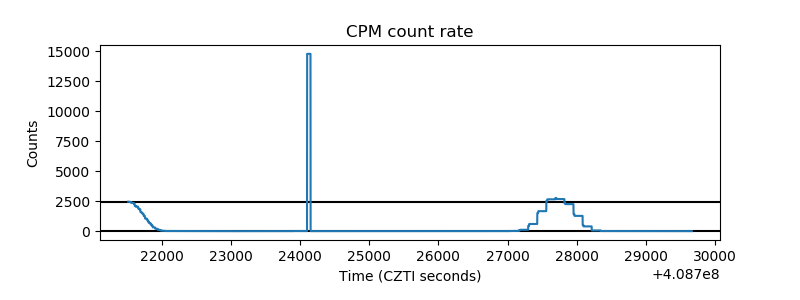 |
| CZT Counter | 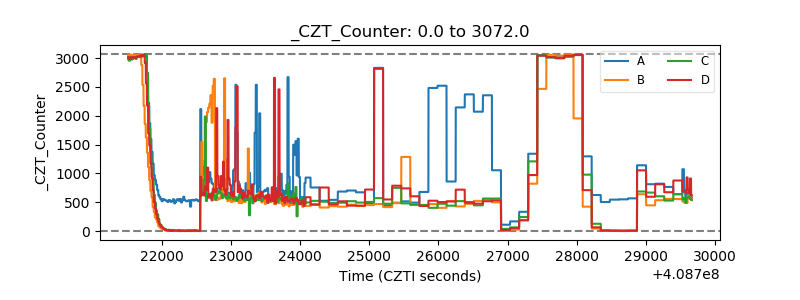 |
| +2.5 Volts monitor |  |
| +5 Volts monitor | 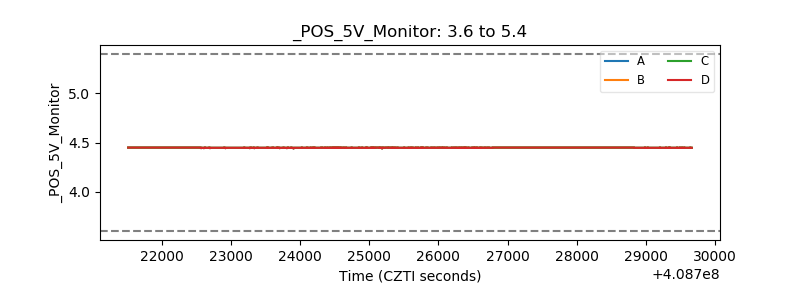 |
| _ROLL_ROT | 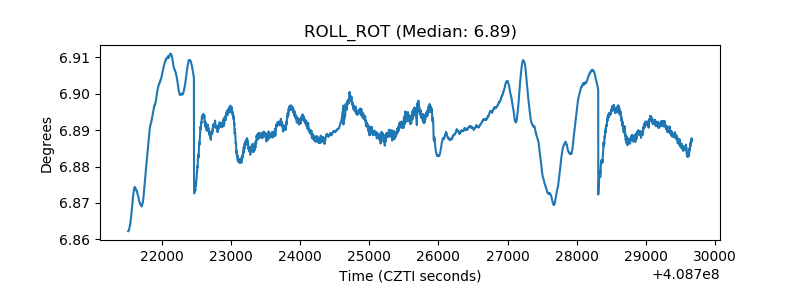 |
| _Roll_DEC | 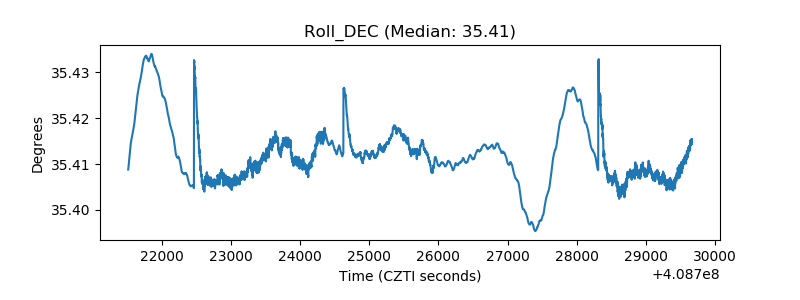 |
| _Roll_RA | 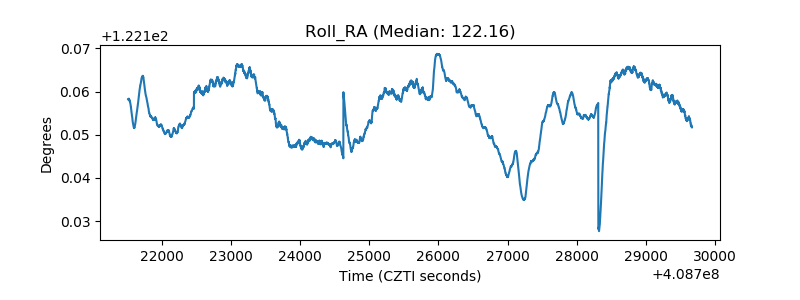 |
| Veto Counter | 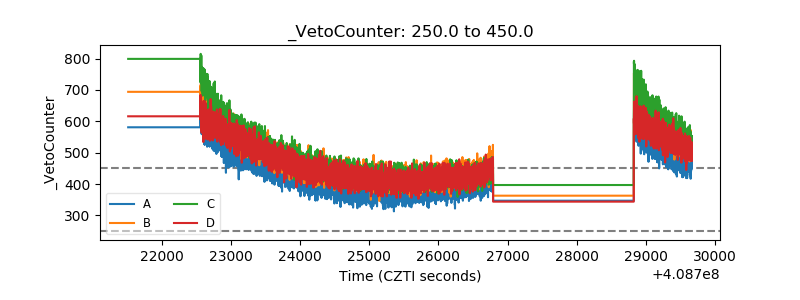 |