| Param | Original file | Final file |
|---|---|---|
| Filename | modeM0/AS1A12_061T07_9000005422cztM0_level2.fits | modeM0/AS1A12_061T07_9000005422cztM0_level2_quad_clean.evt |
| Size (bytes) | 86,880,960 | 91,808,640 |
| Size | 82.9 MB | 87.6 MB |
| Events in quadrant A | 505,020 | 537,457 |
| Events in quadrant B | 500,146 | 556,848 |
| Events in quadrant C | 513,898 | 528,888 |
| Events in quadrant D | 447,946 | 492,053 |
| Mode SS | |||
|---|---|---|---|
| Quadrant | BADHDUFLAG | Total packets | Discarded packets |
| A | 0 | 196 | 0 |
| B | 0 | 196 | 0 |
| C | 0 | 196 | 0 |
| D | 0 | 196 | 0 |
| Mode M0 | |||
|---|---|---|---|
| Quadrant | BADHDUFLAG | Total packets | Discarded packets |
| A | 0 | 28918 | 0 |
| B | 0 | 19873 | 0 |
| C | 0 | 19234 | 0 |
| D | 0 | 21154 | 0 |
| Mode M9 | |||
|---|---|---|---|
| Quadrant | BADHDUFLAG | Total packets | Discarded packets |
| A | 0 | 27 | 0 |
| B | 0 | 27 | 0 |
| C | 0 | 27 | 0 |
| D | 0 | 27 | 0 |
| Quadrant | Total seconds | Saturated seconds | Saturation percentage |
|---|---|---|---|
| A | 9583 | 416 | 4.341021% |
| B | 9583 | 51 | 0.532192% |
| C | 9583 | 2 | 0.020870% |
| D | 9583 | 49 | 0.511322% |
Noise dominated data is calculated using 1-second bins in cleaned event files. If a bin has >2000 counts, and if more than 50% of those come from <1% of pixels, then it is considered to be noise-dominated and hence unusable.
| Quadrant | # 1 sec bins | Bins with >0 counts | Bins with >2000 counts | High rate bins dominated by noise | Noise dominated (total time) | Noise dominated (detector-on time) | Marked lightcurve |
|---|---|---|---|---|---|---|---|
| A | 12299 | 9580 | 0 | 0 | 0.00% | 0.00% | 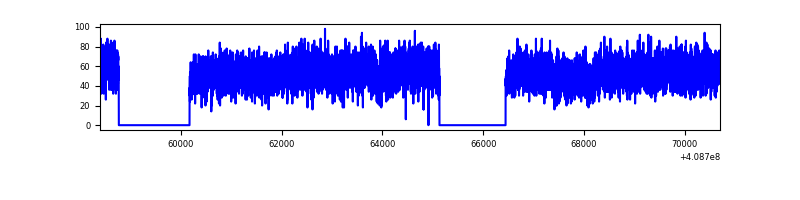 |
| B | 12300 | 9582 | 0 | 0 | 0.00% | 0.00% | 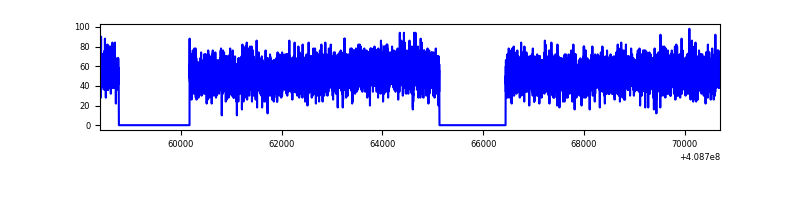 |
| C | 12300 | 9583 | 0 | 0 | 0.00% | 0.00% | 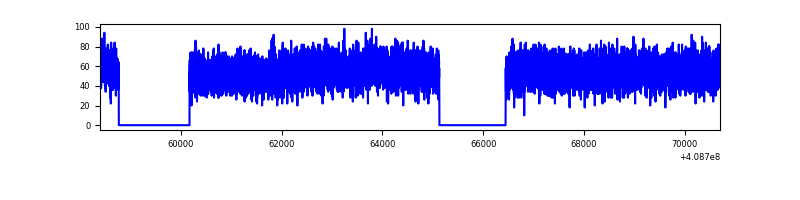 |
| D | 12300 | 9583 | 0 | 0 | 0.00% | 0.00% | 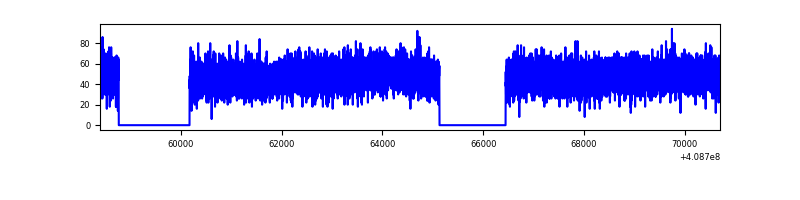 |
Top three noisy pixels from each quadrant. If the there are fewer than three noisy pixels in the level2.evt file, extra rows are filled as -1
| Pixel properties | Quadrant properties | ||||||
|---|---|---|---|---|---|---|---|
| Quadrant | DetID | PixID | Counts | Sigma | Mean | Median | Sigma |
| A | 9 | 19 | 442 | 8.88 | 132 | 123 | 35.9 |
| A | 7 | 110 | 430 | 8.55 | 132 | 123 | 35.9 |
| A | 0 | 30 | 410 | 7.99 | 132 | 123 | 35.9 |
| B | 2 | 9 | 444 | 11.12 | 132 | 126 | 28.6 |
| B | 2 | 8 | 403 | 9.69 | 132 | 126 | 28.6 |
| B | 5 | 128 | 382 | 8.95 | 132 | 126 | 28.6 |
| C | 1 | 81 | 450 | 8.91 | 135 | 127 | 36.3 |
| C | 1 | 80 | 398 | 7.48 | 135 | 127 | 36.3 |
| C | 3 | 203 | 395 | 7.39 | 135 | 127 | 36.3 |
| D | 6 | 38 | 365 | 7.01 | 127 | 117 | 35.4 |
| D | 7 | 3 | 340 | 6.31 | 127 | 117 | 35.4 |
| D | 10 | 189 | 337 | 6.22 | 127 | 117 | 35.4 |
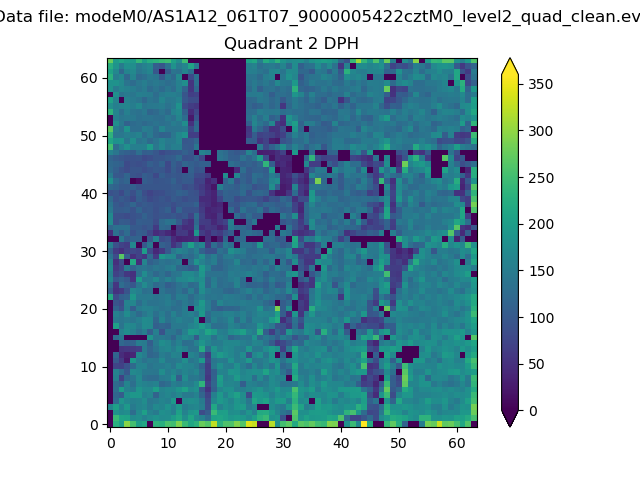
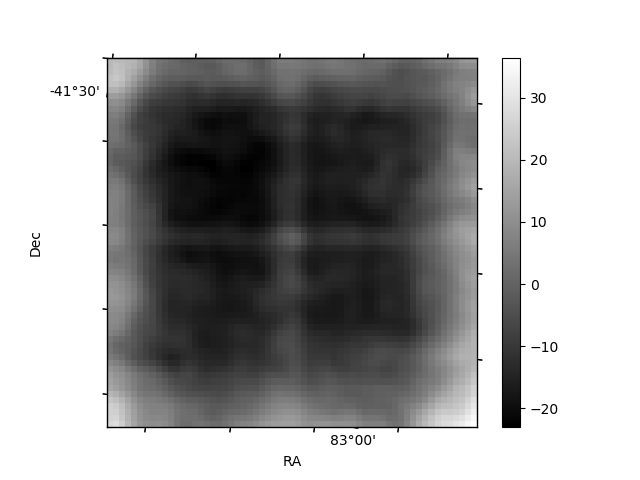
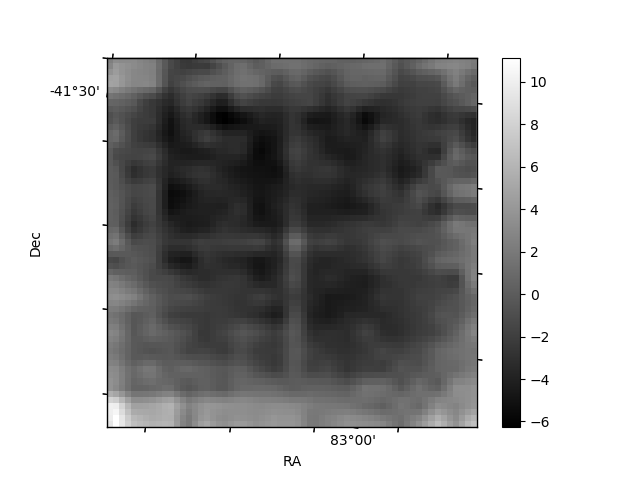
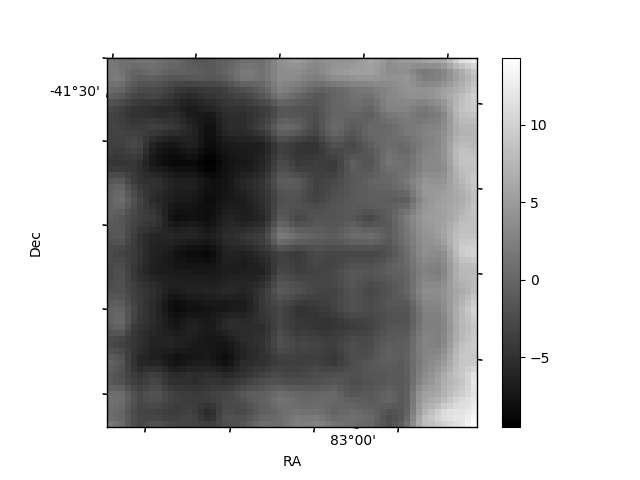
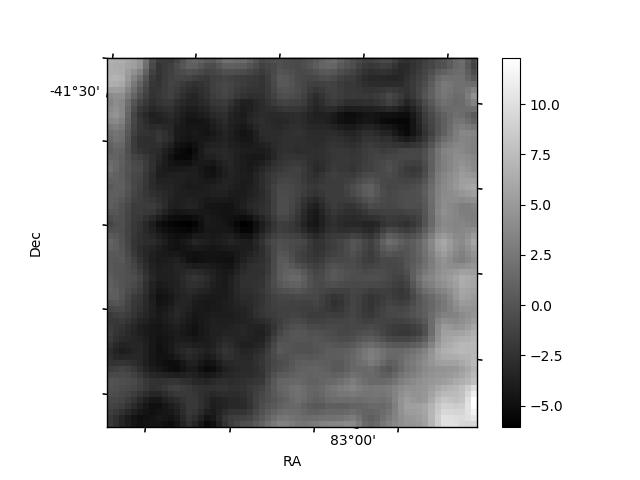
Histogram calculated using DETX and DETY for each event in the final _common_clean file
| Quadrant A | 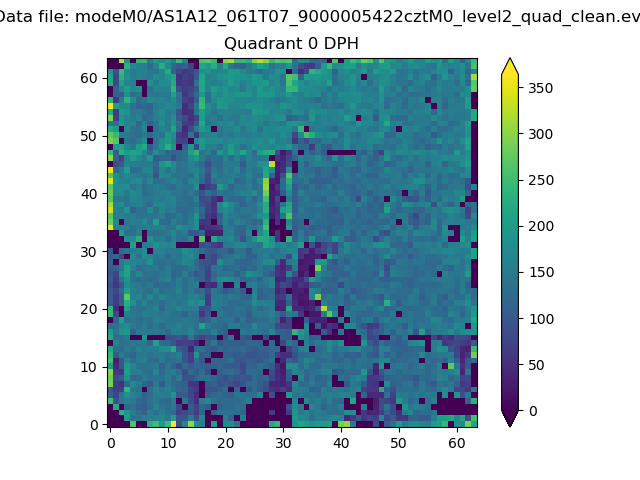 |
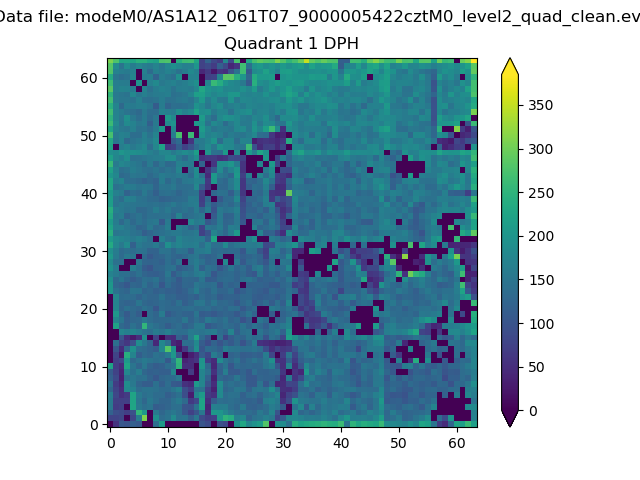 |
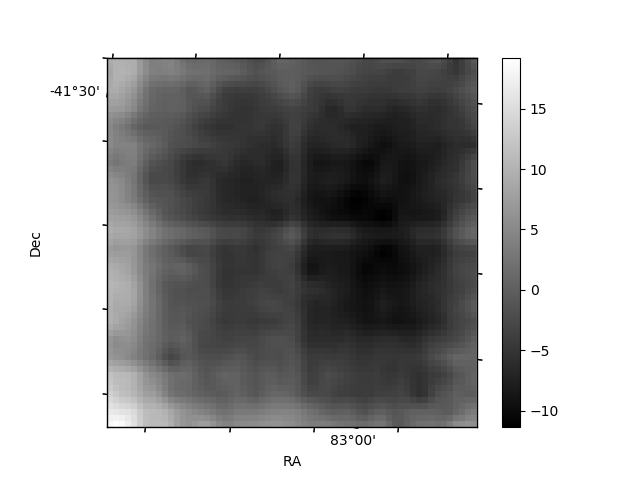
Quadrant B |
|---|---|---|---|
| Quadrant D | 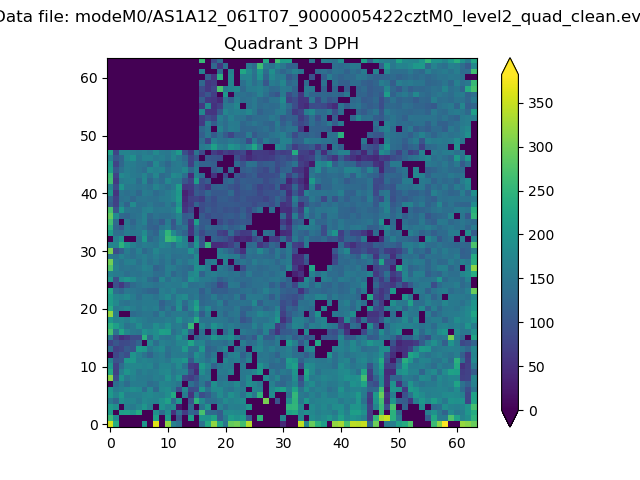 |
 |
Quadrant C |
| Plot type | Count rate plots | Images |
|---|---|---|
| Comparison with Poisson distribution Blue bars denote a histogram of data divided into 1 sec bins. Red curve is a Poisson curve with rate = median count rate of data. |
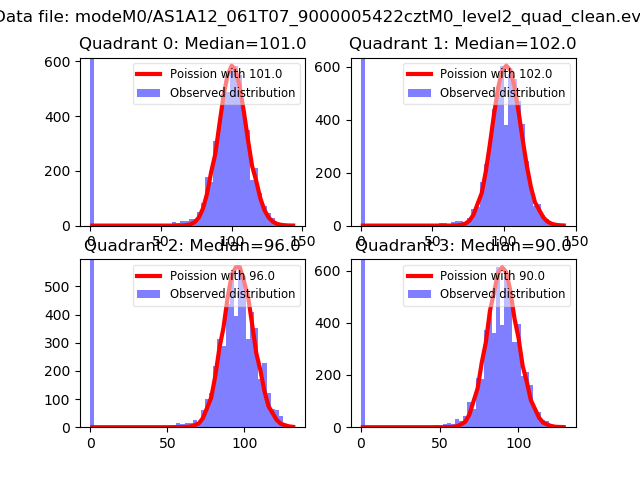 |
 |
| Quadrant-wise count rates Data is divided into 100 sec bins |
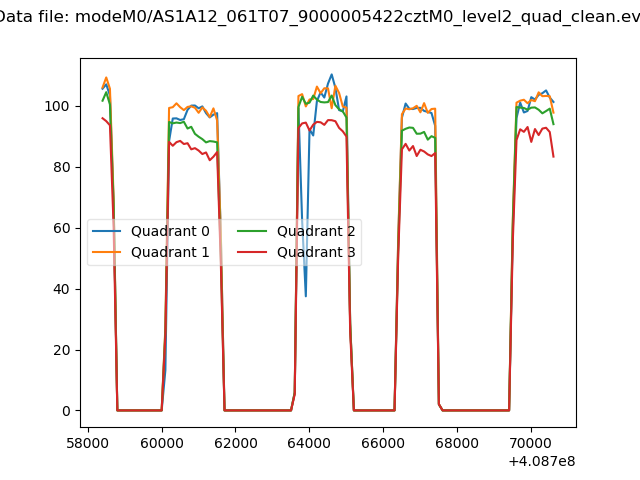 |
|
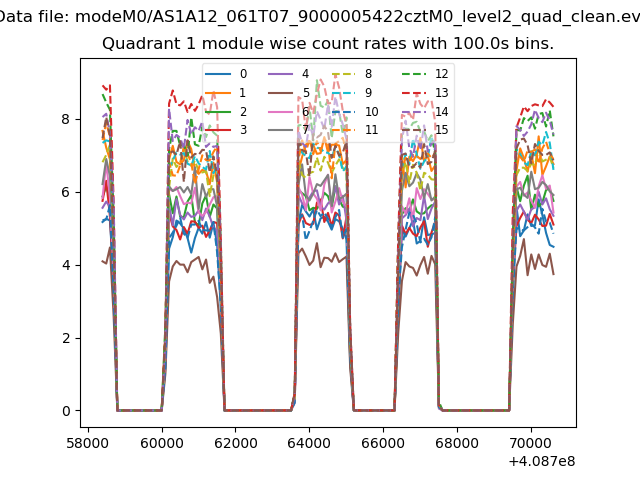
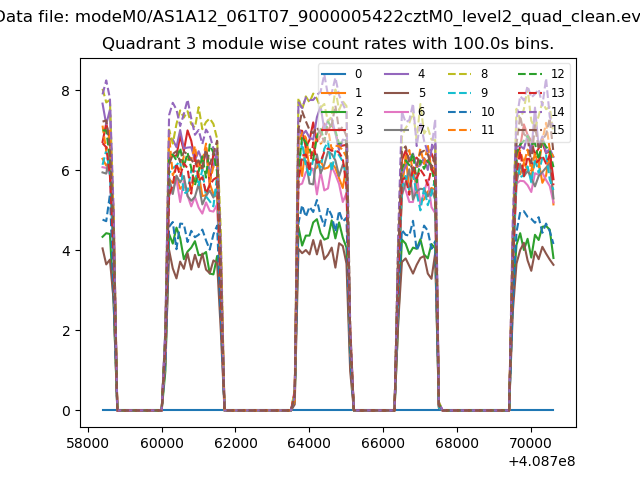
| Module-wise count rates for Quadrant A Data is divided into 100 sec bins |
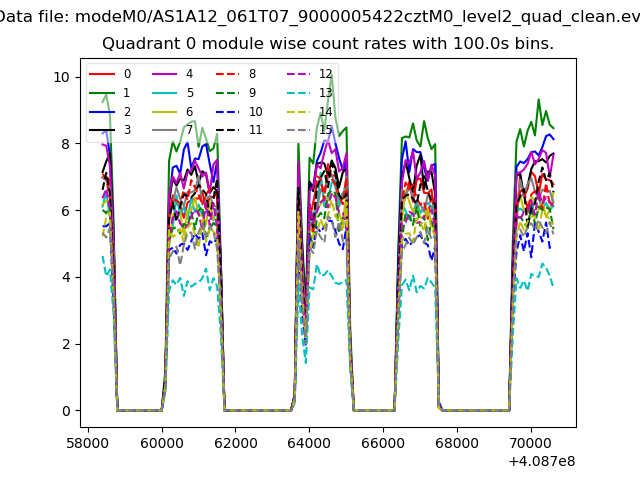 |
 |
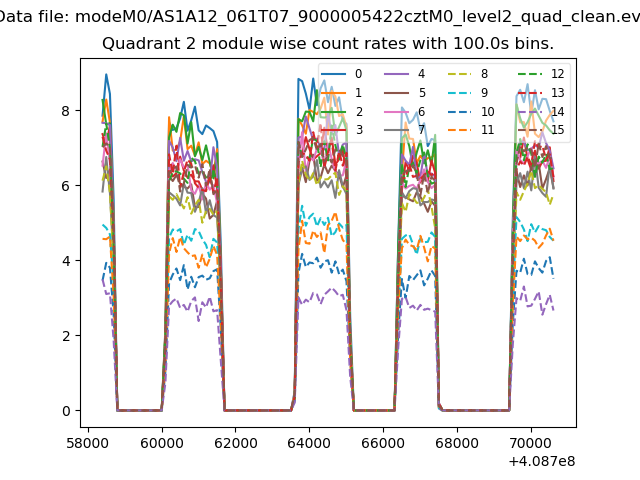
| Module-wise count rates for Quadrant B Data is divided into 100 sec bins |
 |
 |
| Module-wise count rates for Quadrant C Data is divided into 100 sec bins |
 |
 |
| Module-wise count rates for Quadrant D Data is divided into 100 sec bins |
 |
 |
| Parameter | Plot |
|---|---|
| CZT HV Monitor | 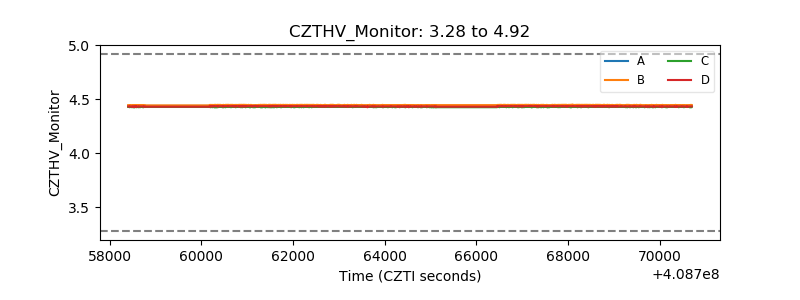 |
| D_VDD | 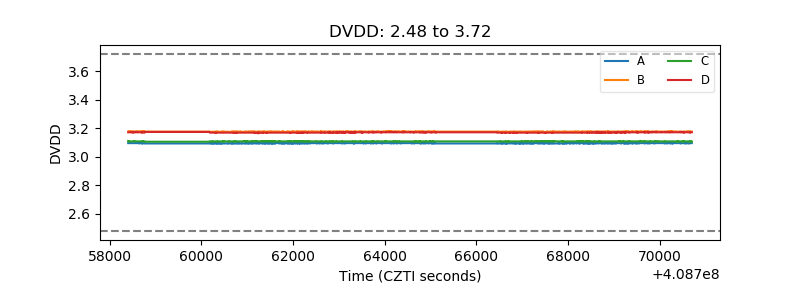 |
| Temperature 1 | 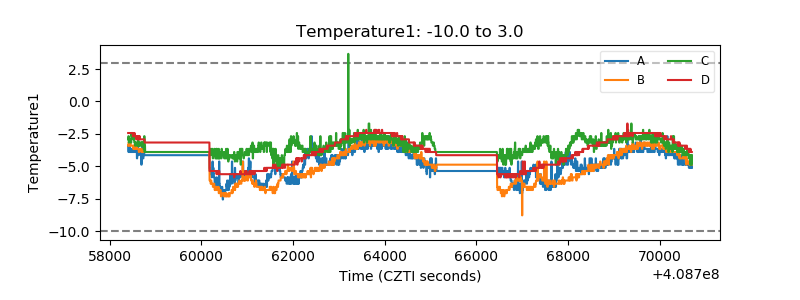 |
| Veto HV Monitor | 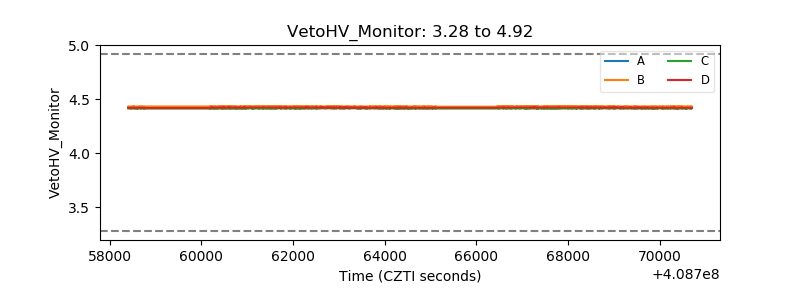 |
| Veto LLD | 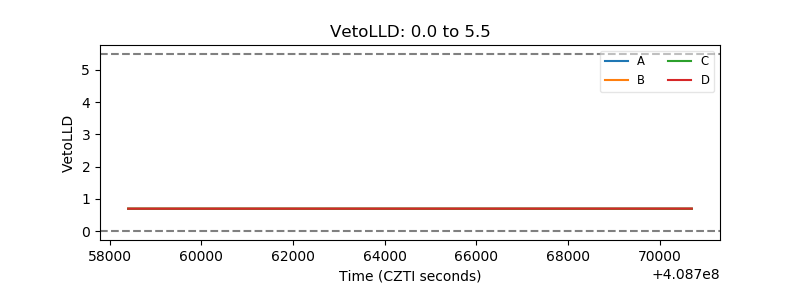 |
| Alpha Counter | 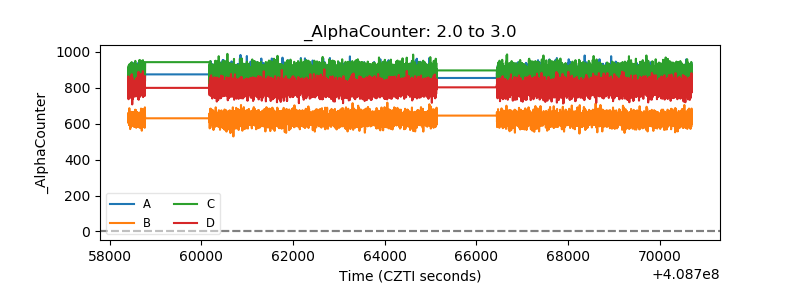 |
| _CPM_Rate | 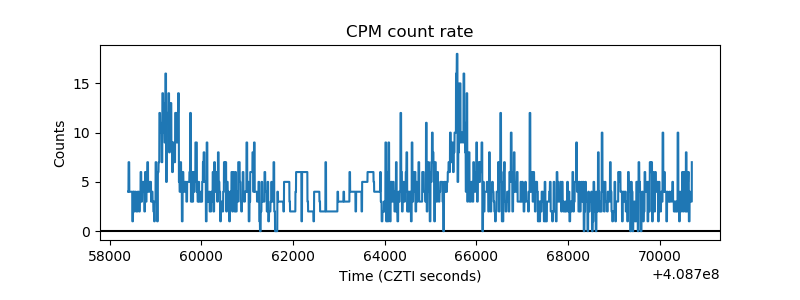 |
| CZT Counter | 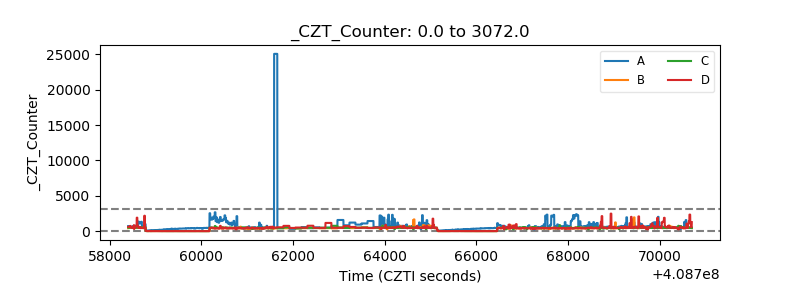 |
| +2.5 Volts monitor | 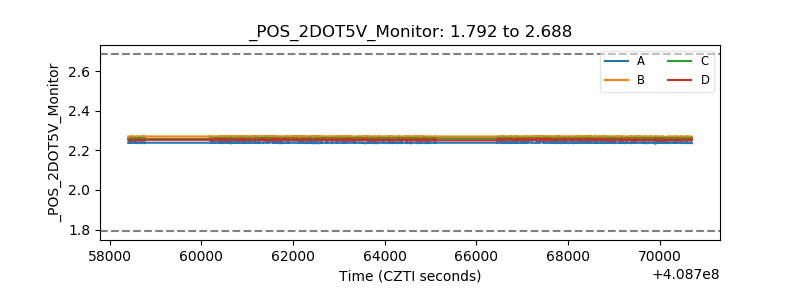 |
| +5 Volts monitor | 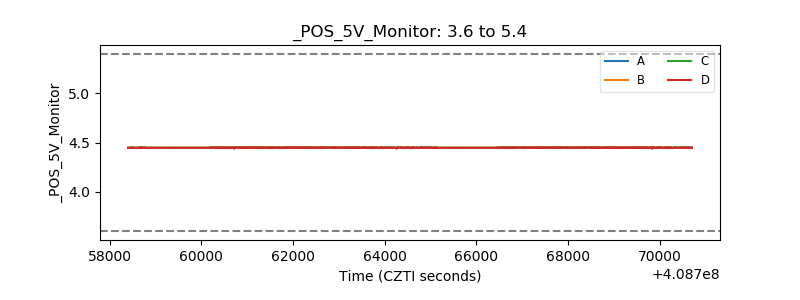 |
| _ROLL_ROT | 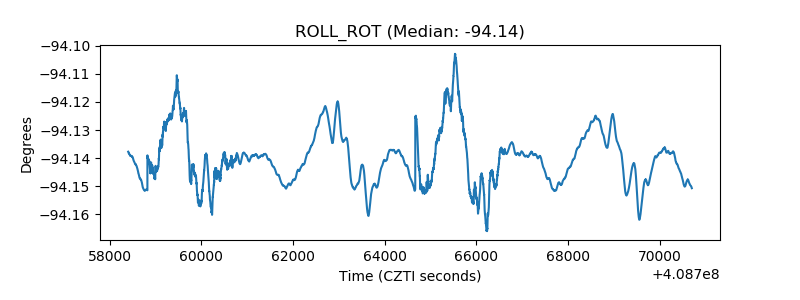 |
| _Roll_DEC | 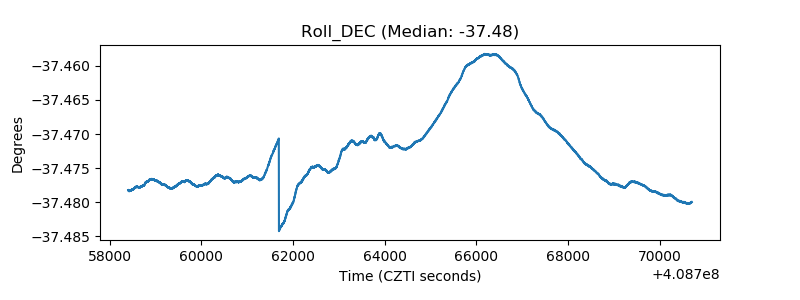 |
| _Roll_RA | 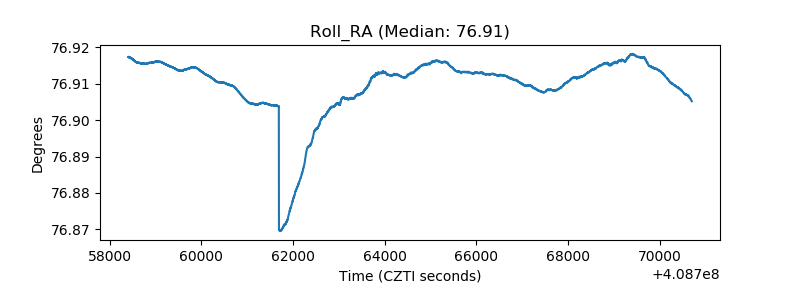 |
| Veto Counter | 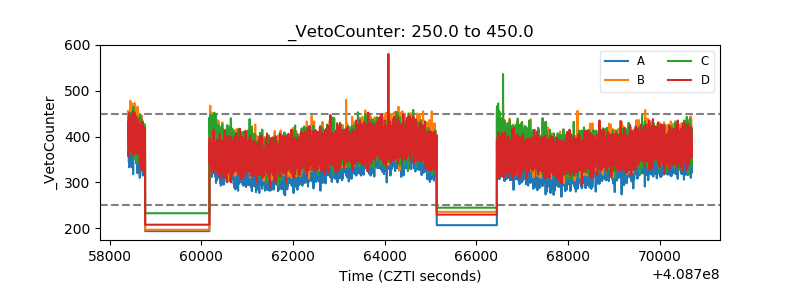 |