| Param | Original file | Final file |
|---|---|---|
| Filename | modeM0/AS1A12_061T07_9000005422_39002cztM0_level2.fits | modeM0/AS1A12_061T07_9000005422_39002cztM0_level2_quad_clean.evt |
| Size (bytes) | 88,704,000 | 22,377,600 |
| Size | 84.6 MB | 21.3 MB |
| Events in quadrant A | 1,328,919 | 148,480 |
| Events in quadrant B | 590,065 | 152,396 |
| Events in quadrant C | 616,659 | 144,251 |
| Events in quadrant D | 643,372 | 134,781 |
| Mode SS | |||
|---|---|---|---|
| Quadrant | BADHDUFLAG | Total packets | Discarded packets |
| A | 0 | 28 | 0 |
| B | 0 | 28 | 0 |
| C | 0 | 28 | 0 |
| D | 0 | 28 | 0 |
| Mode M0 | |||
|---|---|---|---|
| Quadrant | BADHDUFLAG | Total packets | Discarded packets |
| A | 0 | 4860 | 2 |
| B | 0 | 2640 | 1 |
| C | 0 | 2624 | 1 |
| D | 0 | 2808 | 1 |
| Mode M9 | |||
|---|---|---|---|
| Quadrant | BADHDUFLAG | Total packets | Discarded packets |
| A | 0 | 14 | 0 |
| B | 0 | 14 | 0 |
| C | 0 | 14 | 0 |
| D | 0 | 14 | 0 |
| Quadrant | Total seconds | Saturated seconds | Saturation percentage |
|---|---|---|---|
| A | 1306 | 47 | 3.598775% |
| B | 1306 | 2 | 0.153139% |
| C | 1306 | 1 | 0.076570% |
| D | 1306 | 12 | 0.918836% |
Noise dominated data is calculated using 1-second bins in cleaned event files. If a bin has >2000 counts, and if more than 50% of those come from <1% of pixels, then it is considered to be noise-dominated and hence unusable.
| Quadrant | # 1 sec bins | Bins with >0 counts | Bins with >2000 counts | High rate bins dominated by noise | Noise dominated (total time) | Noise dominated (detector-on time) | Marked lightcurve |
|---|---|---|---|---|---|---|---|
| A | 2710 | 1307 | 68 | 68 | 2.51% | 5.20% | 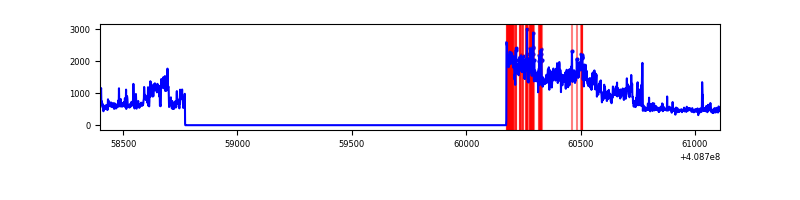 |
| B | 2710 | 1307 | 0 | 0 | 0.00% | 0.00% |  |
| C | 2710 | 1307 | 0 | 0 | 0.00% | 0.00% |  |
| D | 2710 | 1307 | 9 | 9 | 0.33% | 0.69% |  |
Top three noisy pixels from each quadrant. If the there are fewer than three noisy pixels in the level2.evt file, extra rows are filled as -1
| Pixel properties | Quadrant properties | ||||||
|---|---|---|---|---|---|---|---|
| Quadrant | DetID | PixID | Counts | Sigma | Mean | Median | Sigma |
| A | 15 | 222 | 574241 | 18217.42 | 145 | 142 | 31.5 |
| A | 10 | 83 | 140637 | 4458.21 | 145 | 142 | 31.5 |
| A | 13 | 248 | 45209 | 1430.07 | 145 | 142 | 31.5 |
| B | 0 | 230 | 8826 | 284.24 | 146 | 142 | 30.6 |
| B | 12 | 111 | 3591 | 112.89 | 146 | 142 | 30.6 |
| B | 11 | 111 | 3338 | 104.61 | 146 | 142 | 30.6 |
| C | 15 | 214 | 57769 | 1629.0 | 142 | 143 | 35.4 |
| C | 15 | 159 | 1512 | 38.7 | 142 | 143 | 35.4 |
| C | 15 | 208 | 1038 | 25.3 | 142 | 143 | 35.4 |
| D | 12 | 235 | 42038 | 1165.97 | 141 | 136 | 35.9 |
| D | 2 | 153 | 39009 | 1081.68 | 141 | 136 | 35.9 |
| D | 2 | 250 | 8317 | 227.65 | 141 | 136 | 35.9 |
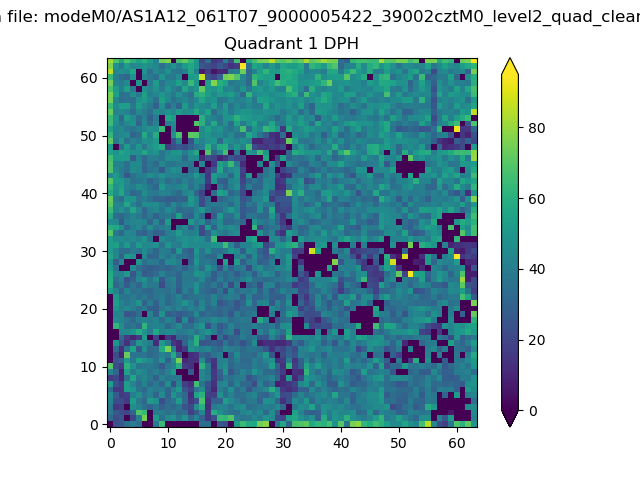
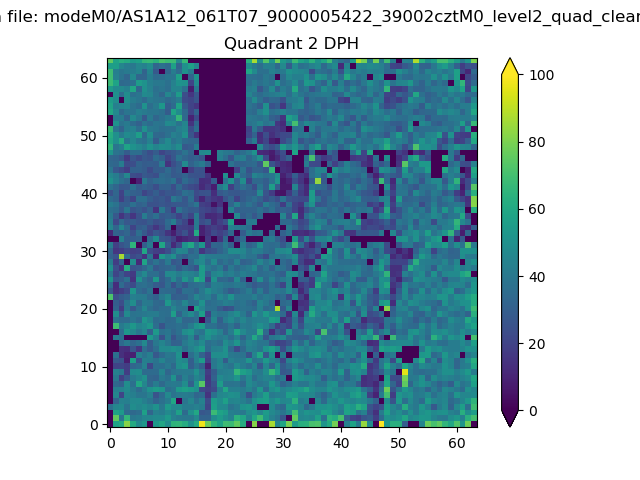
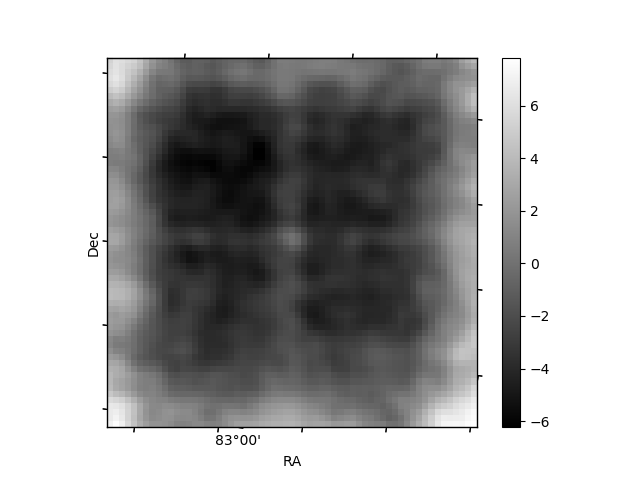
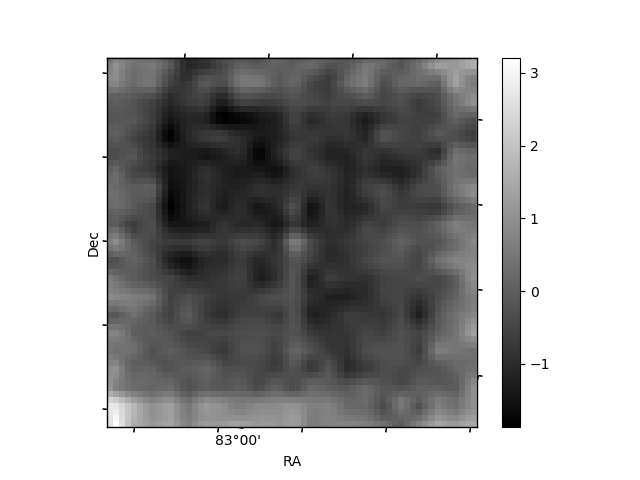
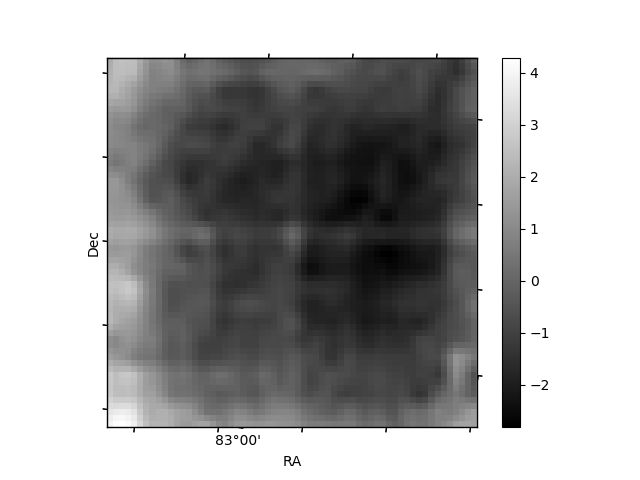
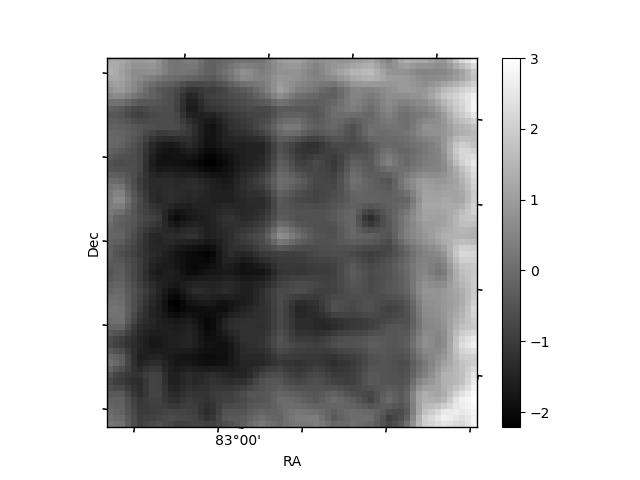
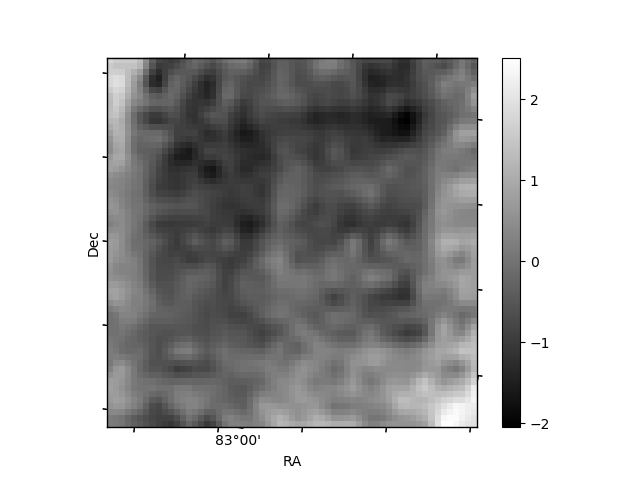
Histogram calculated using DETX and DETY for each event in the final _common_clean file
| Quadrant A |  |
 |
Quadrant B |
|---|---|---|---|
| Quadrant D | 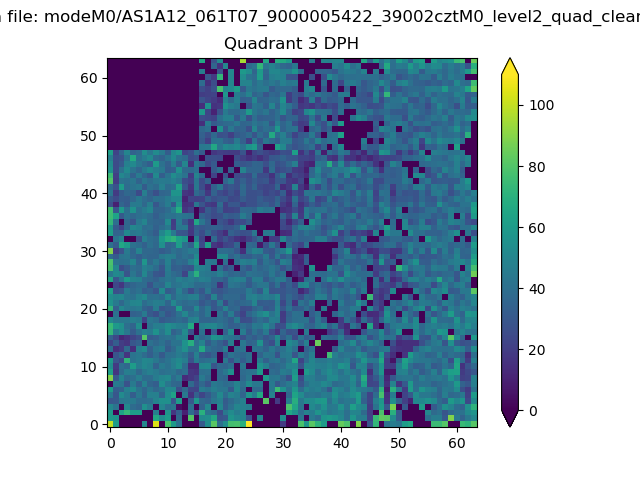 |
 |
Quadrant C |
| Plot type | Count rate plots | Images |
|---|---|---|
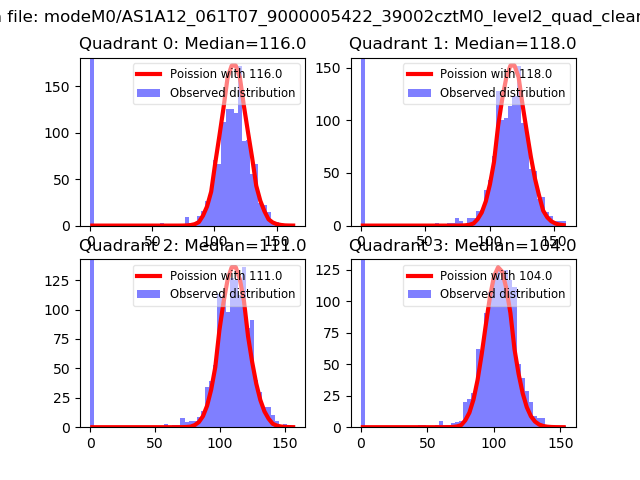
| Comparison with Poisson distribution Blue bars denote a histogram of data divided into 1 sec bins. Red curve is a Poisson curve with rate = median count rate of data. |
 |
 |
| Quadrant-wise count rates Data is divided into 100 sec bins |
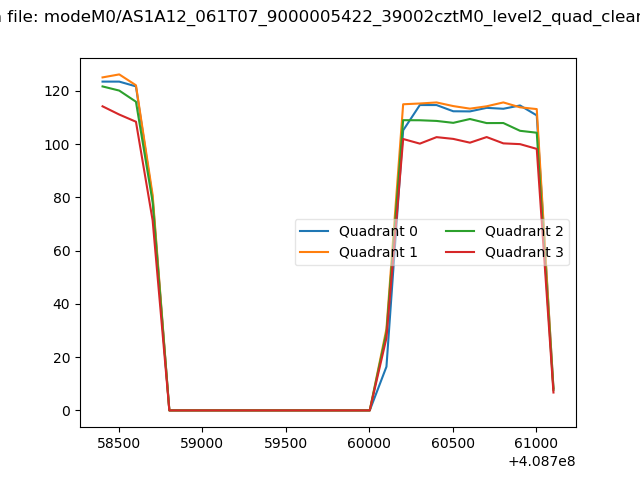 |
|
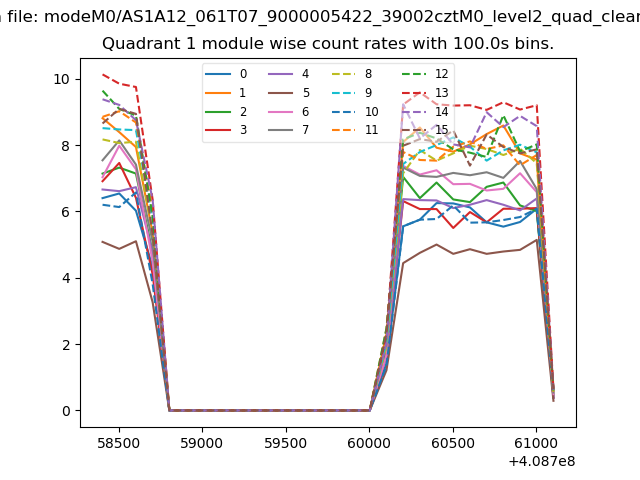
| Module-wise count rates for Quadrant A Data is divided into 100 sec bins |
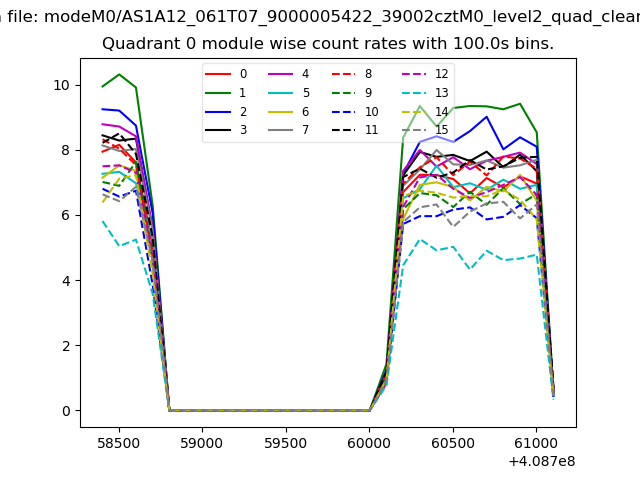 |
 |
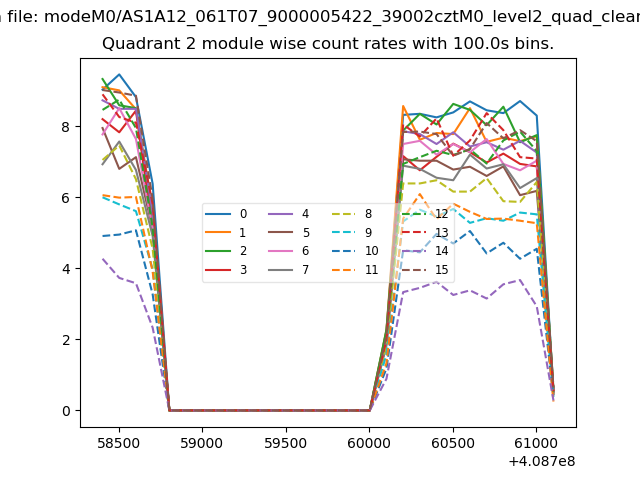
| Module-wise count rates for Quadrant B Data is divided into 100 sec bins |
 |
 |
| Module-wise count rates for Quadrant C Data is divided into 100 sec bins |
 |
 |
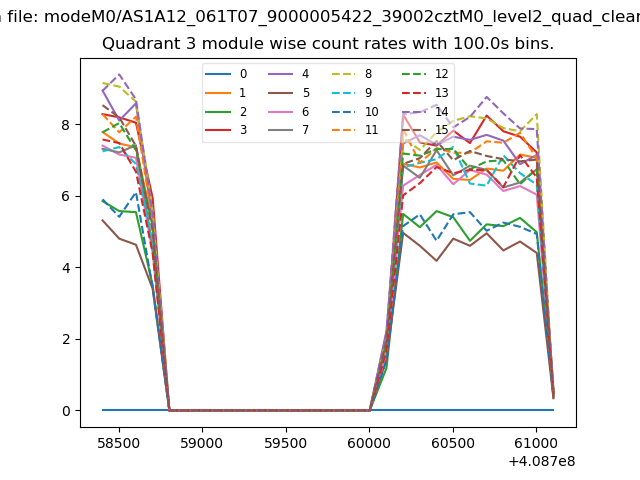
| Module-wise count rates for Quadrant D Data is divided into 100 sec bins |
 |
 |
| Parameter | Plot |
|---|---|
| CZT HV Monitor | 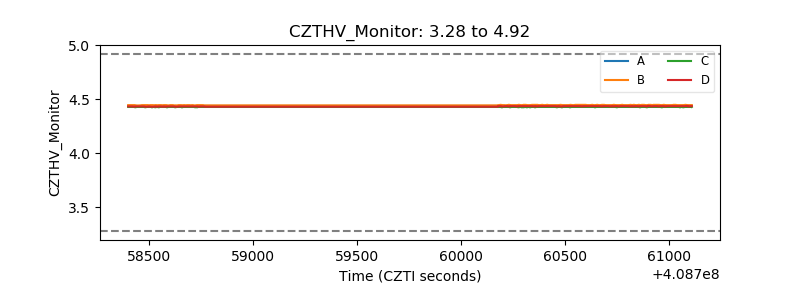 |
| D_VDD | 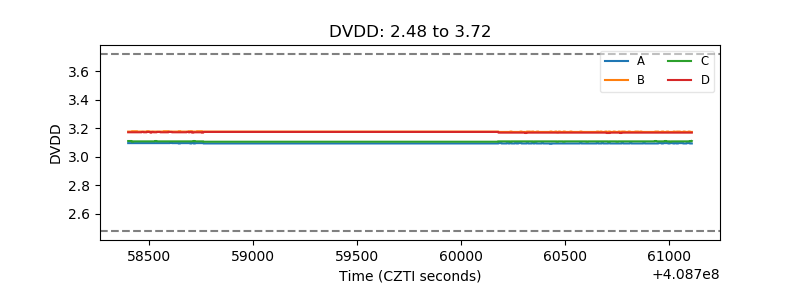 |
| Temperature 1 | 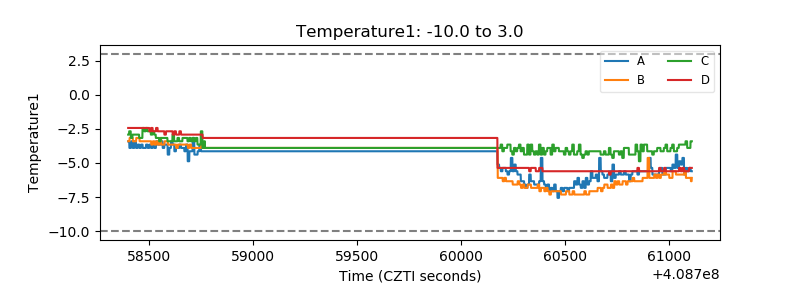 |
| Veto HV Monitor | 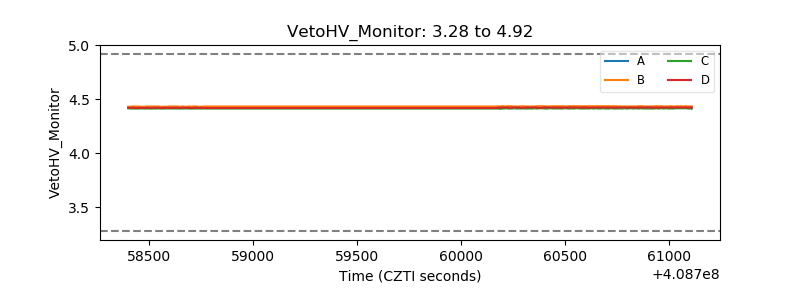 |
| Veto LLD | 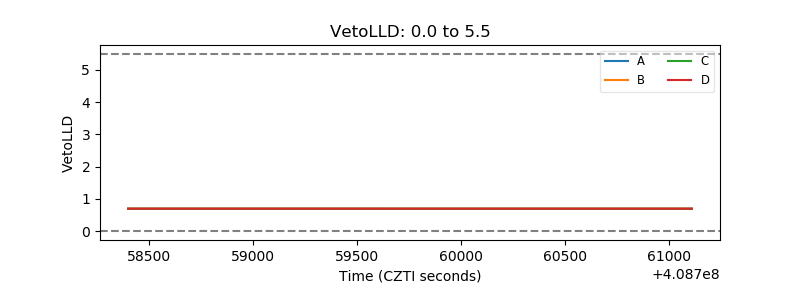 |
| Alpha Counter | 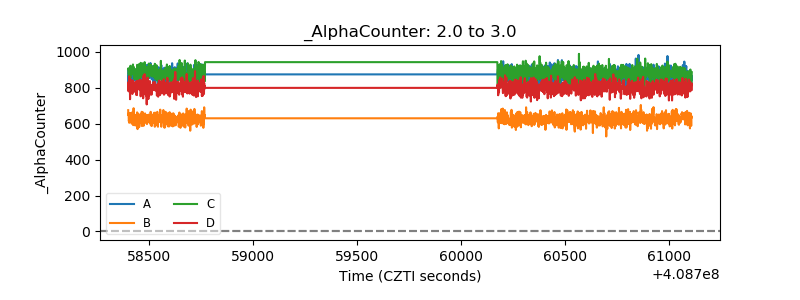 |
| _CPM_Rate | 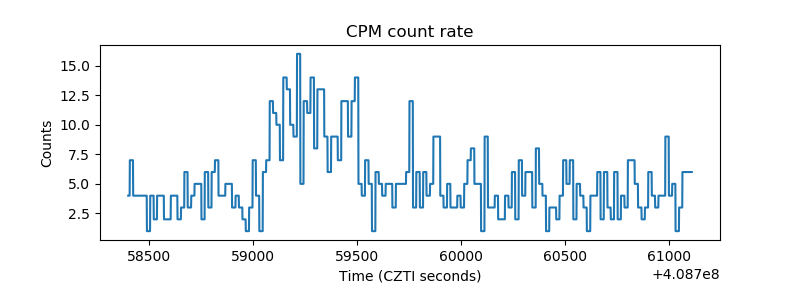 |
| CZT Counter | 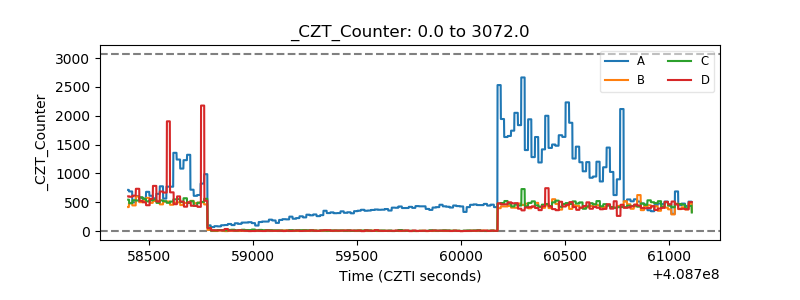 |
| +2.5 Volts monitor | 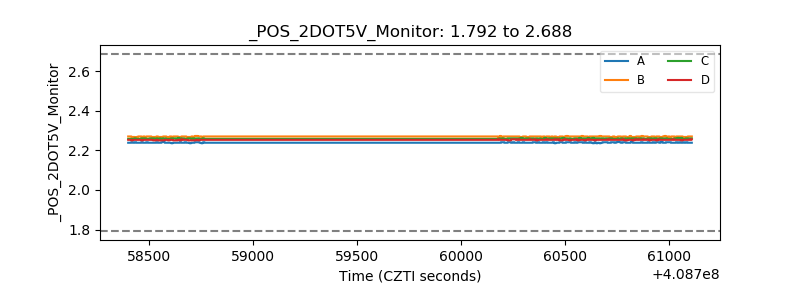 |
| +5 Volts monitor | 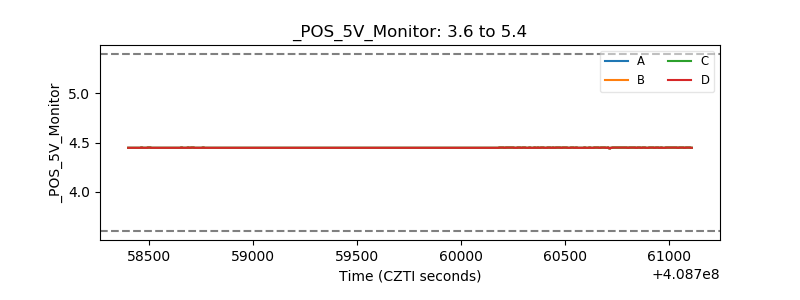 |
| _ROLL_ROT | 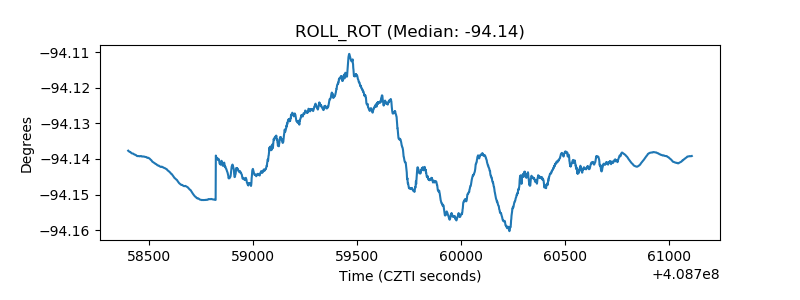 |
| _Roll_DEC | 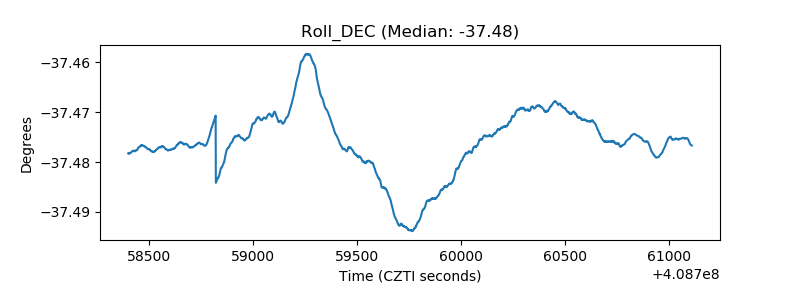 |
| _Roll_RA | 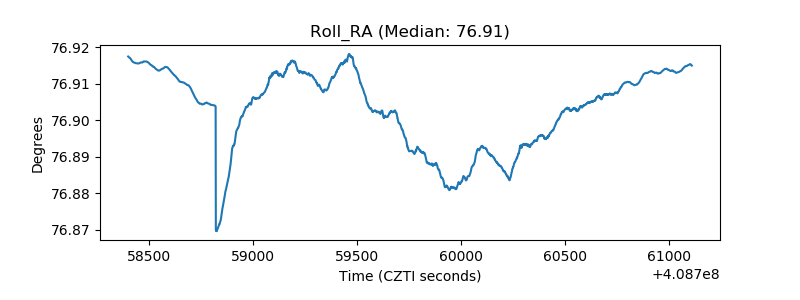 |
| Veto Counter | 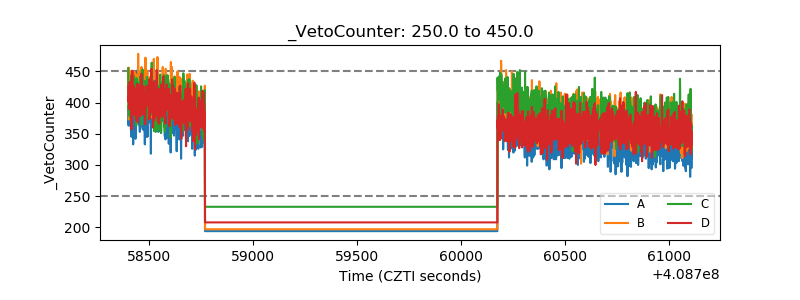 |