| Param | Original file | Final file |
|---|---|---|
| Filename | modeM0/AS1A12_061T07_9000005422_39003cztM0_level2.fits | modeM0/AS1A12_061T07_9000005422_39003cztM0_level2_quad_clean.evt |
| Size (bytes) | 372,176,640 | 98,815,680 |
| Size | 354.9 MB | 94.2 MB |
| Events in quadrant A | 4,718,831 | 645,857 |
| Events in quadrant B | 2,789,267 | 681,333 |
| Events in quadrant C | 2,804,920 | 648,343 |
| Events in quadrant D | 3,001,616 | 601,654 |
| Mode SS | |||
|---|---|---|---|
| Quadrant | BADHDUFLAG | Total packets | Discarded packets |
| A | 0 | 122 | 0 |
| B | 0 | 122 | 0 |
| C | 0 | 122 | 0 |
| D | 0 | 122 | 0 |
| Mode M0 | |||
|---|---|---|---|
| Quadrant | BADHDUFLAG | Total packets | Discarded packets |
| A | 0 | 17881 | 3 |
| B | 0 | 12321 | 2 |
| C | 0 | 11916 | 2 |
| D | 0 | 12854 | 2 |
| Mode M9 | |||
|---|---|---|---|
| Quadrant | BADHDUFLAG | Total packets | Discarded packets |
| A | 0 | 23 | 0 |
| B | 0 | 23 | 0 |
| C | 0 | 23 | 0 |
| D | 0 | 24 | 0 |
| Quadrant | Total seconds | Saturated seconds | Saturation percentage |
|---|---|---|---|
| A | 5937 | 246 | 4.143507% |
| B | 5937 | 32 | 0.538993% |
| C | 5937 | 2 | 0.033687% |
| D | 5937 | 16 | 0.269496% |
Noise dominated data is calculated using 1-second bins in cleaned event files. If a bin has >2000 counts, and if more than 50% of those come from <1% of pixels, then it is considered to be noise-dominated and hence unusable.
| Quadrant | # 1 sec bins | Bins with >0 counts | Bins with >2000 counts | High rate bins dominated by noise | Noise dominated (total time) | Noise dominated (detector-on time) | Marked lightcurve |
|---|---|---|---|---|---|---|---|
| A | 7250 | 5938 | 206 | 206 | 2.84% | 3.47% | 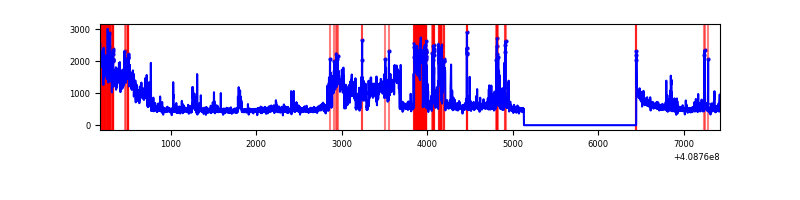 |
| B | 7250 | 5938 | 9 | 9 | 0.12% | 0.15% | 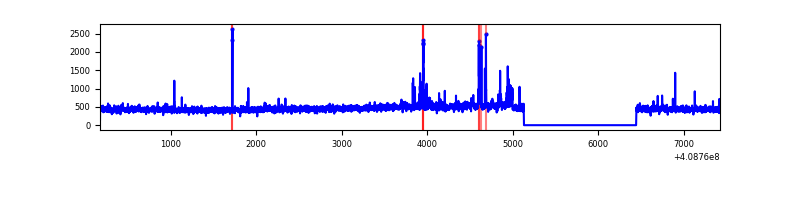 |
| C | 7250 | 5938 | 0 | 0 | 0.00% | 0.00% | 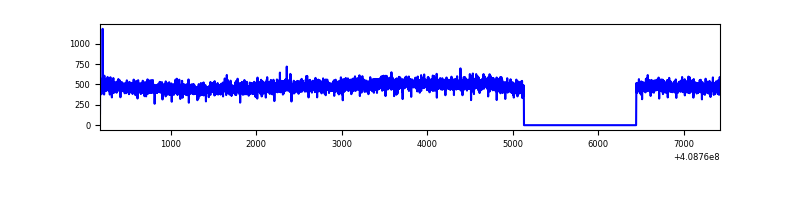 |
| D | 7250 | 5938 | 15 | 15 | 0.21% | 0.25% | 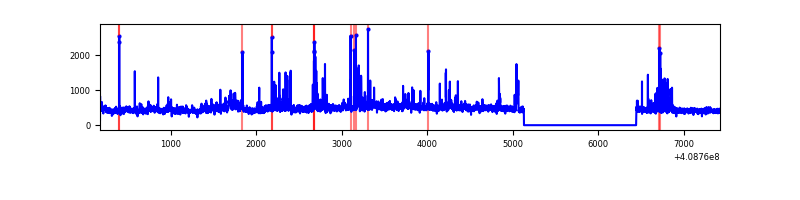 |
Top three noisy pixels from each quadrant. If the there are fewer than three noisy pixels in the level2.evt file, extra rows are filled as -1
| Pixel properties | Quadrant properties | ||||||
|---|---|---|---|---|---|---|---|
| Quadrant | DetID | PixID | Counts | Sigma | Mean | Median | Sigma |
| A | 15 | 222 | 1489154 | 11015.76 | 659 | 645 | 135.1 |
| A | 10 | 83 | 441169 | 3260.11 | 659 | 645 | 135.1 |
| A | 13 | 248 | 155136 | 1143.32 | 659 | 645 | 135.1 |
| B | 5 | 172 | 125562 | 972.42 | 663 | 643 | 128.5 |
| B | 0 | 230 | 48805 | 374.91 | 663 | 643 | 128.5 |
| B | 12 | 111 | 16486 | 123.33 | 663 | 643 | 128.5 |
| C | 15 | 214 | 246957 | 1604.61 | 654 | 658 | 153.5 |
| C | 1 | 128 | 4513 | 25.11 | 654 | 658 | 153.5 |
| C | 13 | 61 | 4487 | 24.95 | 654 | 658 | 153.5 |
| D | 12 | 235 | 171975 | 1069.94 | 650 | 630 | 160.1 |
| D | 13 | 171 | 135569 | 842.61 | 650 | 630 | 160.1 |
| D | 12 | 227 | 89894 | 557.4 | 650 | 630 | 160.1 |
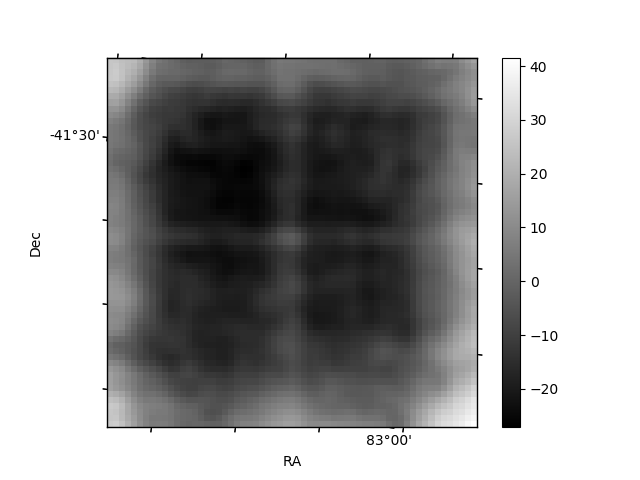
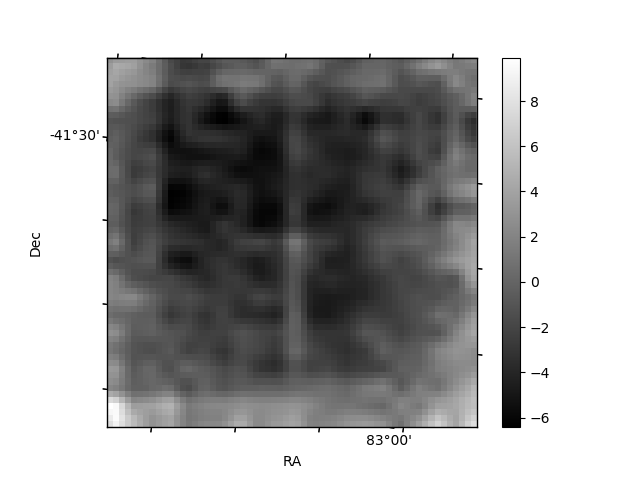
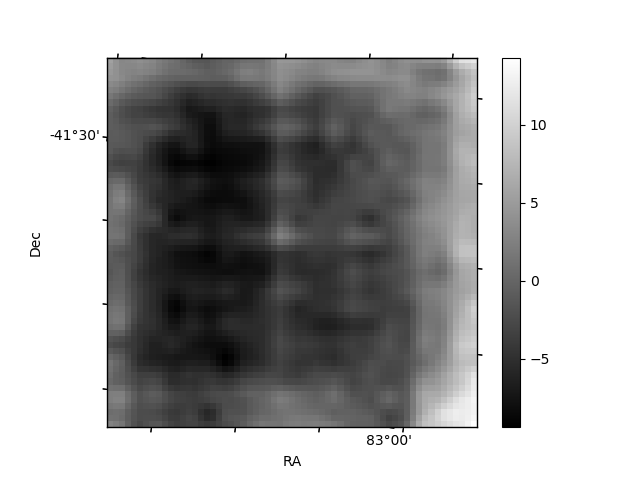
Histogram calculated using DETX and DETY for each event in the final _common_clean file
| Quadrant A | 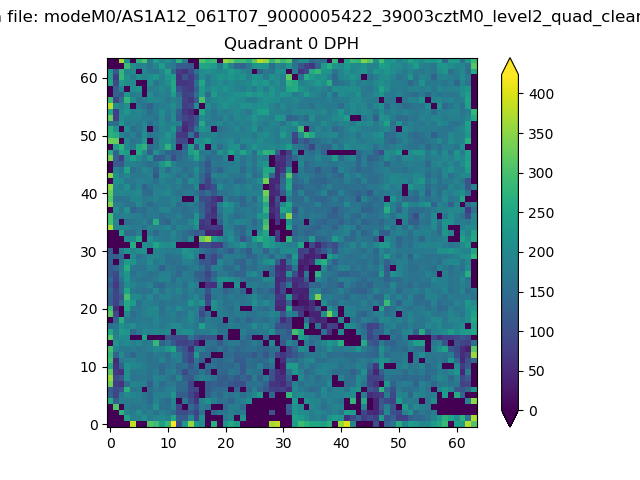 |
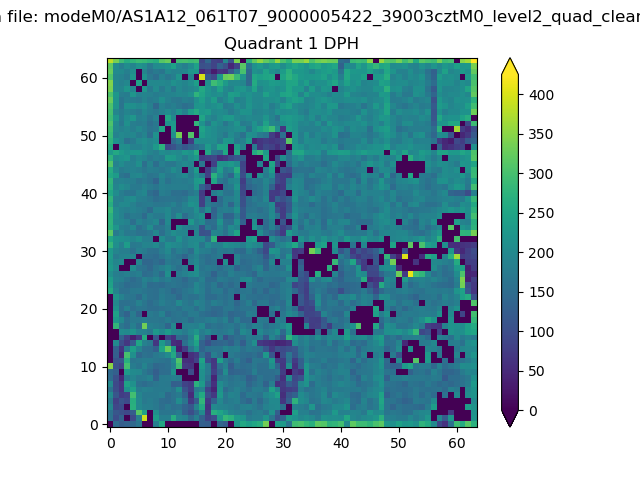 |
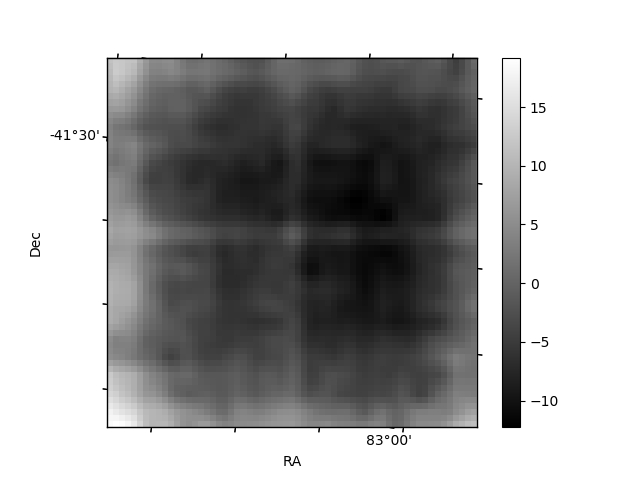
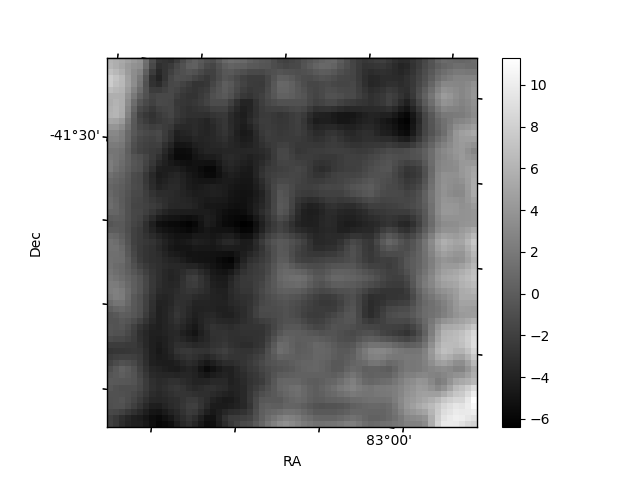
Quadrant B |
|---|---|---|---|
| Quadrant D | 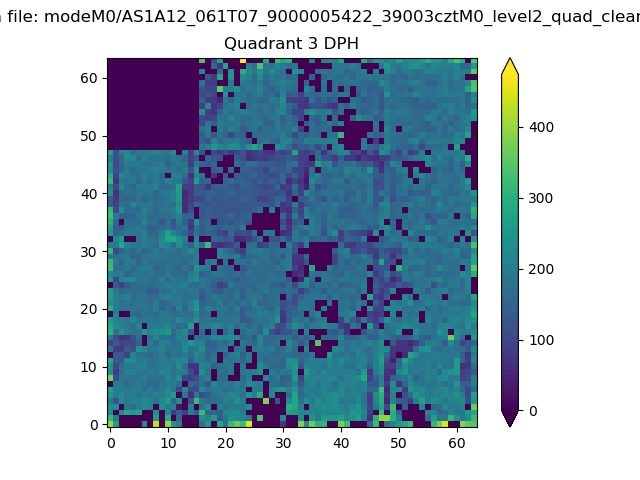 |
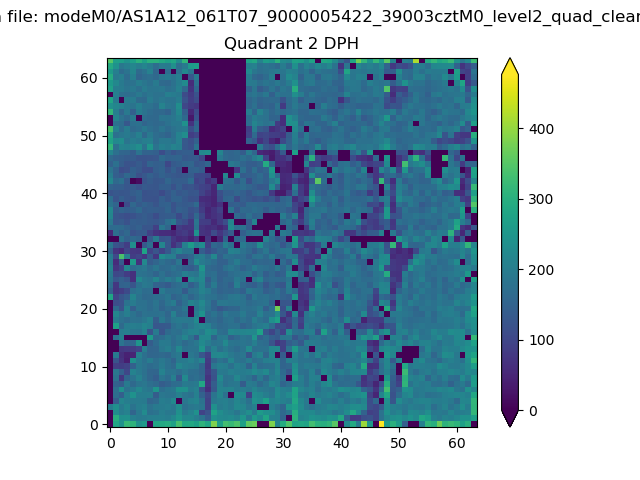 |
Quadrant C |
| Plot type | Count rate plots | Images |
|---|---|---|
| Comparison with Poisson distribution Blue bars denote a histogram of data divided into 1 sec bins. Red curve is a Poisson curve with rate = median count rate of data. |
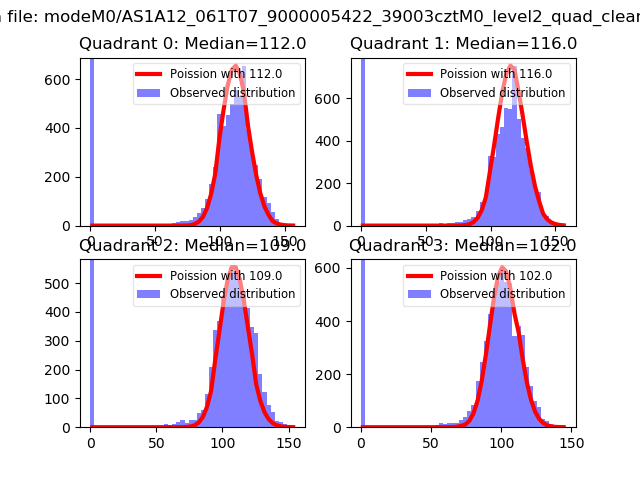 |
 |
| Quadrant-wise count rates Data is divided into 100 sec bins |
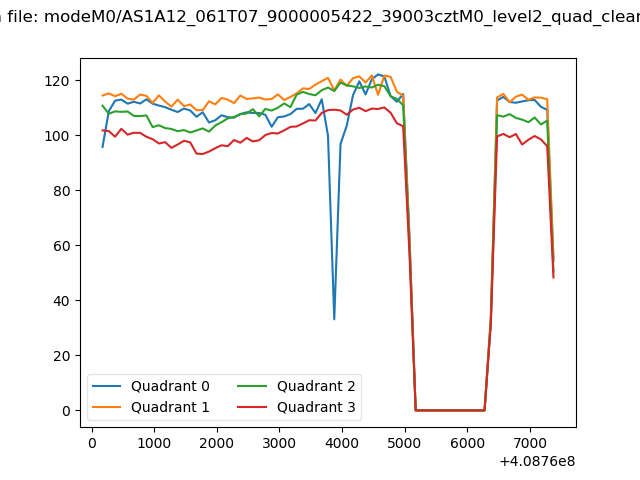 |
|
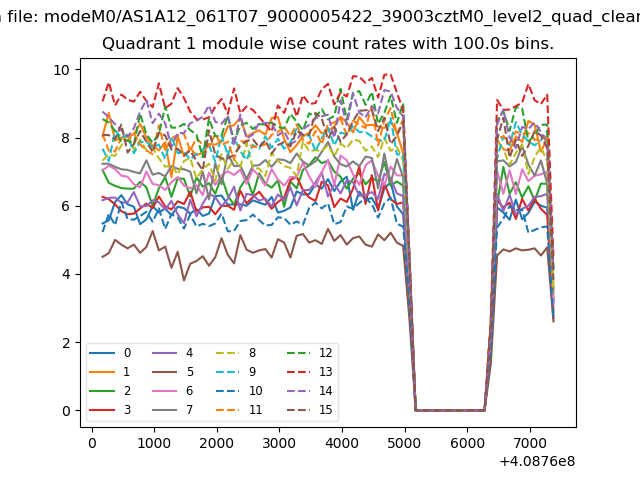
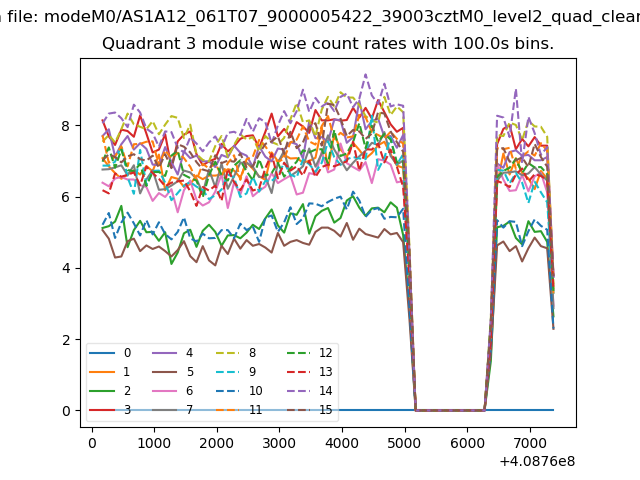
| Module-wise count rates for Quadrant A Data is divided into 100 sec bins |
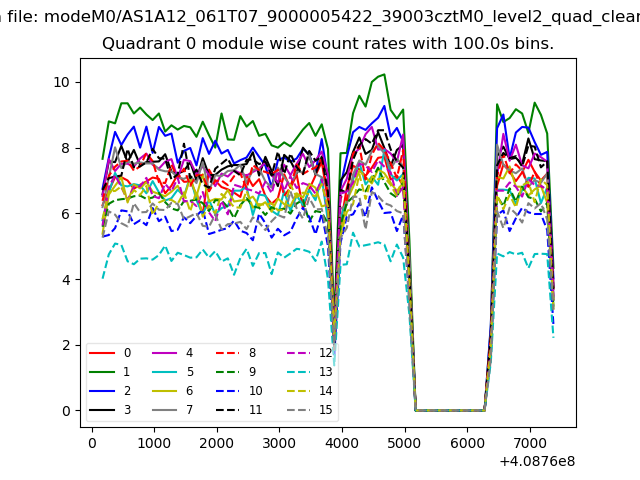 |
 |
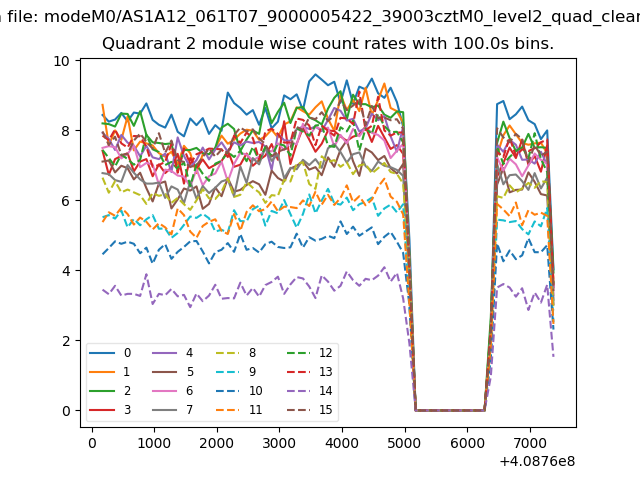
| Module-wise count rates for Quadrant B Data is divided into 100 sec bins |
 |
 |
| Module-wise count rates for Quadrant C Data is divided into 100 sec bins |
 |
 |
| Module-wise count rates for Quadrant D Data is divided into 100 sec bins |
 |
 |
| Parameter | Plot |
|---|---|
| CZT HV Monitor | 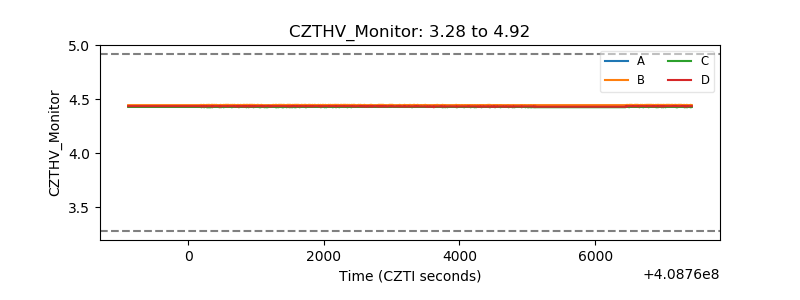 |
| D_VDD | 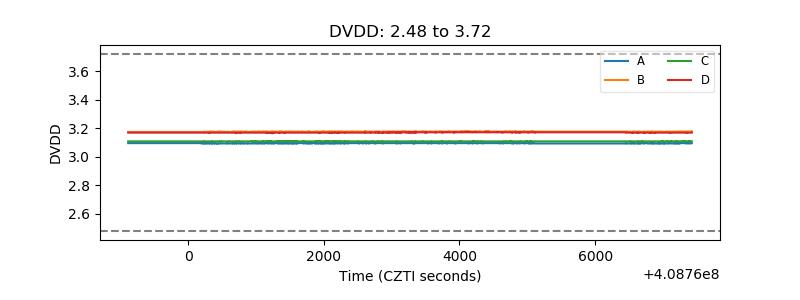 |
| Temperature 1 | 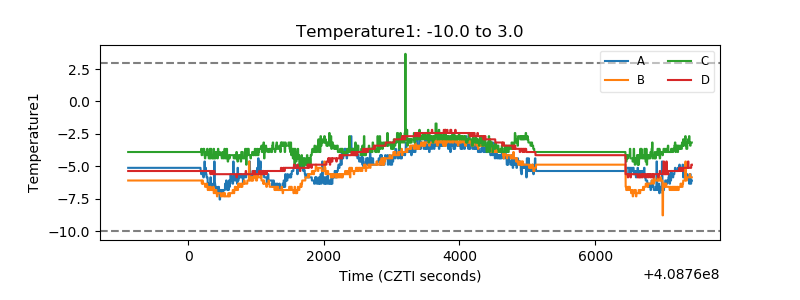 |
| Veto HV Monitor | 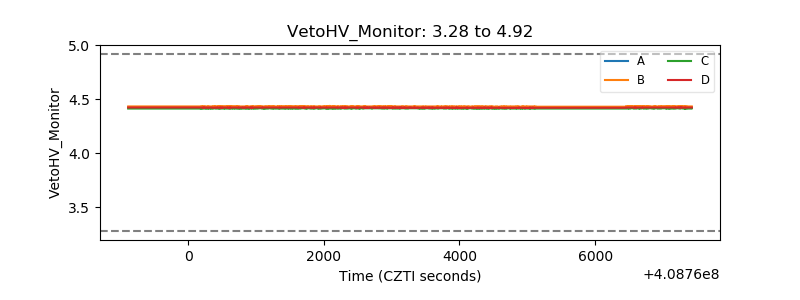 |
| Veto LLD | 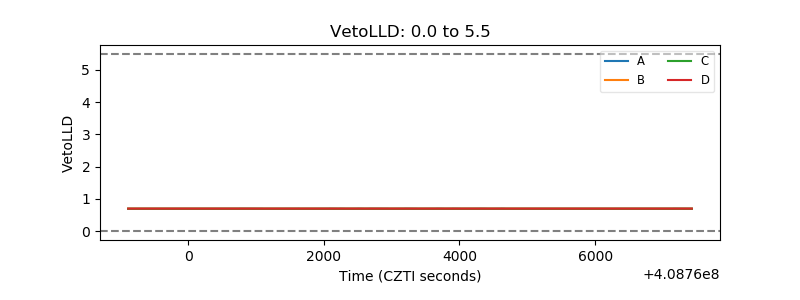 |
| Alpha Counter | 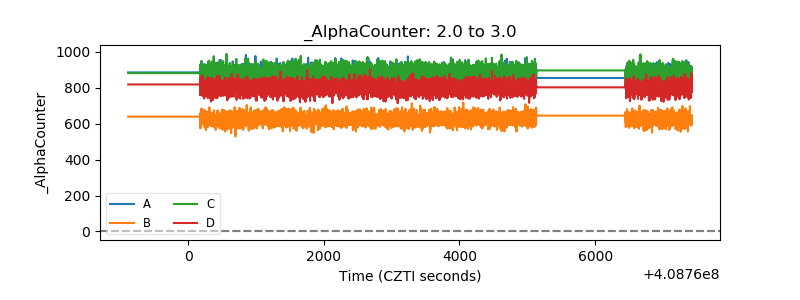 |
| _CPM_Rate | 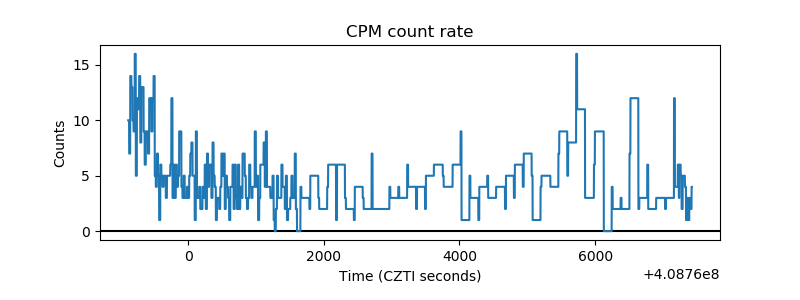 |
| CZT Counter | 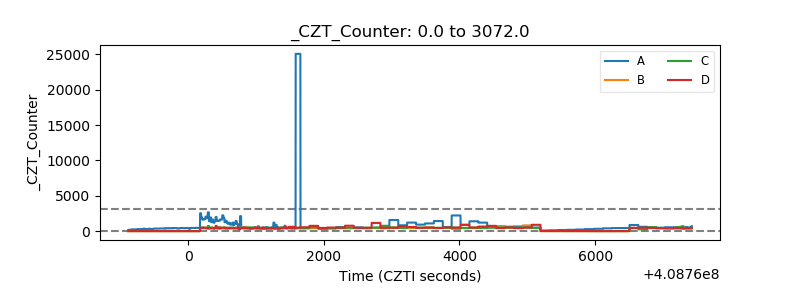 |
| +2.5 Volts monitor | 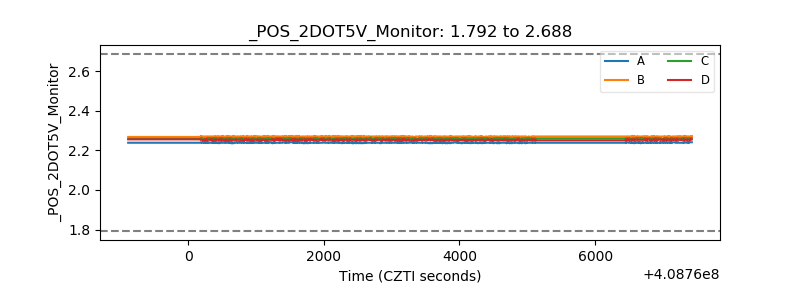 |
| +5 Volts monitor | 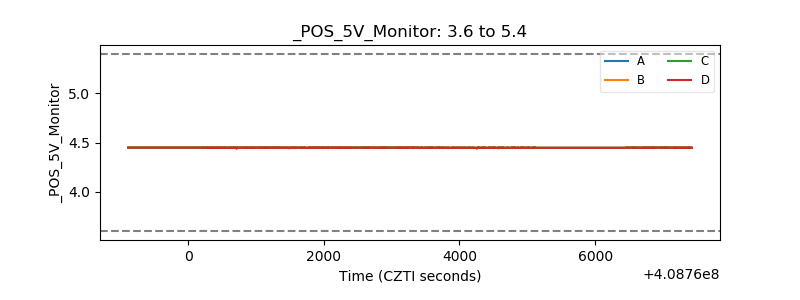 |
| _ROLL_ROT | 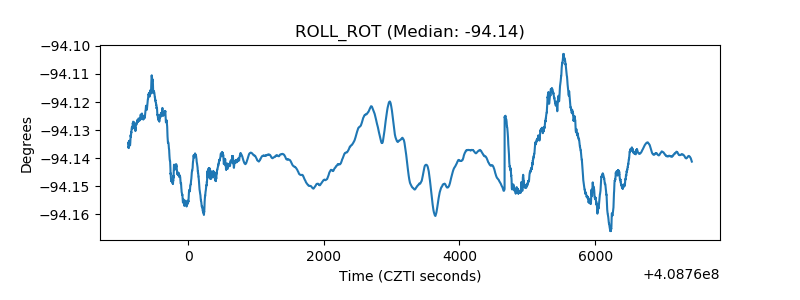 |
| _Roll_DEC | 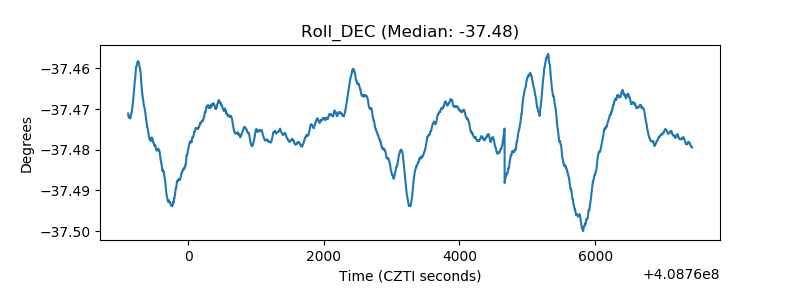 |
| _Roll_RA | 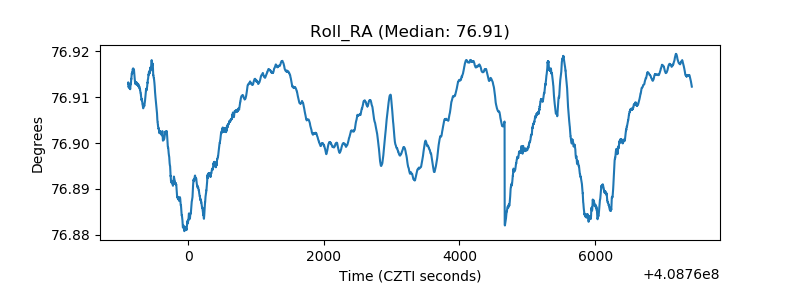 |
| Veto Counter | 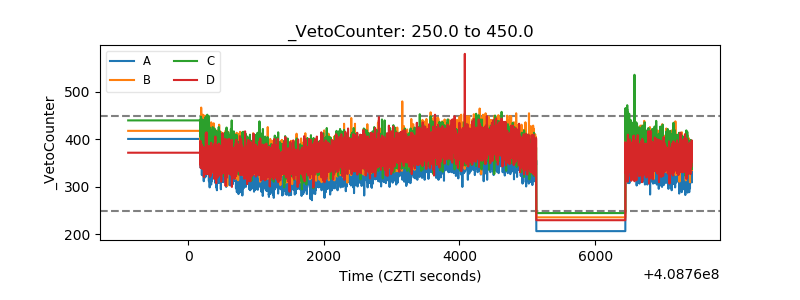 |