| Param | Original file | Final file |
|---|---|---|
| Filename | modeM0/AS1A12_061T07_9000005422_39006cztM0_level2.fits | modeM0/AS1A12_061T07_9000005422_39006cztM0_level2_quad_clean.evt |
| Size (bytes) | 301,567,680 | 80,867,520 |
| Size | 287.6 MB | 77.1 MB |
| Events in quadrant A | 3,610,688 | 531,168 |
| Events in quadrant B | 2,347,108 | 553,542 |
| Events in quadrant C | 2,314,057 | 530,471 |
| Events in quadrant D | 2,510,788 | 491,019 |
| Mode SS | |||
|---|---|---|---|
| Quadrant | BADHDUFLAG | Total packets | Discarded packets |
| A | 0 | 100 | 0 |
| B | 0 | 100 | 0 |
| C | 0 | 100 | 0 |
| D | 0 | 100 | 0 |
| Mode M0 | |||
|---|---|---|---|
| Quadrant | BADHDUFLAG | Total packets | Discarded packets |
| A | 0 | 13941 | 1 |
| B | 0 | 10245 | 1 |
| C | 0 | 9785 | 1 |
| D | 0 | 10789 | 1 |
| Mode M9 | |||
|---|---|---|---|
| Quadrant | BADHDUFLAG | Total packets | Discarded packets |
| A | 0 | 13 | 0 |
| B | 0 | 13 | 0 |
| C | 0 | 13 | 0 |
| D | 0 | 13 | 0 |
| Quadrant | Total seconds | Saturated seconds | Saturation percentage |
|---|---|---|---|
| A | 4878 | 188 | 3.854039% |
| B | 4878 | 40 | 0.820008% |
| C | 4878 | 1 | 0.020500% |
| D | 4878 | 28 | 0.574006% |
Noise dominated data is calculated using 1-second bins in cleaned event files. If a bin has >2000 counts, and if more than 50% of those come from <1% of pixels, then it is considered to be noise-dominated and hence unusable.
| Quadrant | # 1 sec bins | Bins with >0 counts | Bins with >2000 counts | High rate bins dominated by noise | Noise dominated (total time) | Noise dominated (detector-on time) | Marked lightcurve |
|---|---|---|---|---|---|---|---|
| A | 6191 | 4879 | 237 | 237 | 3.83% | 4.86% | 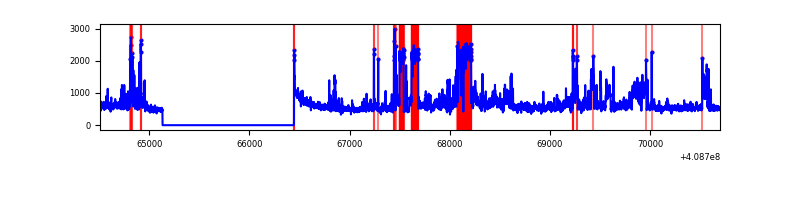 |
| B | 6191 | 4879 | 11 | 11 | 0.18% | 0.23% | 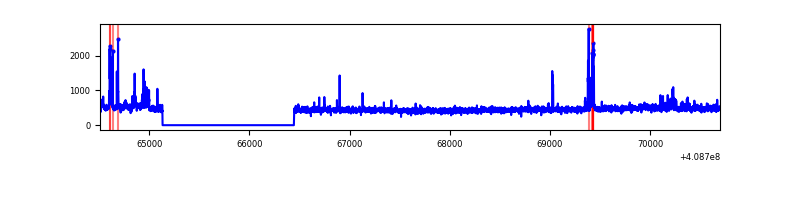 |
| C | 6191 | 4879 | 0 | 0 | 0.00% | 0.00% | 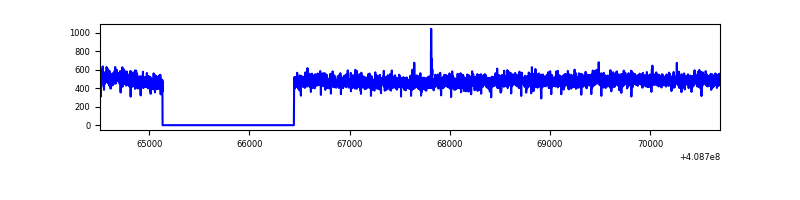 |
| D | 6191 | 4879 | 31 | 31 | 0.50% | 0.64% | 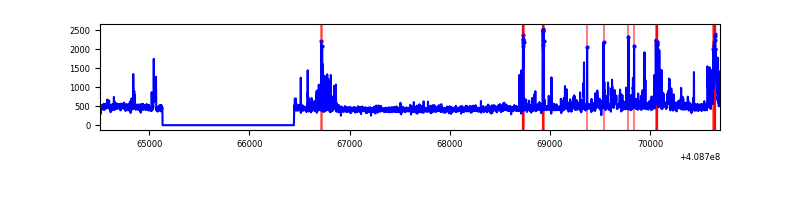 |
Top three noisy pixels from each quadrant. If the there are fewer than three noisy pixels in the level2.evt file, extra rows are filled as -1
| Pixel properties | Quadrant properties | ||||||
|---|---|---|---|---|---|---|---|
| Quadrant | DetID | PixID | Counts | Sigma | Mean | Median | Sigma |
| A | 15 | 222 | 1058107 | 9394.25 | 549 | 538 | 112.6 |
| A | 10 | 83 | 308217 | 2733.07 | 549 | 538 | 112.6 |
| A | 13 | 248 | 99197 | 876.38 | 549 | 538 | 112.6 |
| B | 5 | 172 | 149559 | 1393.96 | 549 | 534 | 106.9 |
| B | 0 | 230 | 22427 | 204.78 | 549 | 534 | 106.9 |
| B | 12 | 111 | 13690 | 123.06 | 549 | 534 | 106.9 |
| C | 15 | 214 | 198031 | 1544.7 | 539 | 543 | 127.8 |
| C | 1 | 128 | 10007 | 74.03 | 539 | 543 | 127.8 |
| C | 10 | 20 | 4046 | 27.4 | 539 | 543 | 127.8 |
| D | 13 | 171 | 184931 | 1401.83 | 538 | 523 | 131.5 |
| D | 12 | 227 | 137937 | 1044.59 | 538 | 523 | 131.5 |
| D | 12 | 235 | 65464 | 493.67 | 538 | 523 | 131.5 |
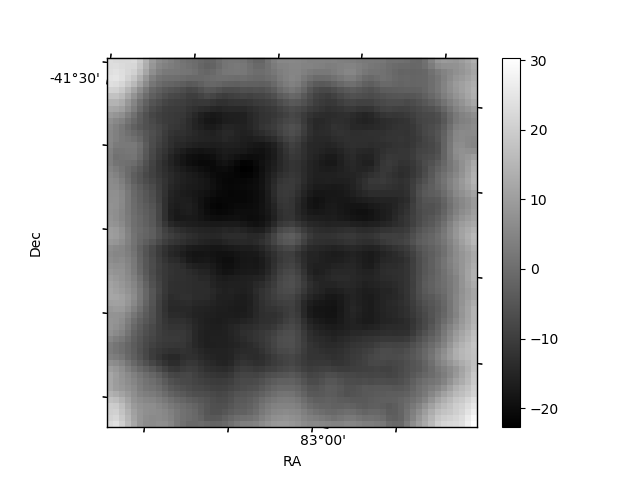
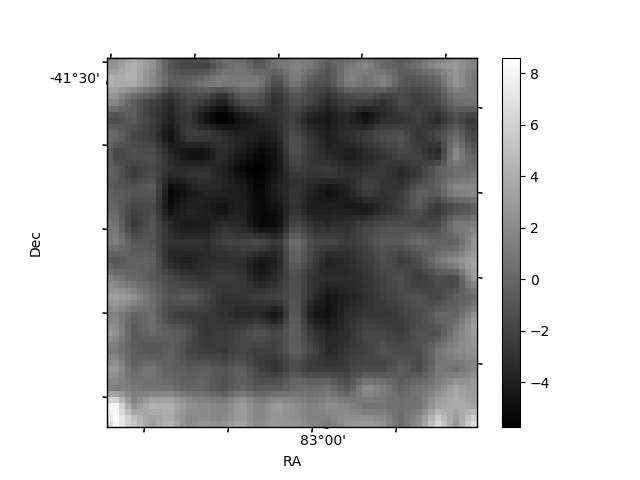
Histogram calculated using DETX and DETY for each event in the final _common_clean file
| Quadrant A | 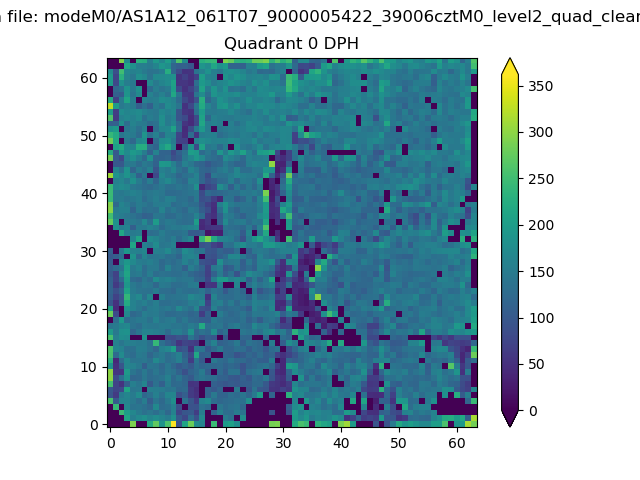 |
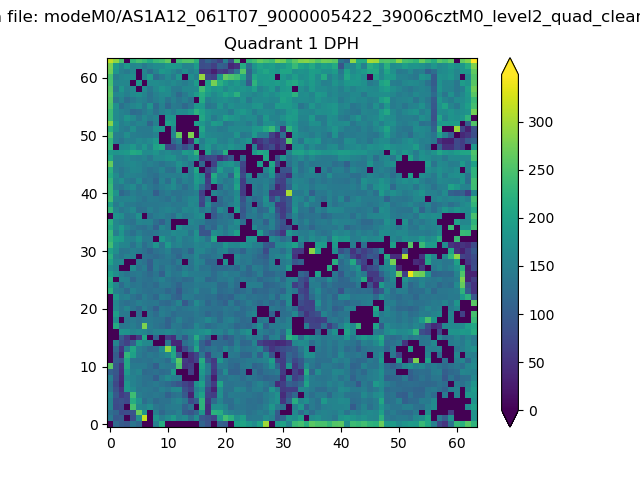 |
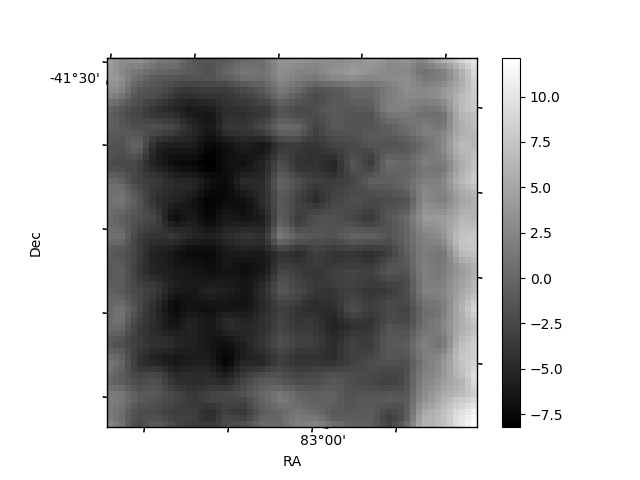
Quadrant B |
|---|---|---|---|
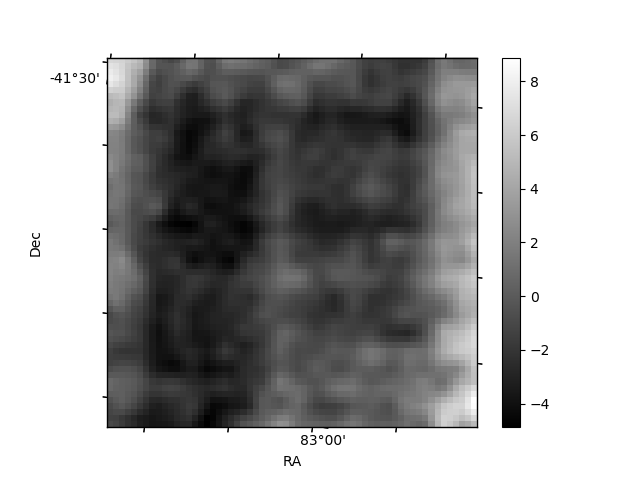
| Quadrant D | 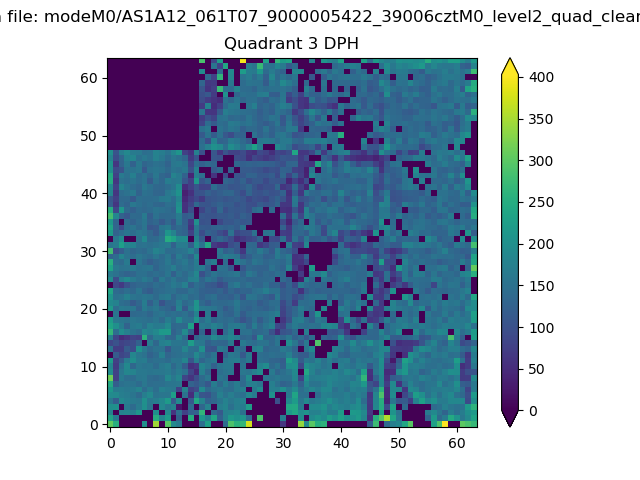 |
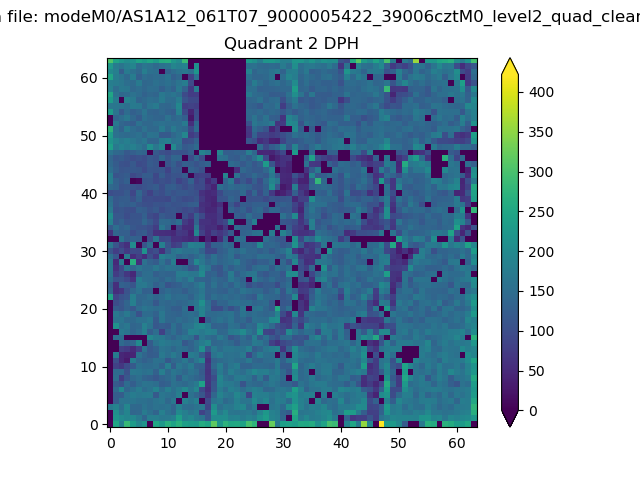 |
Quadrant C |
| Plot type | Count rate plots | Images |
|---|---|---|
| Comparison with Poisson distribution Blue bars denote a histogram of data divided into 1 sec bins. Red curve is a Poisson curve with rate = median count rate of data. |
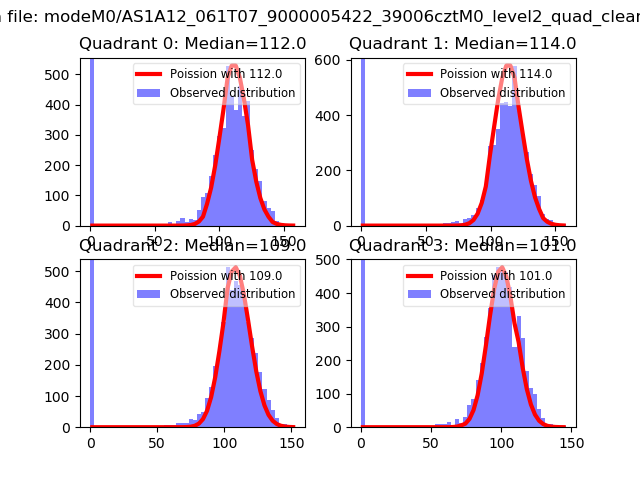 |
 |
| Quadrant-wise count rates Data is divided into 100 sec bins |
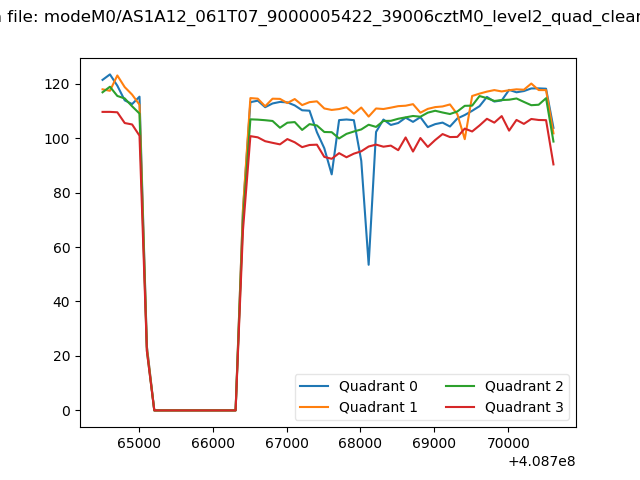 |
|
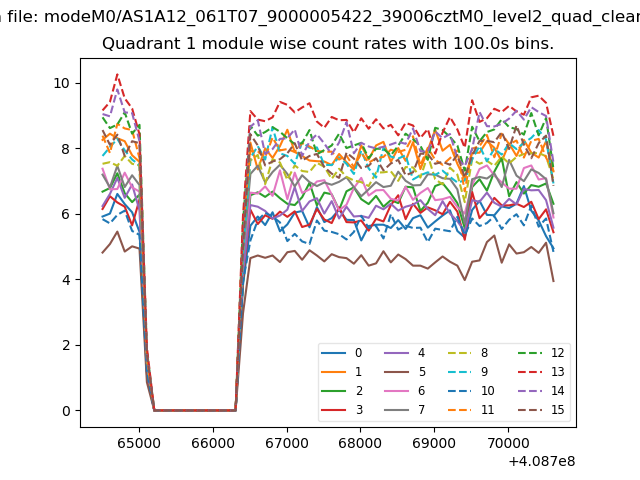
| Module-wise count rates for Quadrant A Data is divided into 100 sec bins |
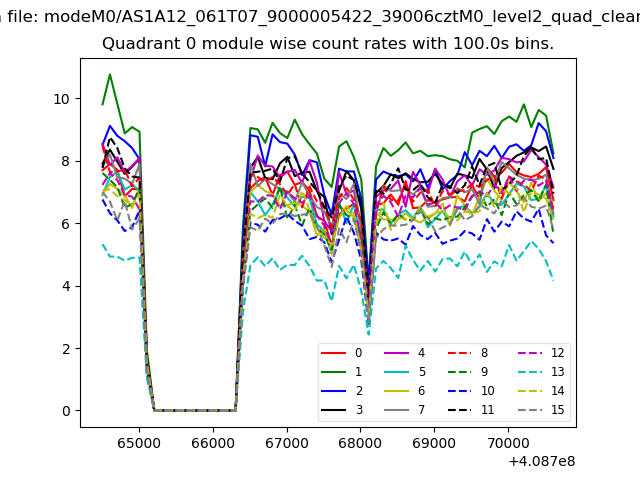 |
 |
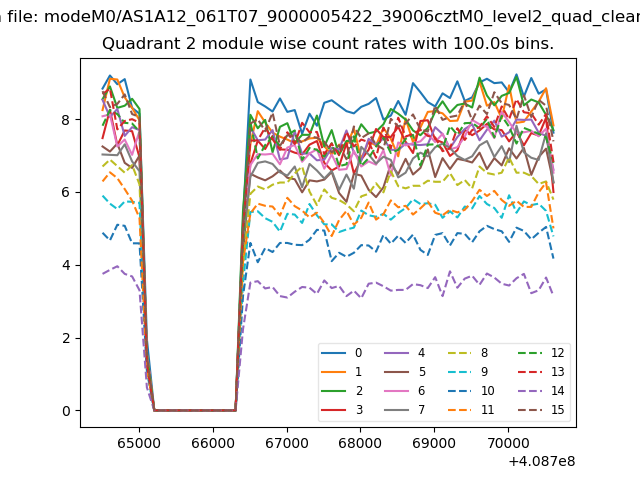
| Module-wise count rates for Quadrant B Data is divided into 100 sec bins |
 |
 |
| Module-wise count rates for Quadrant C Data is divided into 100 sec bins |
 |
 |
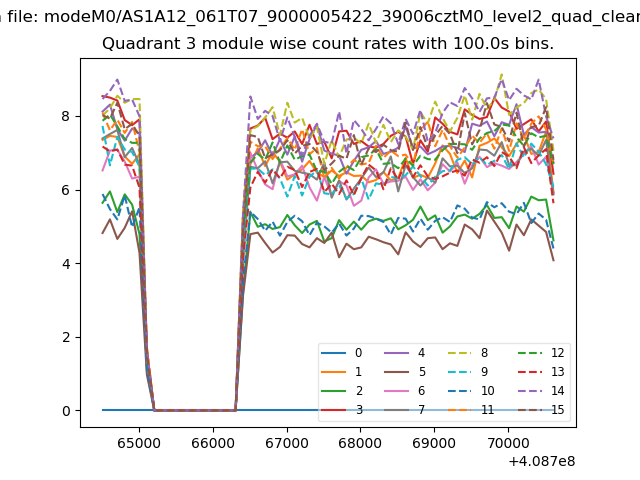
| Module-wise count rates for Quadrant D Data is divided into 100 sec bins |
 |
 |
| Parameter | Plot |
|---|---|
| CZT HV Monitor | 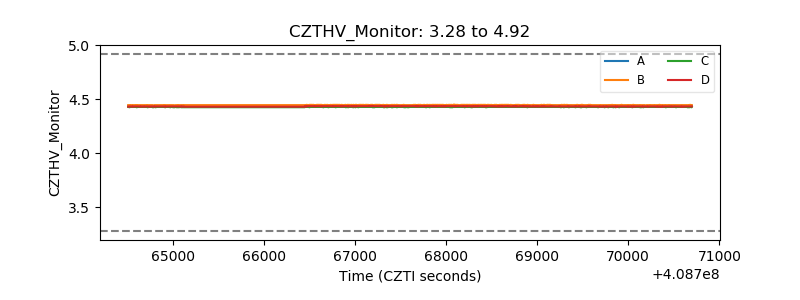 |
| D_VDD | 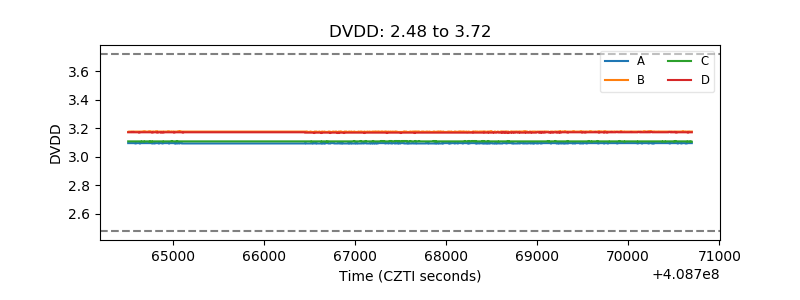 |
| Temperature 1 | 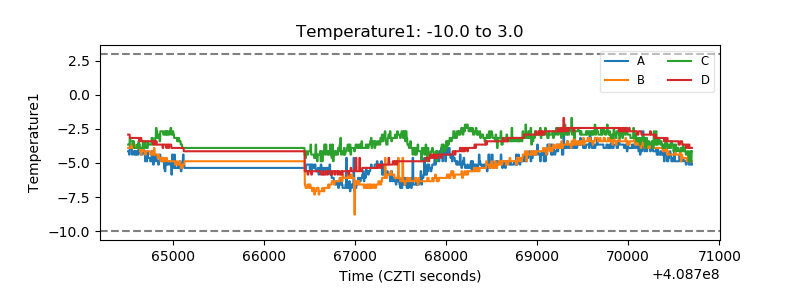 |
| Veto HV Monitor | 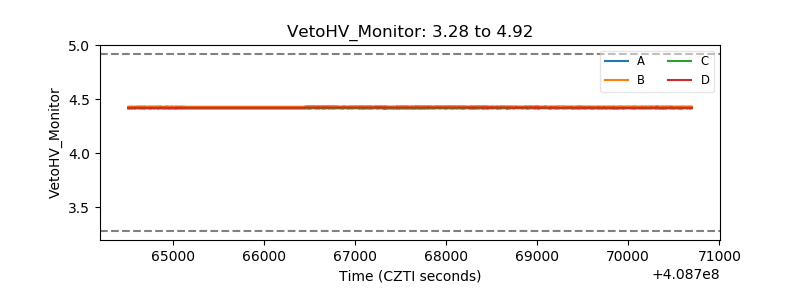 |
| Veto LLD | 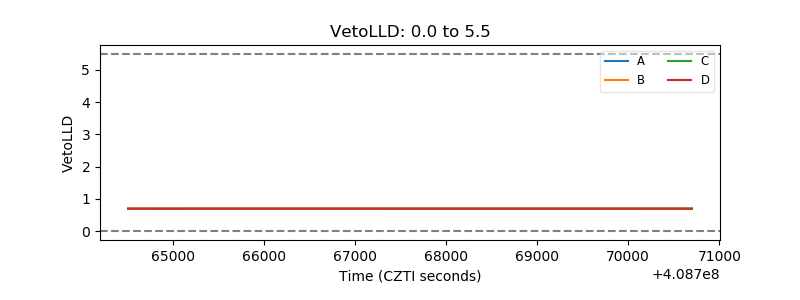 |
| Alpha Counter | 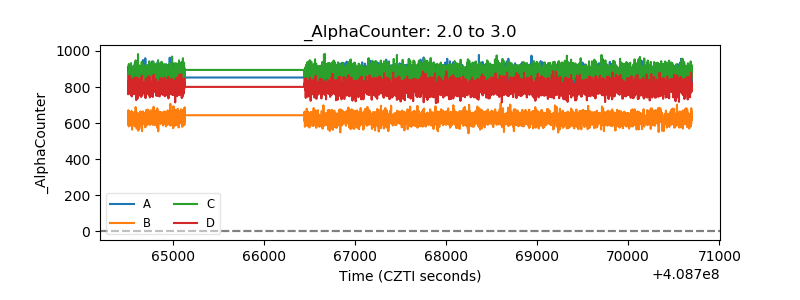 |
| _CPM_Rate | 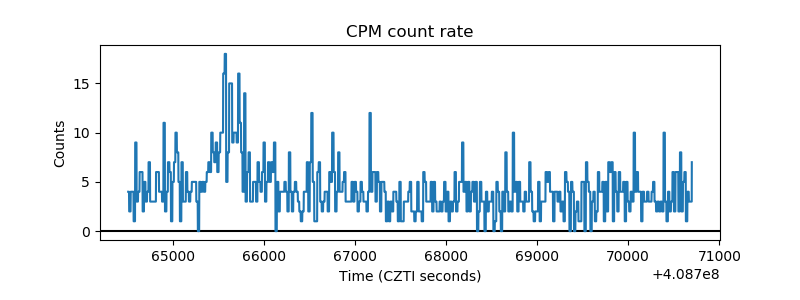 |
| CZT Counter | 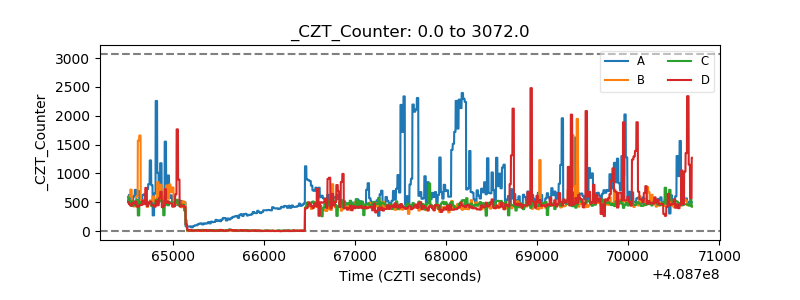 |
| +2.5 Volts monitor | 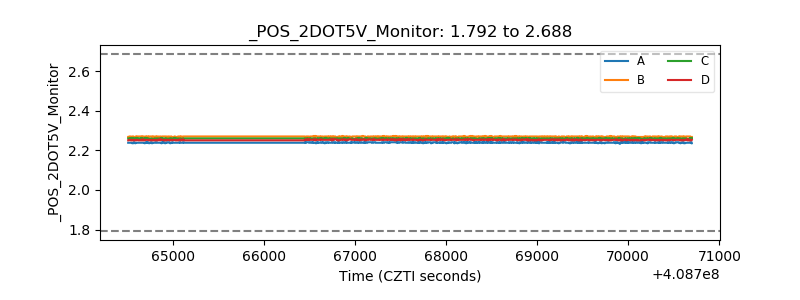 |
| +5 Volts monitor | 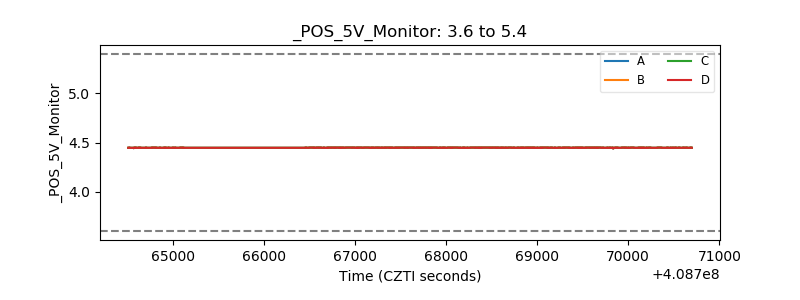 |
| _ROLL_ROT | 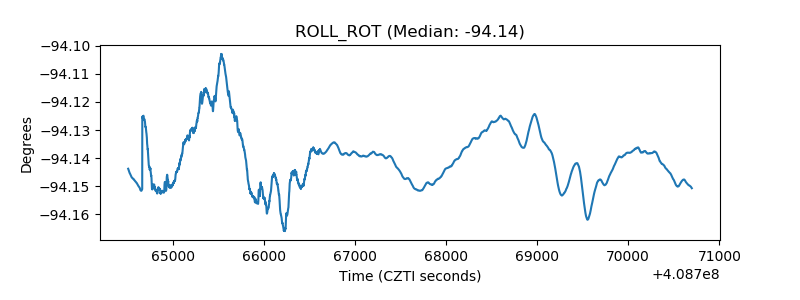 |
| _Roll_DEC | 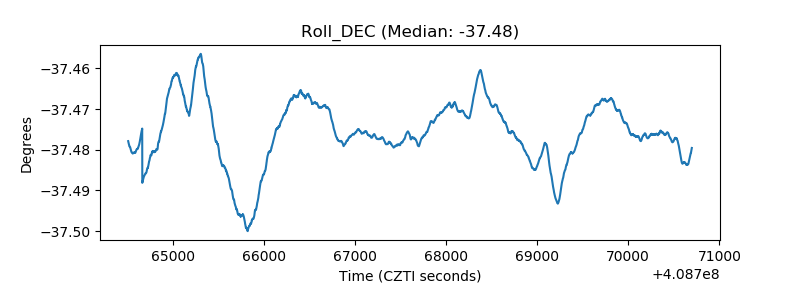 |
| _Roll_RA | 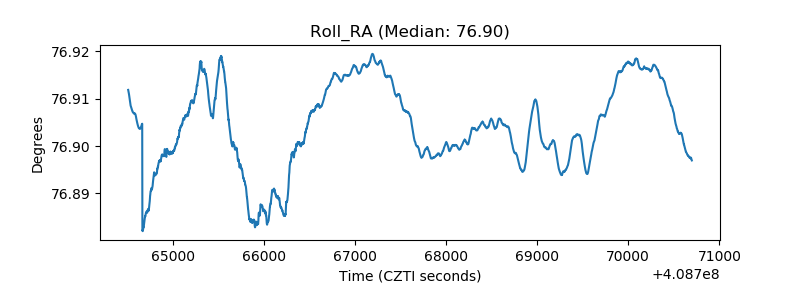 |
| Veto Counter | 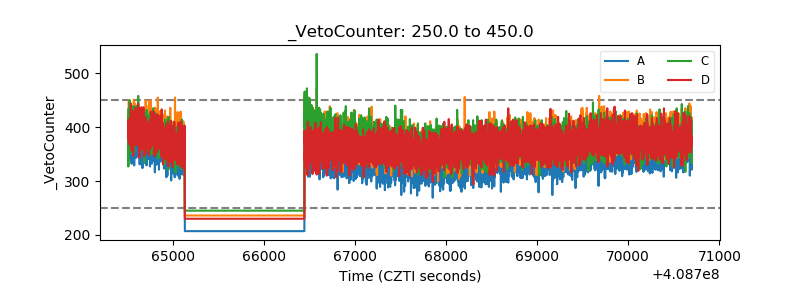 |