| Param | Original file | Final file |
|---|---|---|
| Filename | modeM0/AS1A12_077T06_9000005426_39036cztM0_level2.fits | modeM0/AS1A12_077T06_9000005426_39036cztM0_level2_quad_clean.evt |
| Size (bytes) | 402,572,160 | 90,645,120 |
| Size | 383.9 MB | 86.4 MB |
| Events in quadrant A | 6,608,432 | 547,650 |
| Events in quadrant B | 2,578,356 | 640,430 |
| Events in quadrant C | 2,670,129 | 605,896 |
| Events in quadrant D | 2,611,729 | 561,386 |
| Mode M9 | |||
|---|---|---|---|
| Quadrant | BADHDUFLAG | Total packets | Discarded packets |
| A | 0 | 23 | 0 |
| B | 0 | 23 | 0 |
| C | 0 | 23 | 0 |
| D | 0 | 24 | 0 |
| Mode M0 | |||
|---|---|---|---|
| Quadrant | BADHDUFLAG | Total packets | Discarded packets |
| A | 0 | 23616 | 3 |
| B | 0 | 11370 | 2 |
| C | 0 | 11310 | 2 |
| D | 0 | 11601 | 2 |
| Mode SS | |||
|---|---|---|---|
| Quadrant | BADHDUFLAG | Total packets | Discarded packets |
| A | 0 | 112 | 0 |
| B | 0 | 112 | 0 |
| C | 0 | 112 | 0 |
| D | 0 | 112 | 0 |
| Quadrant | Total seconds | Saturated seconds | Saturation percentage |
|---|---|---|---|
| A | 5569 | 848 | 15.227150% |
| B | 5569 | 7 | 0.125696% |
| C | 5569 | 5 | 0.089783% |
| D | 5569 | 9 | 0.161609% |
Noise dominated data is calculated using 1-second bins in cleaned event files. If a bin has >2000 counts, and if more than 50% of those come from <1% of pixels, then it is considered to be noise-dominated and hence unusable.
| Quadrant | # 1 sec bins | Bins with >0 counts | Bins with >2000 counts | High rate bins dominated by noise | Noise dominated (total time) | Noise dominated (detector-on time) | Marked lightcurve |
|---|---|---|---|---|---|---|---|
| A | 7182 | 5570 | 755 | 755 | 10.51% | 13.55% | 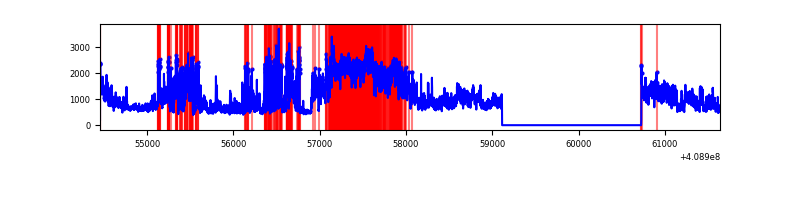 |
| B | 7182 | 5570 | 1 | 1 | 0.01% | 0.02% | 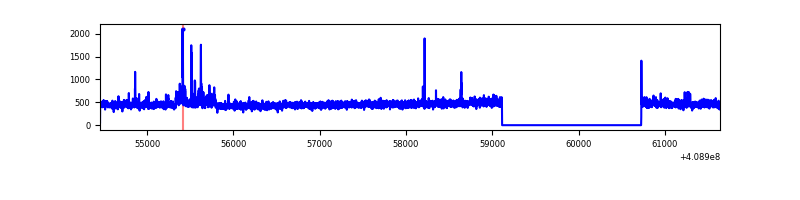 |
| C | 7182 | 5570 | 0 | 0 | 0.00% | 0.00% | 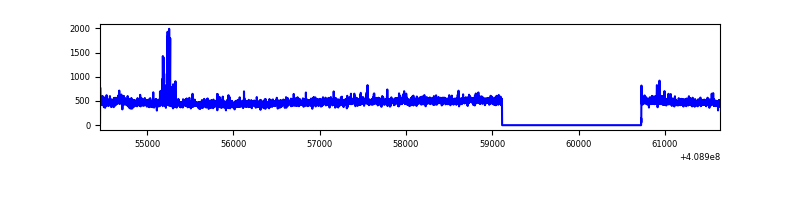 |
| D | 7182 | 5570 | 5 | 5 | 0.07% | 0.09% | 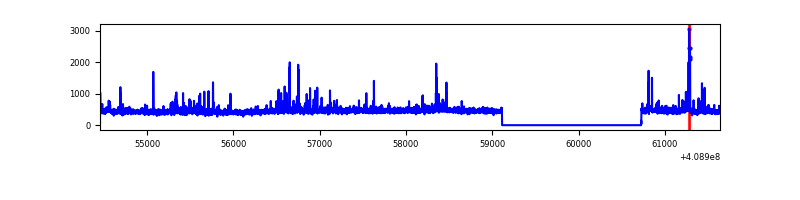 |
Top three noisy pixels from each quadrant. If the there are fewer than three noisy pixels in the level2.evt file, extra rows are filled as -1
| Pixel properties | Quadrant properties | ||||||
|---|---|---|---|---|---|---|---|
| Quadrant | DetID | PixID | Counts | Sigma | Mean | Median | Sigma |
| A | 15 | 222 | 3835971 | 31551.07 | 601 | 590 | 121.6 |
| A | 10 | 83 | 417414 | 3428.93 | 601 | 590 | 121.6 |
| A | 13 | 248 | 15489 | 122.56 | 601 | 590 | 121.6 |
| B | 5 | 184 | 88998 | 734.85 | 620 | 602 | 120.3 |
| B | 0 | 190 | 22531 | 182.3 | 620 | 602 | 120.3 |
| B | 0 | 230 | 16005 | 128.05 | 620 | 602 | 120.3 |
| C | 15 | 214 | 235878 | 1665.59 | 608 | 612 | 141.3 |
| C | 15 | 208 | 41248 | 287.69 | 608 | 612 | 141.3 |
| C | 9 | 54 | 7489 | 48.69 | 608 | 612 | 141.3 |
| D | 12 | 235 | 70253 | 466.06 | 610 | 590 | 149.5 |
| D | 2 | 249 | 67522 | 447.79 | 610 | 590 | 149.5 |
| D | 2 | 250 | 46463 | 306.9 | 610 | 590 | 149.5 |
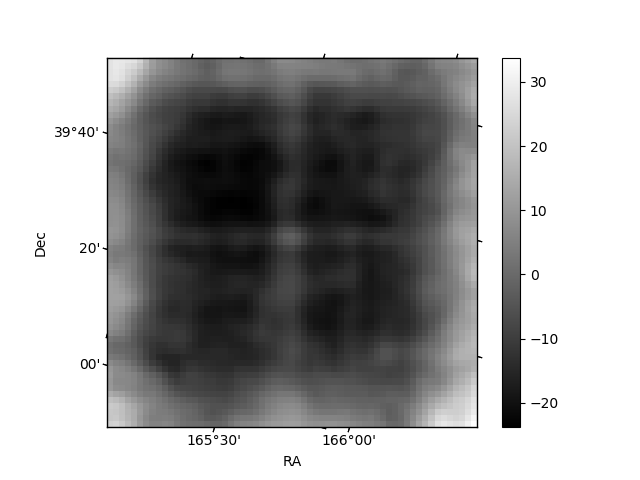
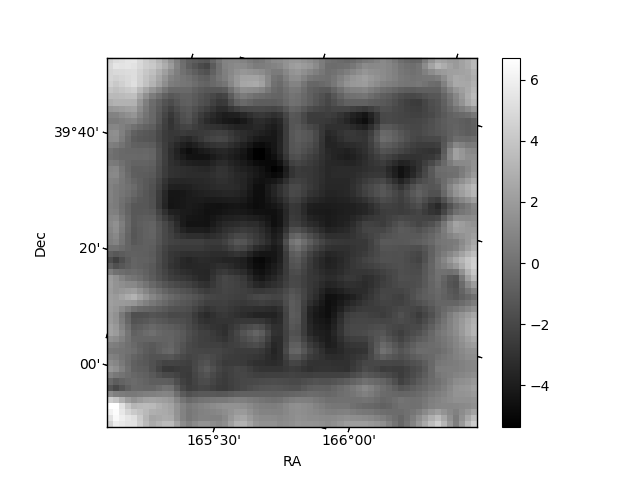
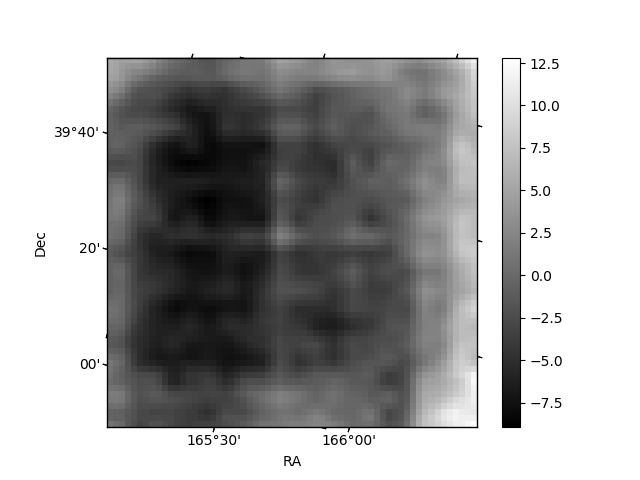
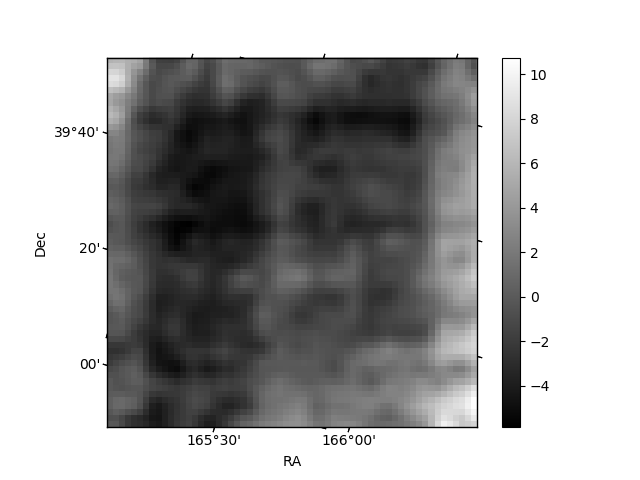
Histogram calculated using DETX and DETY for each event in the final _common_clean file
| Quadrant A | 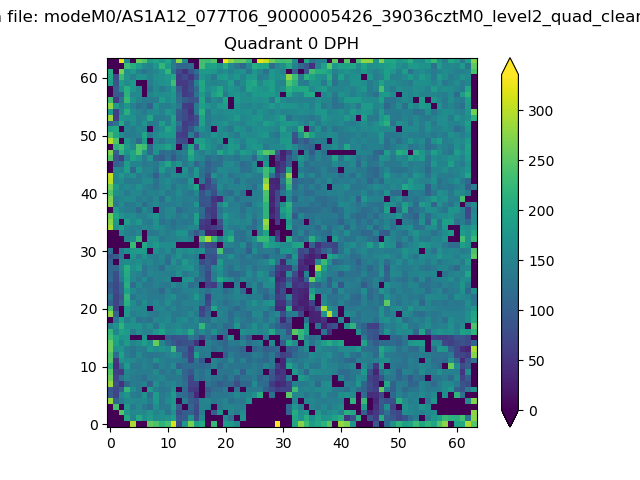 |
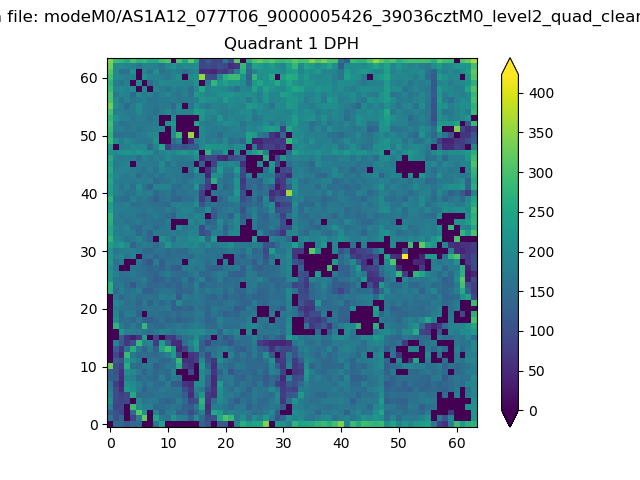 |
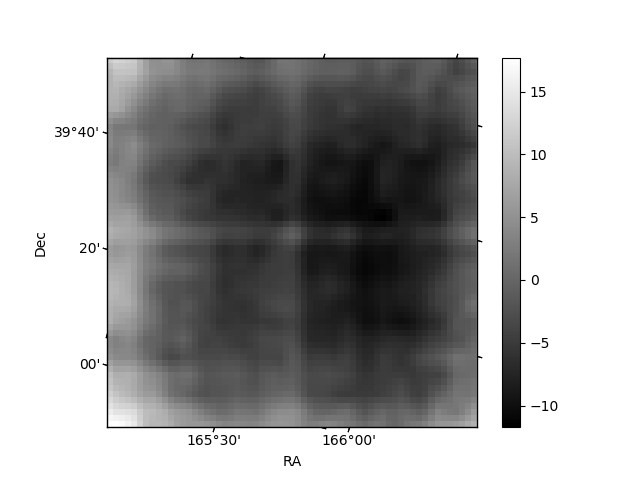
Quadrant B |
|---|---|---|---|
| Quadrant D | 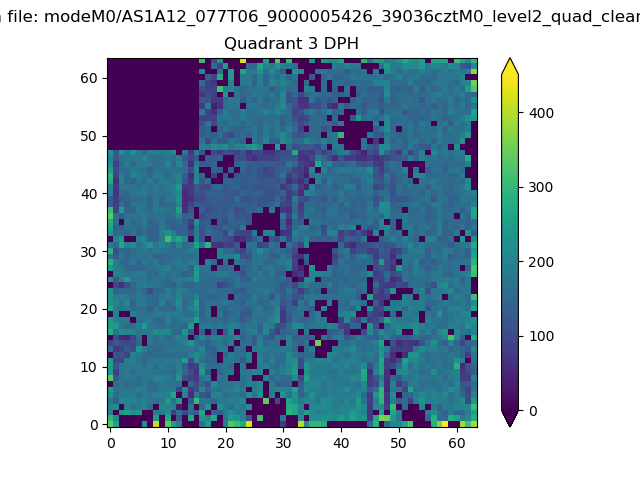 |
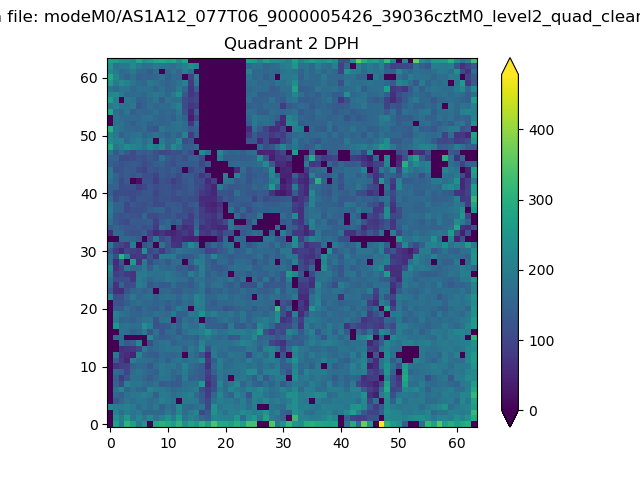 |
Quadrant C |
| Plot type | Count rate plots | Images |
|---|---|---|
| Comparison with Poisson distribution Blue bars denote a histogram of data divided into 1 sec bins. Red curve is a Poisson curve with rate = median count rate of data. |
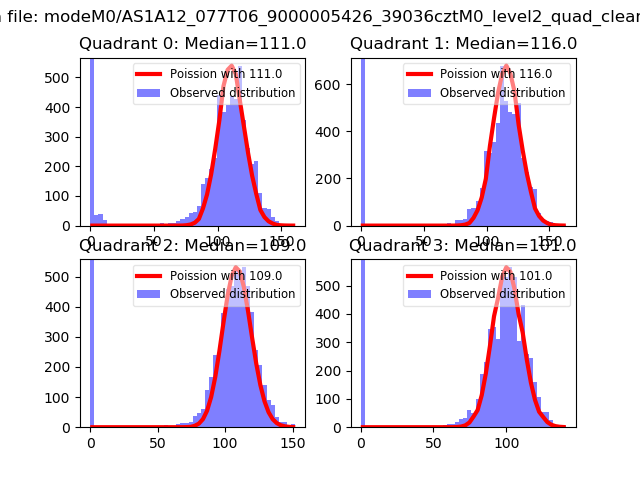 |
 |
| Quadrant-wise count rates Data is divided into 100 sec bins |
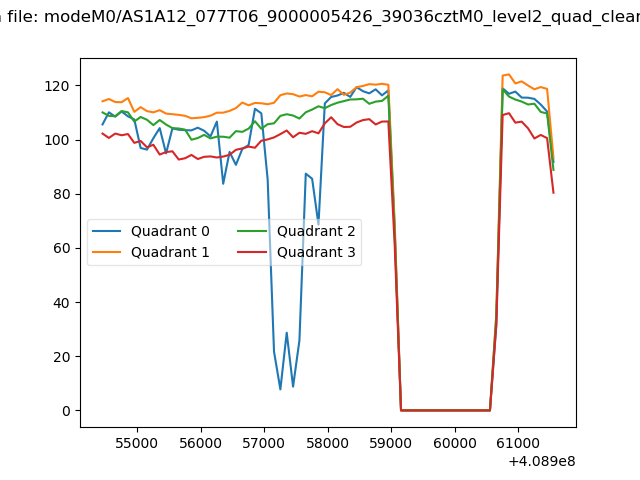 |
|
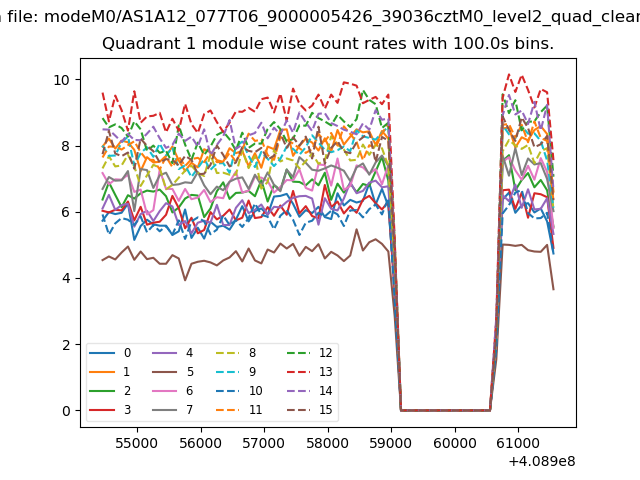
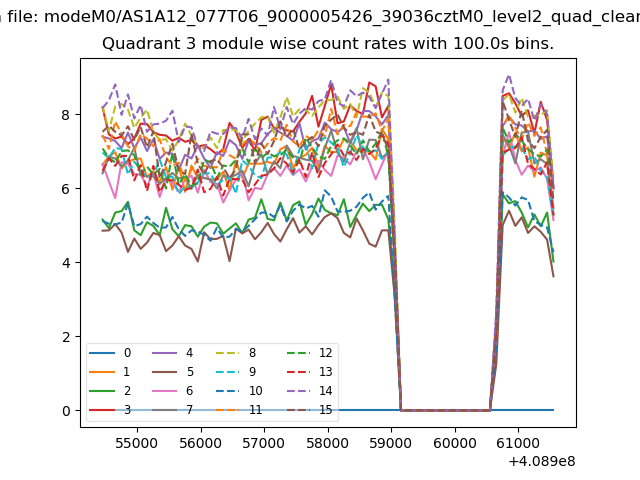
| Module-wise count rates for Quadrant A Data is divided into 100 sec bins |
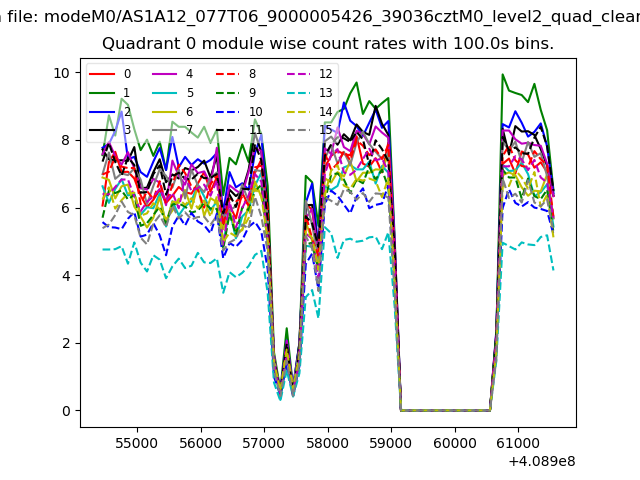 |
 |
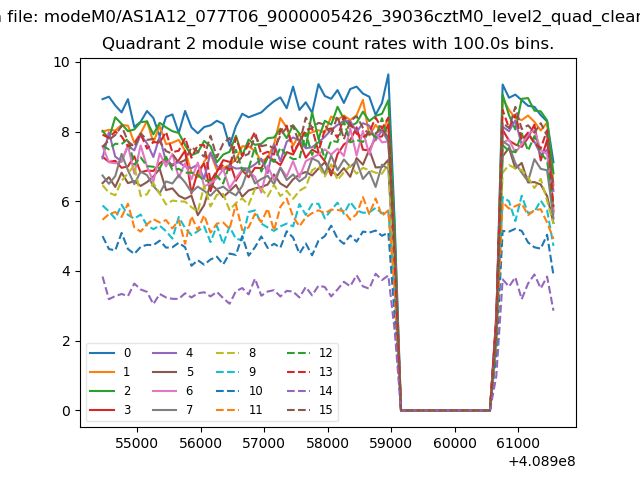
| Module-wise count rates for Quadrant B Data is divided into 100 sec bins |
 |
 |
| Module-wise count rates for Quadrant C Data is divided into 100 sec bins |
 |
 |
| Module-wise count rates for Quadrant D Data is divided into 100 sec bins |
 |
 |
| Parameter | Plot |
|---|---|
| CZT HV Monitor | 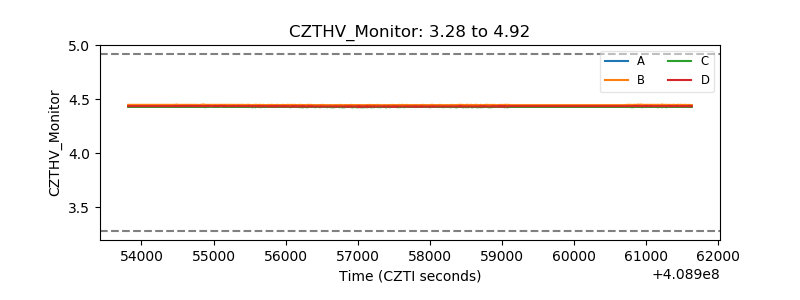 |
| D_VDD | 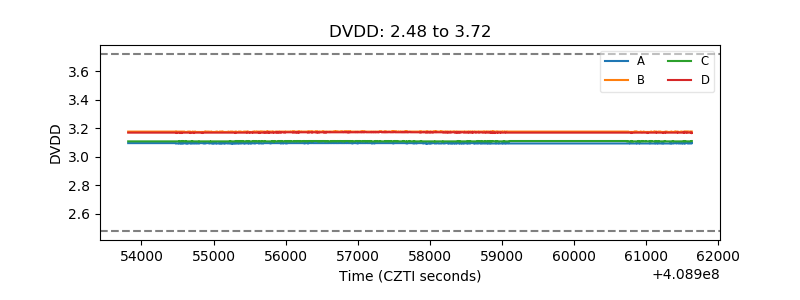 |
| Temperature 1 | 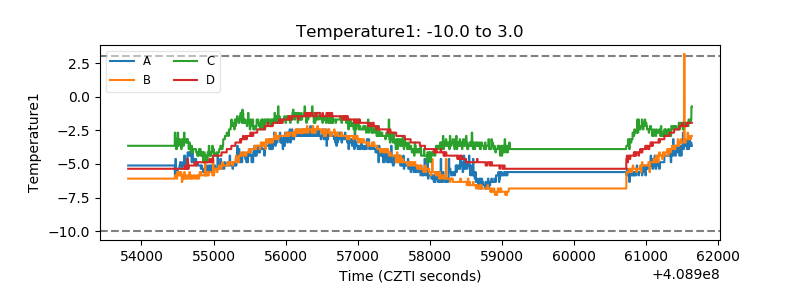 |
| Veto HV Monitor |  |
| Veto LLD | 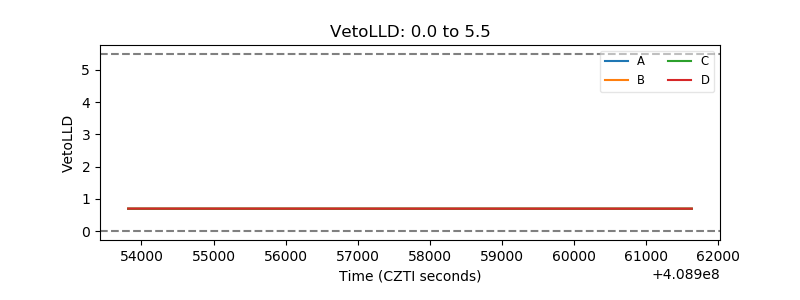 |
| Alpha Counter | 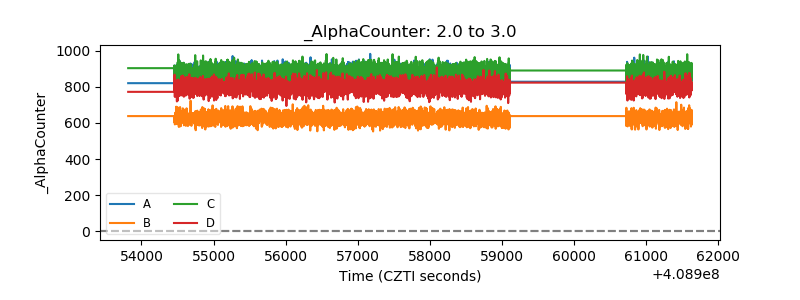 |
| _CPM_Rate | 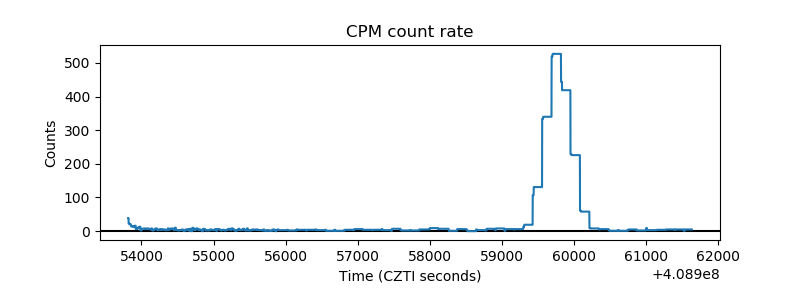 |
| CZT Counter | 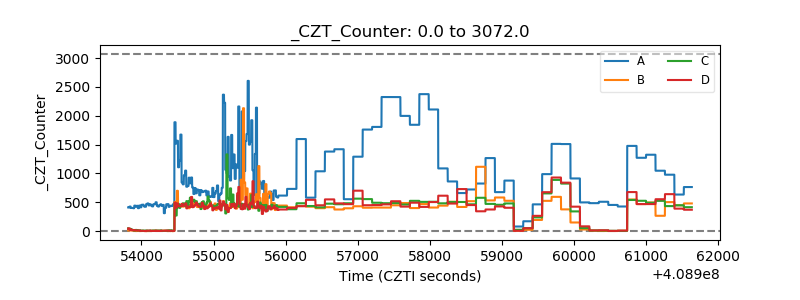 |
| +2.5 Volts monitor |  |
| +5 Volts monitor | 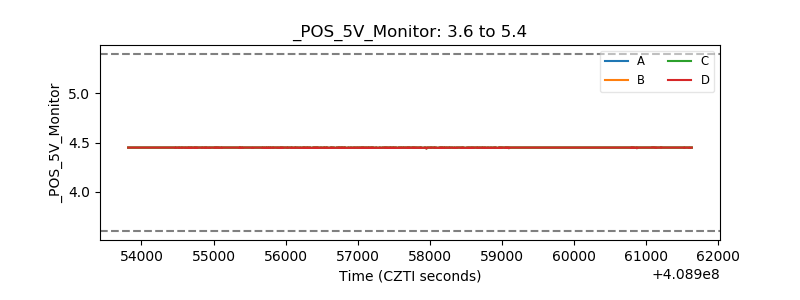 |
| _ROLL_ROT | 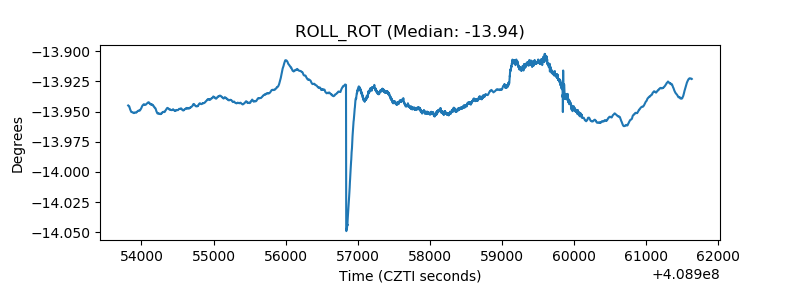 |
| _Roll_DEC | 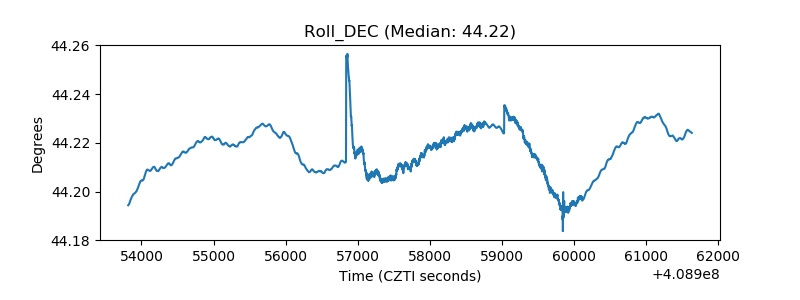 |
| _Roll_RA | 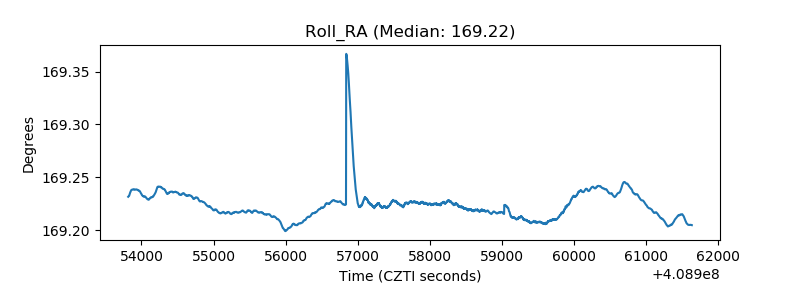 |
| Veto Counter | 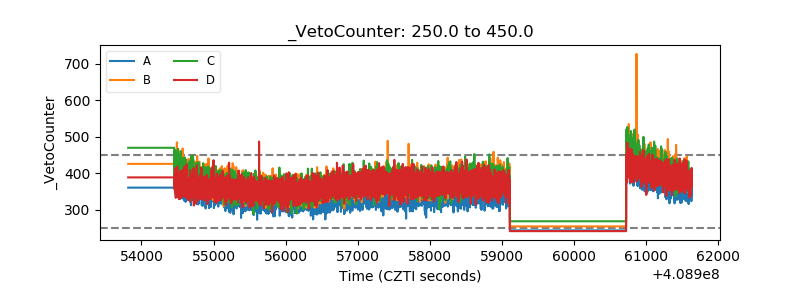 |