| Param | Original file | Final file |
|---|---|---|
| Filename | modeM0/AS1A12_077T06_9000005426_39038cztM0_level2.fits | modeM0/AS1A12_077T06_9000005426_39038cztM0_level2_quad_clean.evt |
| Size (bytes) | 415,765,440 | 88,522,560 |
| Size | 396.5 MB | 84.4 MB |
| Events in quadrant A | 7,146,946 | 514,698 |
| Events in quadrant B | 2,604,437 | 635,735 |
| Events in quadrant C | 2,636,403 | 599,497 |
| Events in quadrant D | 2,587,459 | 556,450 |
| Mode M9 | |||
|---|---|---|---|
| Quadrant | BADHDUFLAG | Total packets | Discarded packets |
| A | 0 | 18 | 0 |
| B | 0 | 18 | 0 |
| C | 0 | 18 | 0 |
| D | 0 | 19 | 0 |
| Mode M0 | |||
|---|---|---|---|
| Quadrant | BADHDUFLAG | Total packets | Discarded packets |
| A | 0 | 25095 | 3 |
| B | 0 | 11212 | 2 |
| C | 0 | 10973 | 2 |
| D | 0 | 11339 | 2 |
| Mode SS | |||
|---|---|---|---|
| Quadrant | BADHDUFLAG | Total packets | Discarded packets |
| A | 0 | 110 | 0 |
| B | 0 | 110 | 0 |
| C | 0 | 110 | 0 |
| D | 0 | 110 | 0 |
| Quadrant | Total seconds | Saturated seconds | Saturation percentage |
|---|---|---|---|
| A | 5339 | 1001 | 18.748829% |
| B | 5339 | 27 | 0.505713% |
| C | 5339 | 3 | 0.056190% |
| D | 5339 | 29 | 0.543173% |
Noise dominated data is calculated using 1-second bins in cleaned event files. If a bin has >2000 counts, and if more than 50% of those come from <1% of pixels, then it is considered to be noise-dominated and hence unusable.
| Quadrant | # 1 sec bins | Bins with >0 counts | Bins with >2000 counts | High rate bins dominated by noise | Noise dominated (total time) | Noise dominated (detector-on time) | Marked lightcurve |
|---|---|---|---|---|---|---|---|
| A | 7102 | 5340 | 945 | 945 | 13.31% | 17.70% | 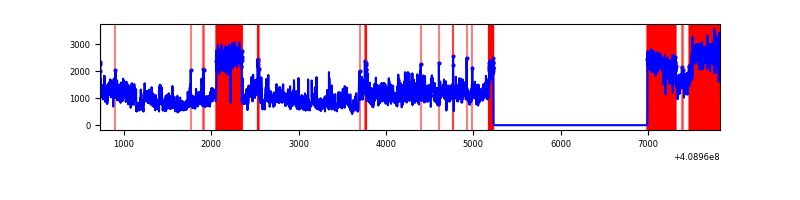 |
| B | 7102 | 5340 | 11 | 11 | 0.15% | 0.21% | 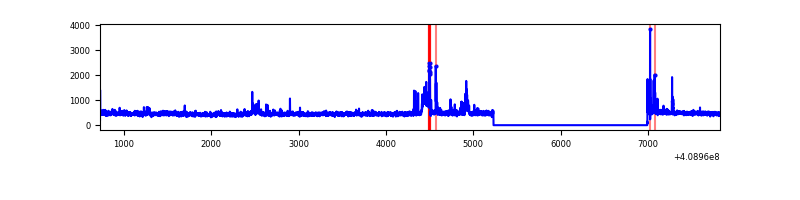 |
| C | 7102 | 5340 | 1 | 1 | 0.01% | 0.02% | 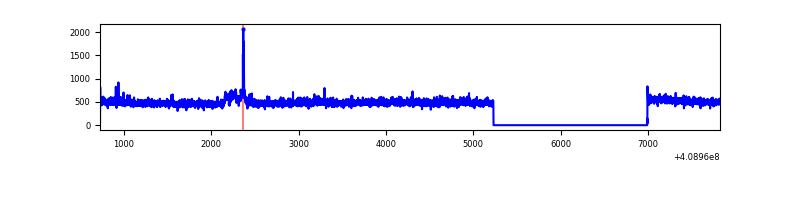 |
| D | 7102 | 5340 | 22 | 22 | 0.31% | 0.41% | 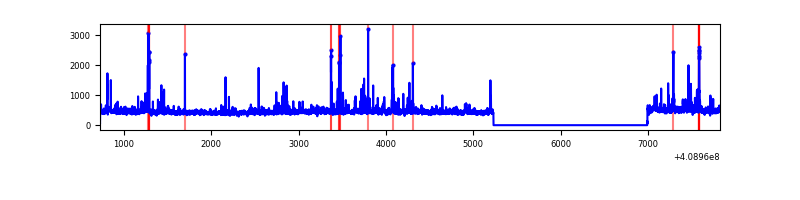 |
Top three noisy pixels from each quadrant. If the there are fewer than three noisy pixels in the level2.evt file, extra rows are filled as -1
| Pixel properties | Quadrant properties | ||||||
|---|---|---|---|---|---|---|---|
| Quadrant | DetID | PixID | Counts | Sigma | Mean | Median | Sigma |
| A | 15 | 222 | 4567479 | 40162.81 | 558 | 547 | 113.7 |
| A | 10 | 83 | 369937 | 3248.51 | 558 | 547 | 113.7 |
| A | 9 | 143 | 22906 | 196.63 | 558 | 547 | 113.7 |
| B | 5 | 172 | 140029 | 1192.93 | 607 | 591 | 116.9 |
| B | 5 | 184 | 30773 | 258.21 | 607 | 591 | 116.9 |
| B | 0 | 190 | 23910 | 199.5 | 607 | 591 | 116.9 |
| C | 15 | 214 | 225064 | 1606.54 | 598 | 601 | 139.7 |
| C | 10 | 20 | 58583 | 414.99 | 598 | 601 | 139.7 |
| C | 2 | 16 | 11469 | 77.79 | 598 | 601 | 139.7 |
| D | 2 | 249 | 104535 | 707.79 | 599 | 581 | 146.9 |
| D | 12 | 227 | 41448 | 278.25 | 599 | 581 | 146.9 |
| D | 2 | 250 | 37714 | 252.83 | 599 | 581 | 146.9 |
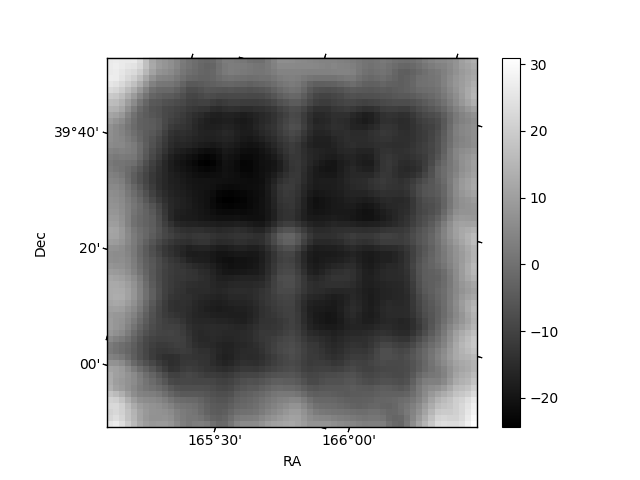
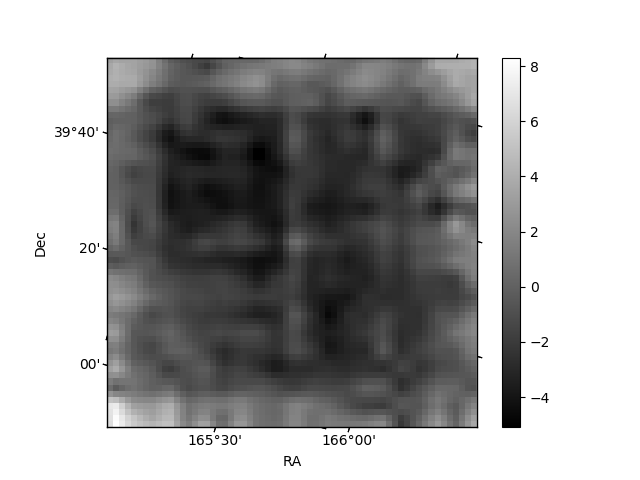
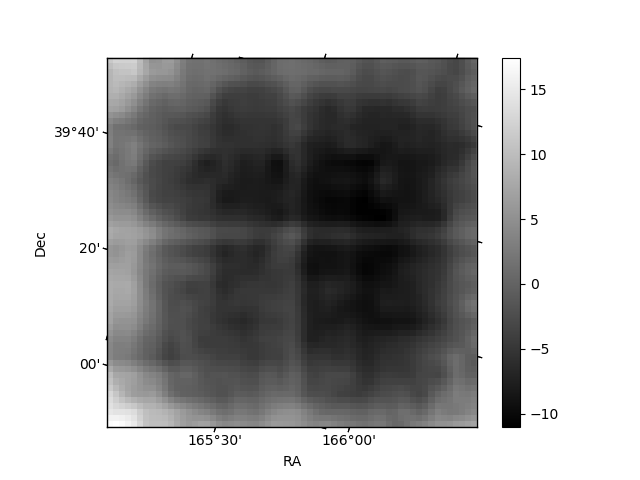
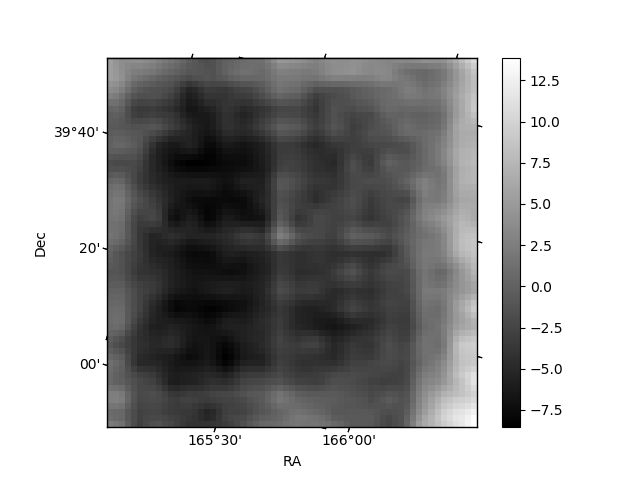
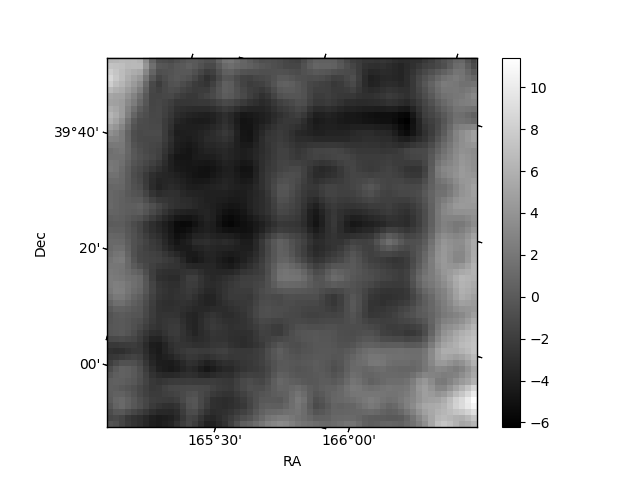
Histogram calculated using DETX and DETY for each event in the final _common_clean file
| Quadrant A | 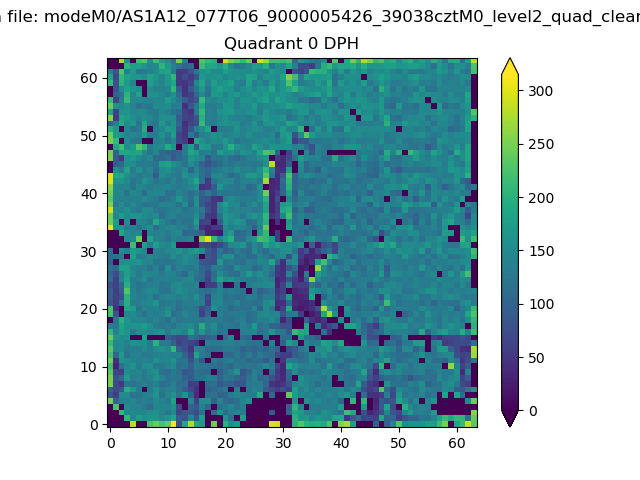 |
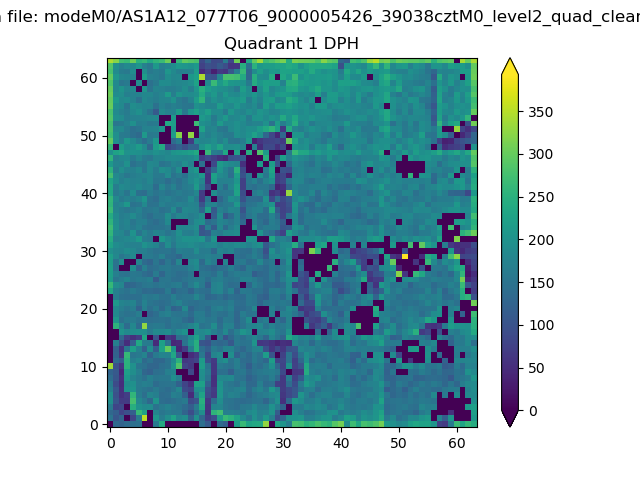 |
Quadrant B |
|---|---|---|---|
| Quadrant D |  |
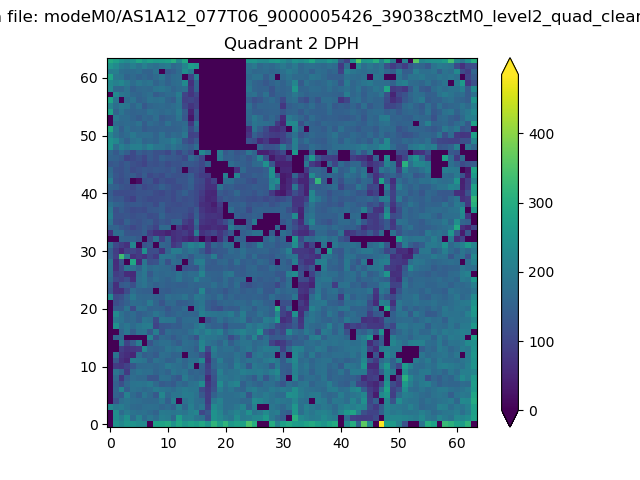 |
Quadrant C |
| Plot type | Count rate plots | Images |
|---|---|---|
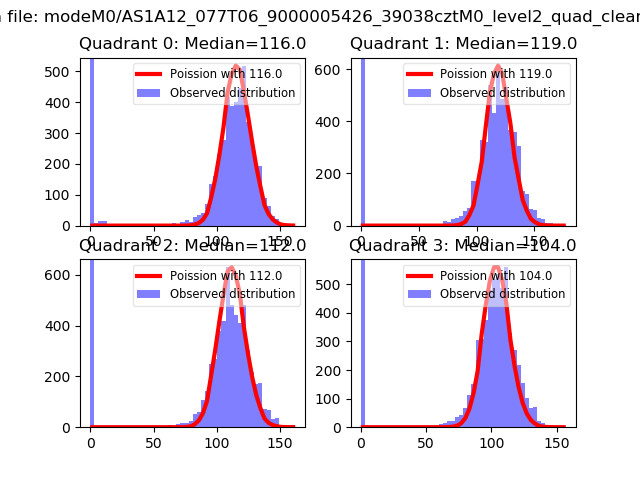
| Comparison with Poisson distribution Blue bars denote a histogram of data divided into 1 sec bins. Red curve is a Poisson curve with rate = median count rate of data. |
 |
 |
| Quadrant-wise count rates Data is divided into 100 sec bins |
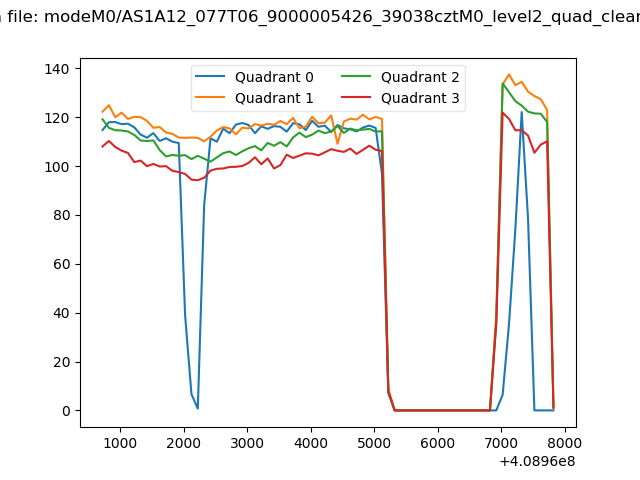 |
|
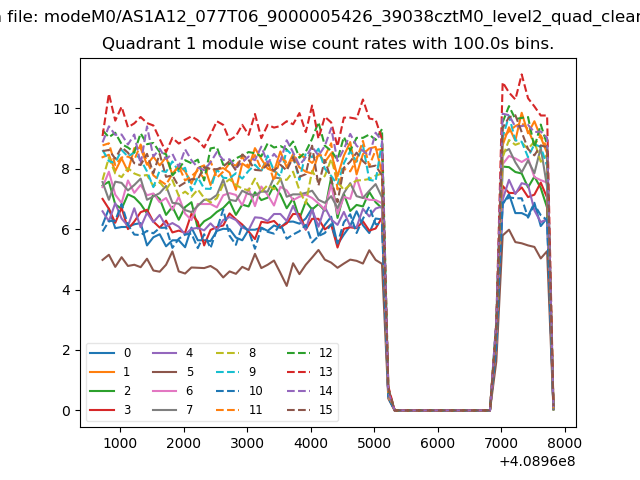
| Module-wise count rates for Quadrant A Data is divided into 100 sec bins |
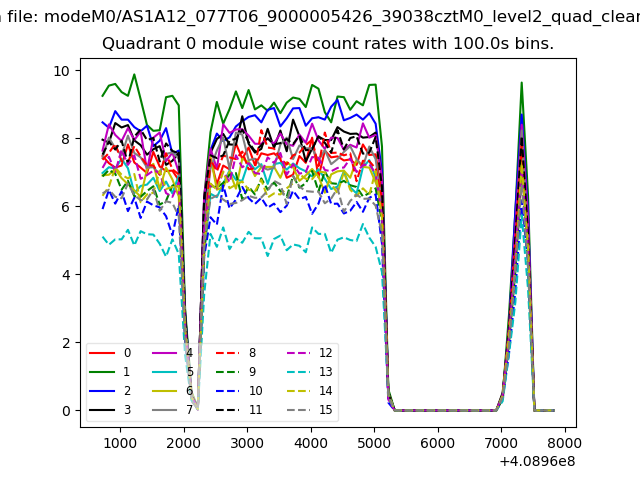 |
 |
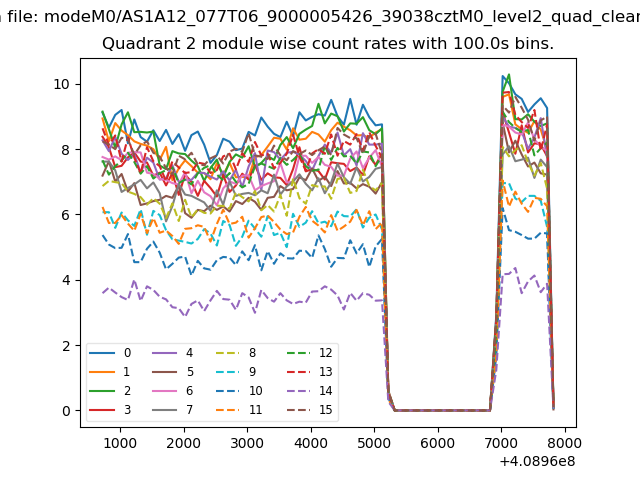
| Module-wise count rates for Quadrant B Data is divided into 100 sec bins |
 |
 |
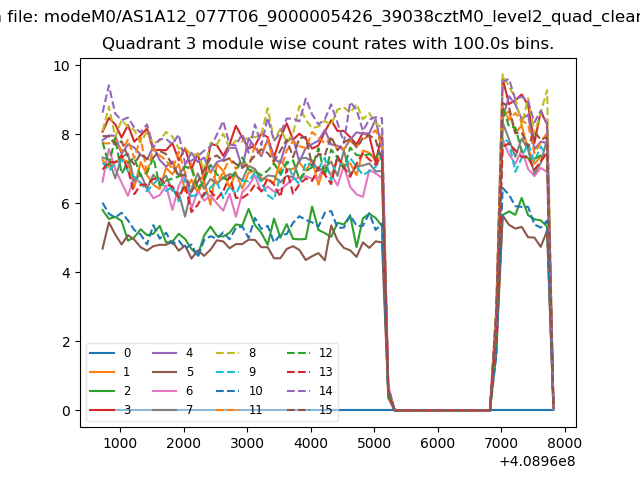
| Module-wise count rates for Quadrant C Data is divided into 100 sec bins |
 |
 |
| Module-wise count rates for Quadrant D Data is divided into 100 sec bins |
 |
 |
| Parameter | Plot |
|---|---|
| CZT HV Monitor | 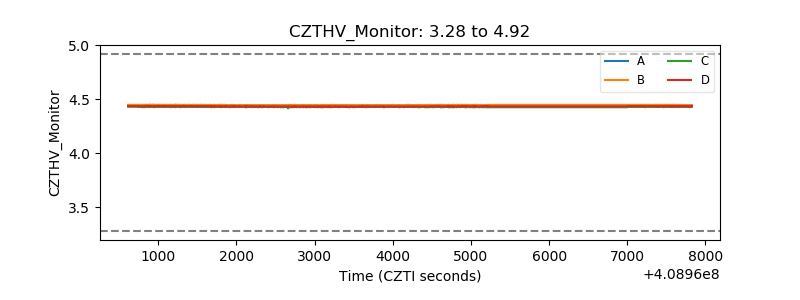 |
| D_VDD | 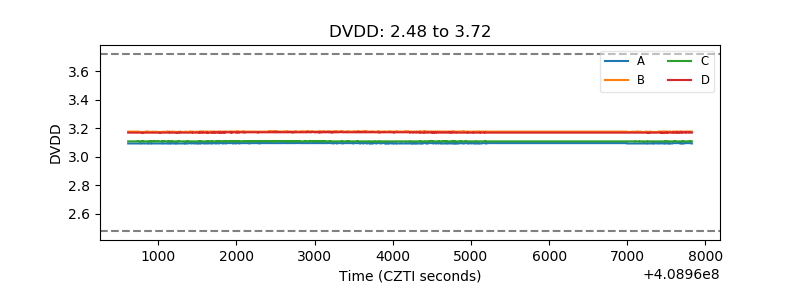 |
| Temperature 1 | 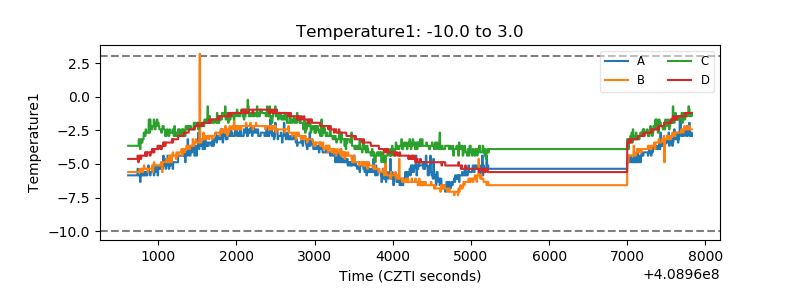 |
| Veto HV Monitor | 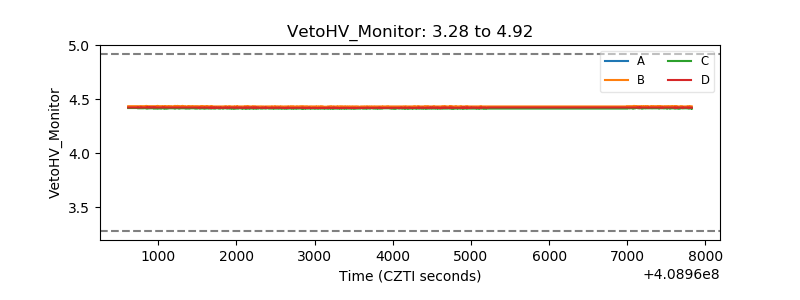 |
| Veto LLD | 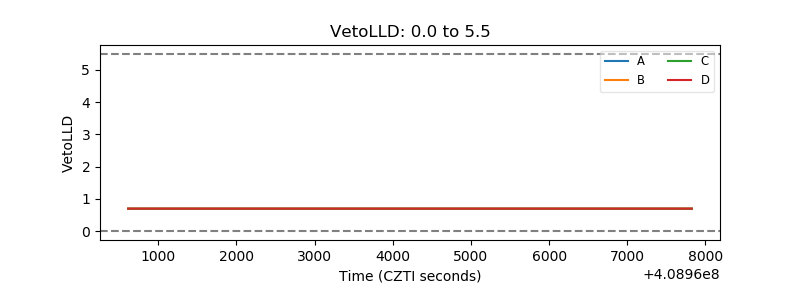 |
| Alpha Counter | 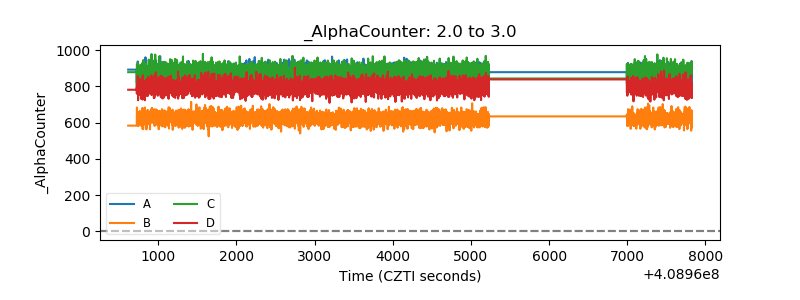 |
| _CPM_Rate | 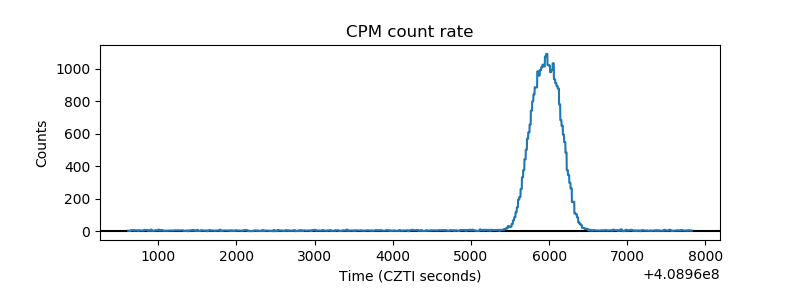 |
| CZT Counter | 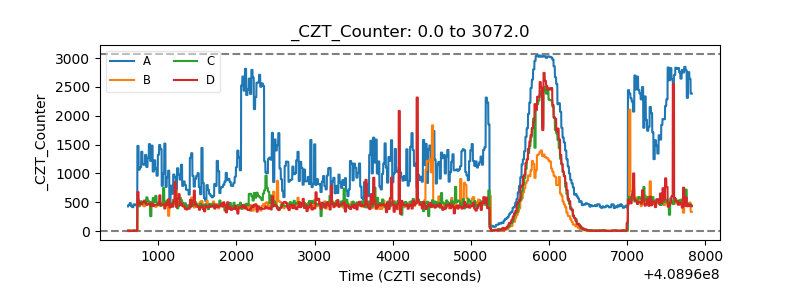 |
| +2.5 Volts monitor | 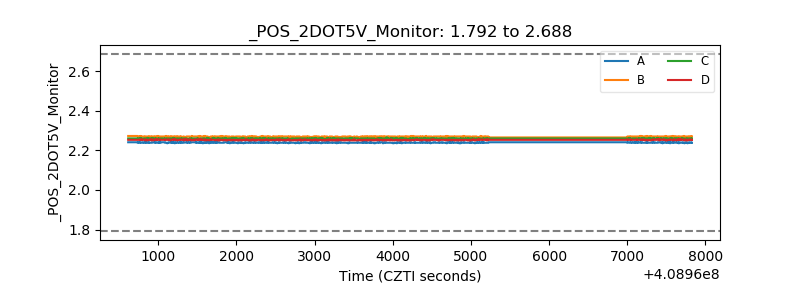 |
| +5 Volts monitor | 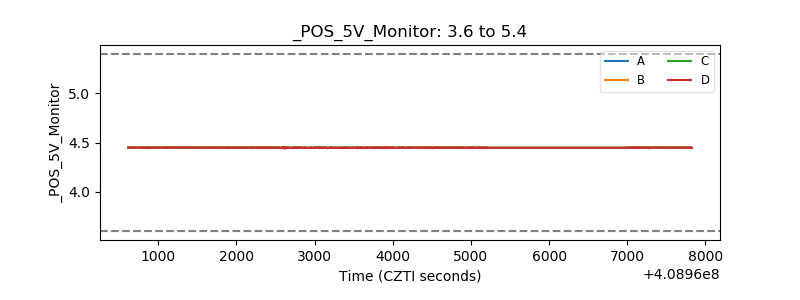 |
| _ROLL_ROT | 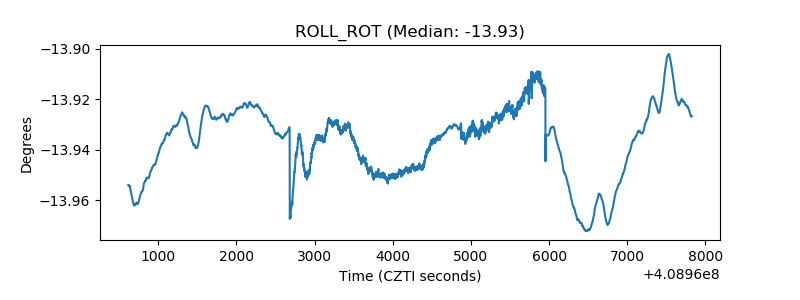 |
| _Roll_DEC | 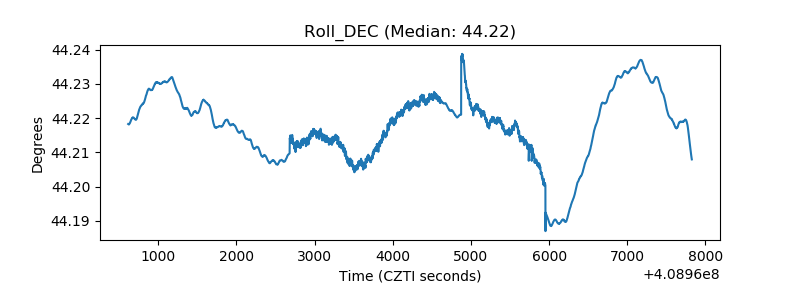 |
| _Roll_RA | 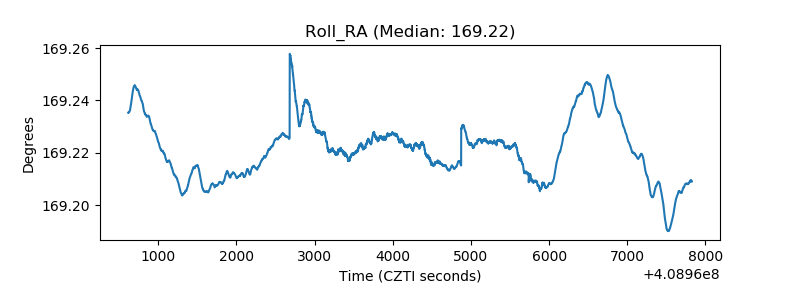 |
| Veto Counter | 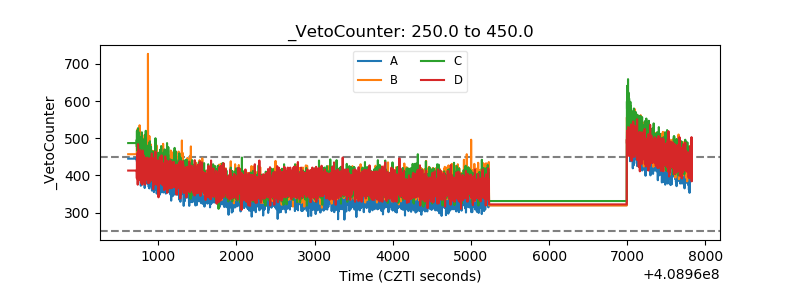 |