| Param | Original file | Final file |
|---|---|---|
| Filename | modeM0/AS1A12_077T06_9000005426_39039cztM0_level2.fits | modeM0/AS1A12_077T06_9000005426_39039cztM0_level2_quad_clean.evt |
| Size (bytes) | 497,926,080 | 85,334,400 |
| Size | 474.9 MB | 81.4 MB |
| Events in quadrant A | 10,132,662 | 365,814 |
| Events in quadrant B | 2,599,612 | 658,399 |
| Events in quadrant C | 2,631,934 | 620,154 |
| Events in quadrant D | 2,663,138 | 575,340 |
| Mode M9 | |||
|---|---|---|---|
| Quadrant | BADHDUFLAG | Total packets | Discarded packets |
| A | 0 | 24 | 0 |
| B | 0 | 24 | 0 |
| C | 0 | 24 | 0 |
| D | 0 | 25 | 0 |
| Mode M0 | |||
|---|---|---|---|
| Quadrant | BADHDUFLAG | Total packets | Discarded packets |
| A | 0 | 33708 | 3 |
| B | 0 | 10947 | 2 |
| C | 0 | 10796 | 2 |
| D | 0 | 11292 | 2 |
| Mode SS | |||
|---|---|---|---|
| Quadrant | BADHDUFLAG | Total packets | Discarded packets |
| A | 0 | 106 | 0 |
| B | 0 | 106 | 0 |
| C | 0 | 106 | 0 |
| D | 0 | 106 | 0 |
| Quadrant | Total seconds | Saturated seconds | Saturation percentage |
|---|---|---|---|
| A | 5199 | 2636 | 50.702058% |
| B | 5199 | 26 | 0.500096% |
| C | 5199 | 6 | 0.115407% |
| D | 5199 | 37 | 0.711675% |
Noise dominated data is calculated using 1-second bins in cleaned event files. If a bin has >2000 counts, and if more than 50% of those come from <1% of pixels, then it is considered to be noise-dominated and hence unusable.
| Quadrant | # 1 sec bins | Bins with >0 counts | Bins with >2000 counts | High rate bins dominated by noise | Noise dominated (total time) | Noise dominated (detector-on time) | Marked lightcurve |
|---|---|---|---|---|---|---|---|
| A | 7082 | 5200 | 2606 | 2606 | 36.80% | 50.12% | 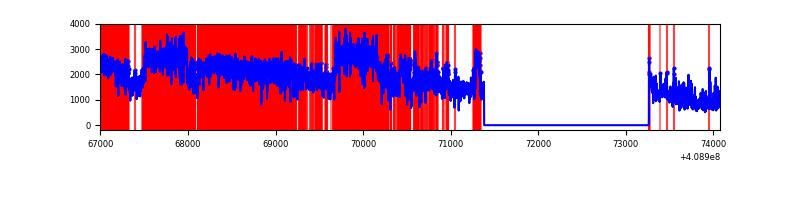 |
| B | 7082 | 5200 | 6 | 6 | 0.08% | 0.12% | 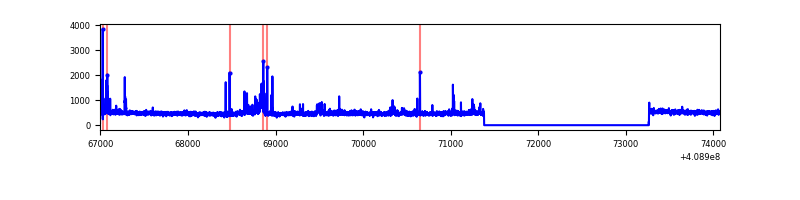 |
| C | 7082 | 5200 | 2 | 2 | 0.03% | 0.04% | 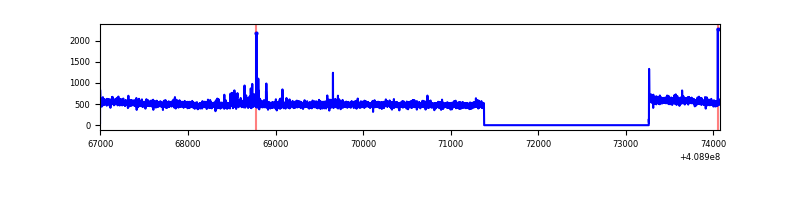 |
| D | 7082 | 5200 | 34 | 34 | 0.48% | 0.65% | 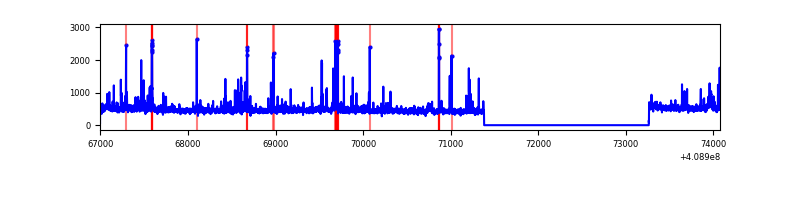 |
Top three noisy pixels from each quadrant. If the there are fewer than three noisy pixels in the level2.evt file, extra rows are filled as -1
| Pixel properties | Quadrant properties | ||||||
|---|---|---|---|---|---|---|---|
| Quadrant | DetID | PixID | Counts | Sigma | Mean | Median | Sigma |
| A | 15 | 222 | 7851936 | 80140.07 | 489 | 481 | 98.0 |
| A | 10 | 83 | 339039 | 3455.67 | 489 | 481 | 98.0 |
| A | 13 | 248 | 22908 | 228.91 | 489 | 481 | 98.0 |
| B | 5 | 184 | 90759 | 772.48 | 613 | 598 | 116.7 |
| B | 5 | 172 | 35504 | 299.07 | 613 | 598 | 116.7 |
| B | 15 | 85 | 28049 | 235.19 | 613 | 598 | 116.7 |
| C | 15 | 214 | 219380 | 1556.93 | 604 | 609 | 140.5 |
| C | 15 | 159 | 27189 | 189.16 | 604 | 609 | 140.5 |
| C | 1 | 128 | 9290 | 61.78 | 604 | 609 | 140.5 |
| D | 2 | 249 | 113702 | 760.76 | 607 | 590 | 148.7 |
| D | 13 | 171 | 63583 | 423.68 | 607 | 590 | 148.7 |
| D | 13 | 249 | 46649 | 309.78 | 607 | 590 | 148.7 |
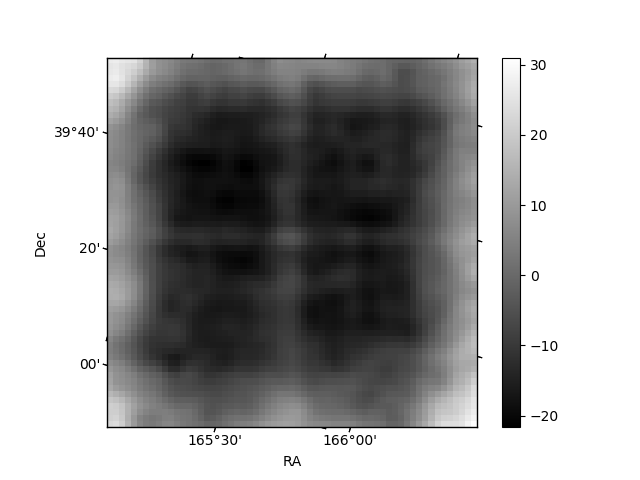
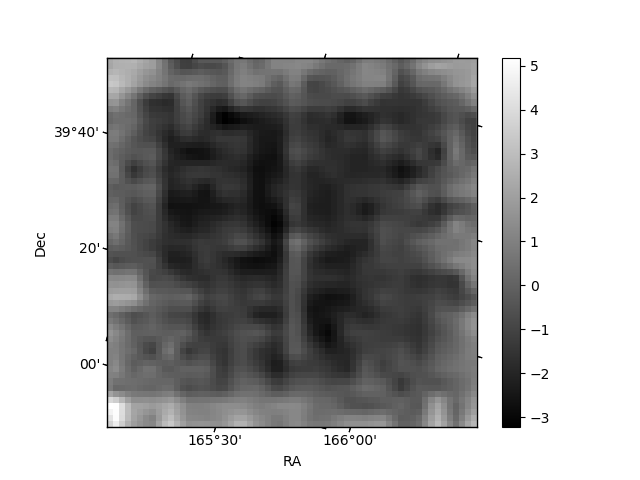
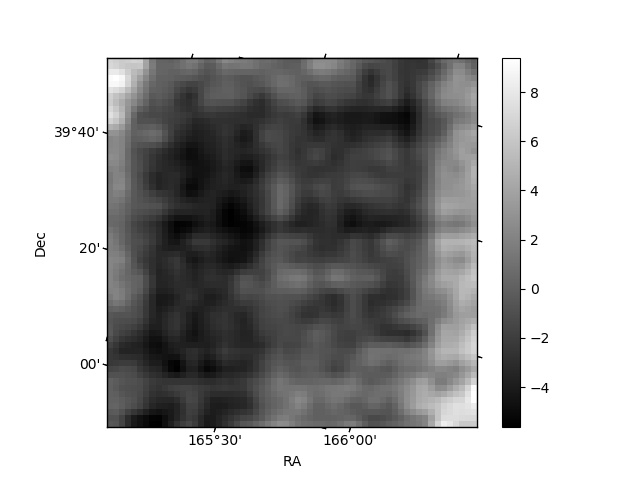
Histogram calculated using DETX and DETY for each event in the final _common_clean file
| Quadrant A | 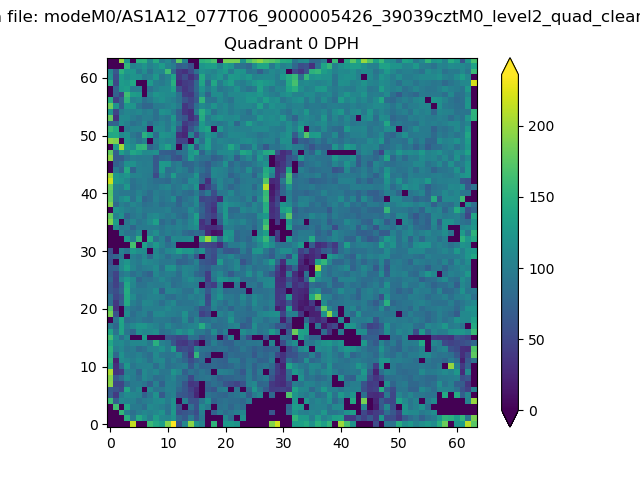 |
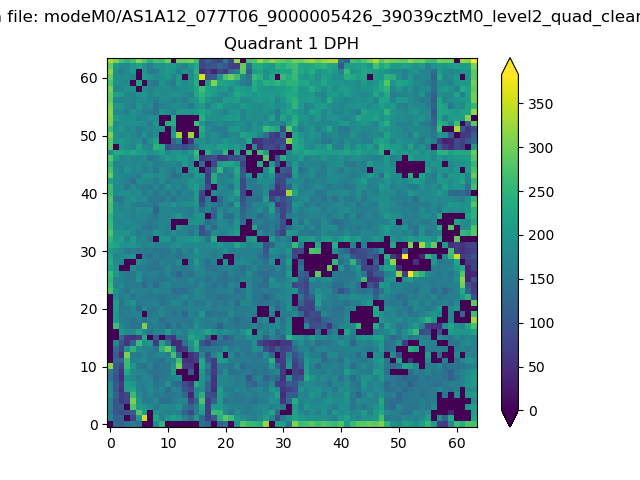 |
Quadrant B |
|---|---|---|---|
| Quadrant D | 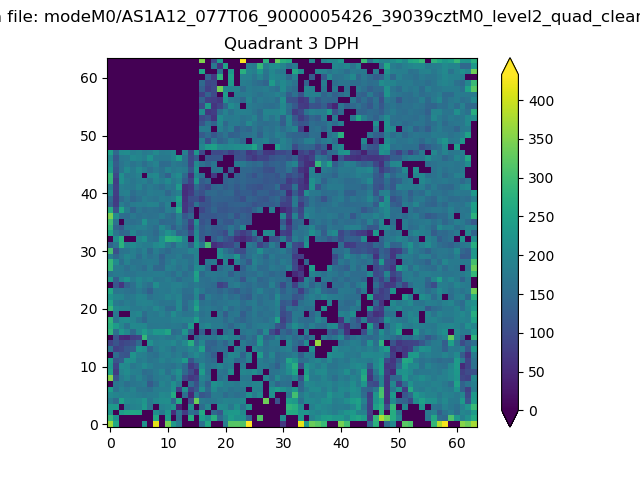 |
 |
Quadrant C |
| Plot type | Count rate plots | Images |
|---|---|---|
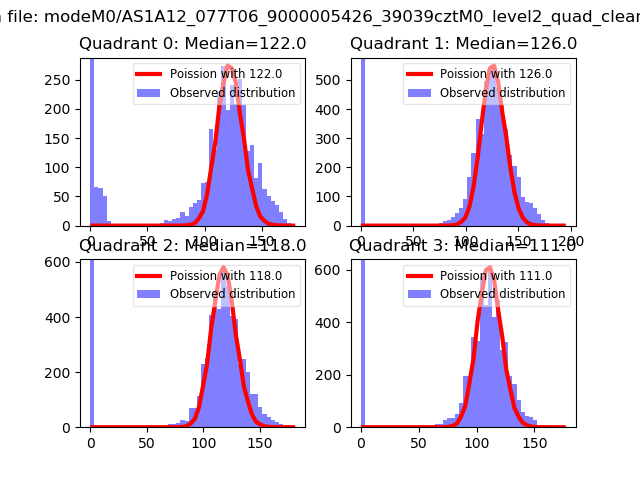
| Comparison with Poisson distribution Blue bars denote a histogram of data divided into 1 sec bins. Red curve is a Poisson curve with rate = median count rate of data. |
 |
 |
| Quadrant-wise count rates Data is divided into 100 sec bins |
 |
|
| Module-wise count rates for Quadrant A Data is divided into 100 sec bins |
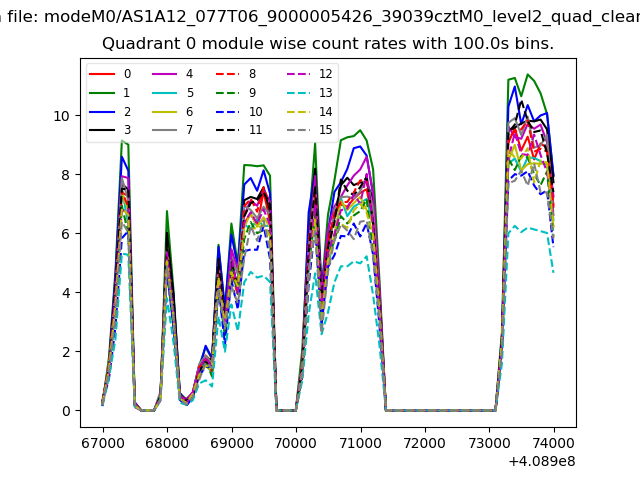 |
 |
| Module-wise count rates for Quadrant B Data is divided into 100 sec bins |
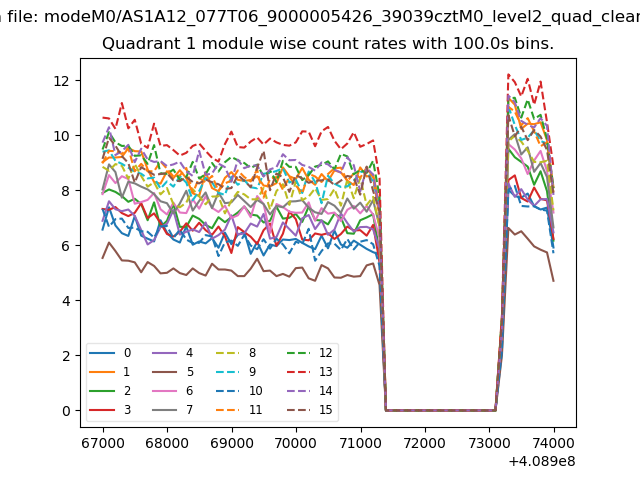 |
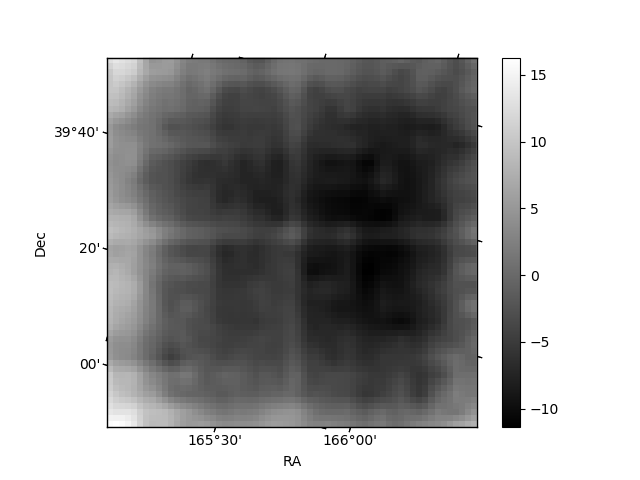 |
| Module-wise count rates for Quadrant C Data is divided into 100 sec bins |
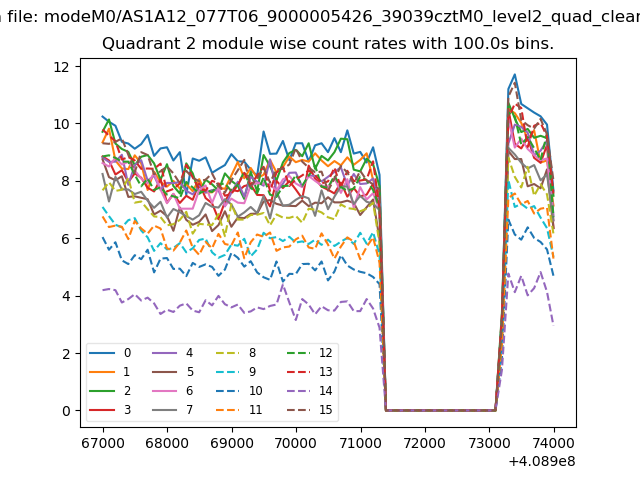 |
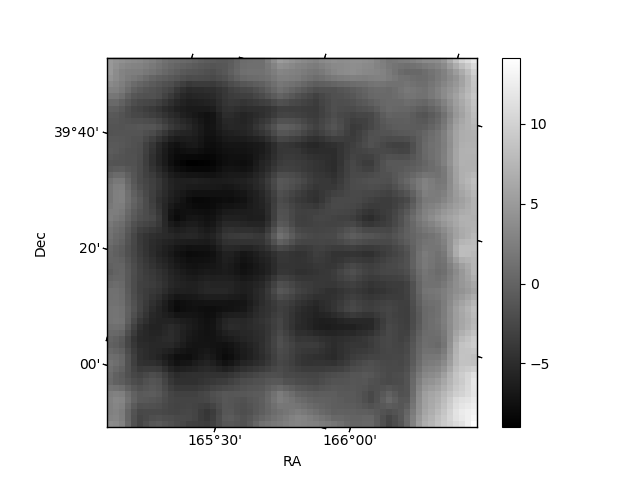 |
| Module-wise count rates for Quadrant D Data is divided into 100 sec bins |
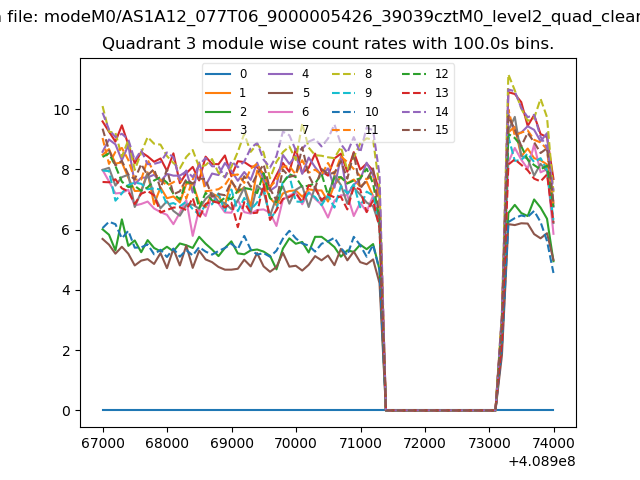 |
 |
| Parameter | Plot |
|---|---|
| CZT HV Monitor | 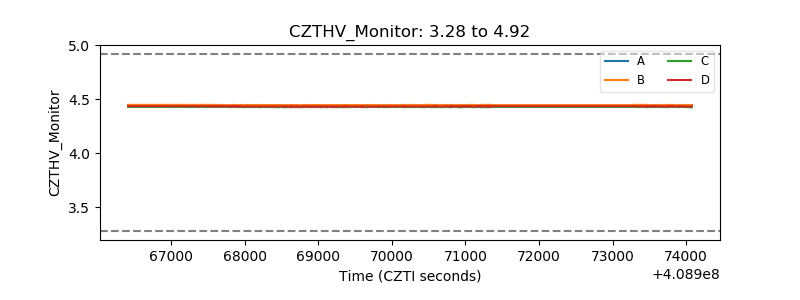 |
| D_VDD | 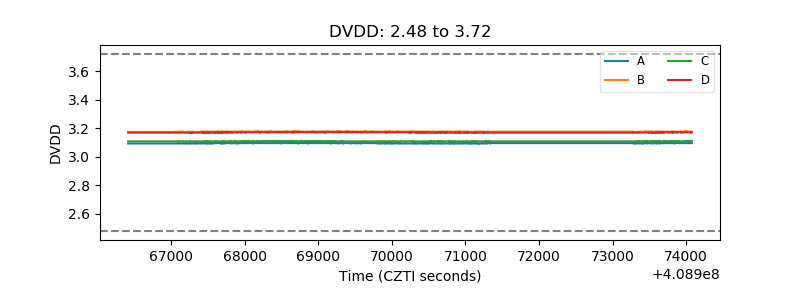 |
| Temperature 1 | 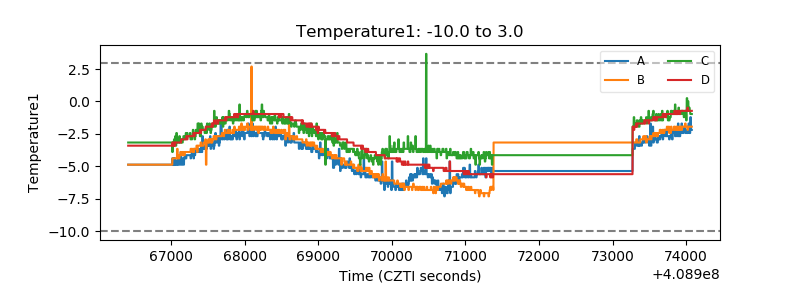 |
| Veto HV Monitor |  |
| Veto LLD | 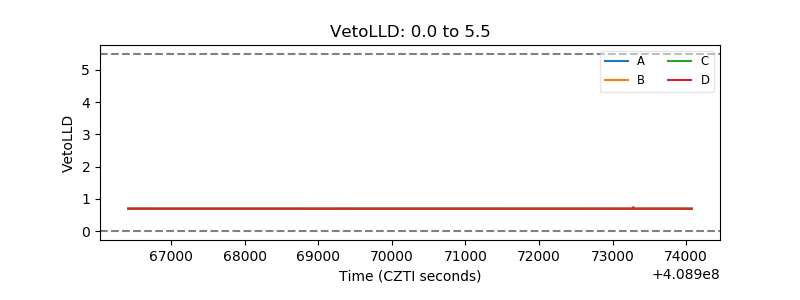 |
| Alpha Counter | 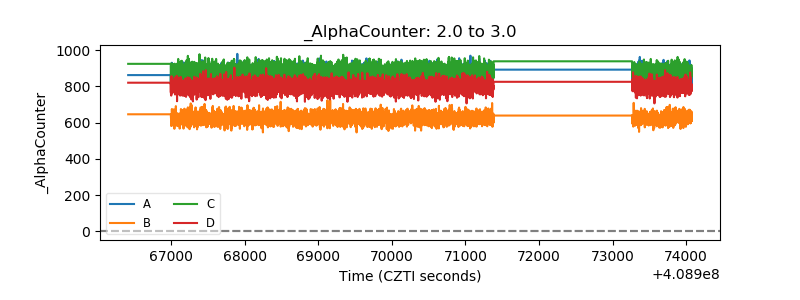 |
| _CPM_Rate | 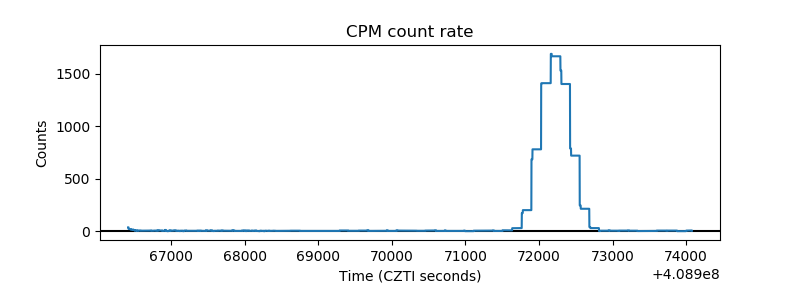 |
| CZT Counter | 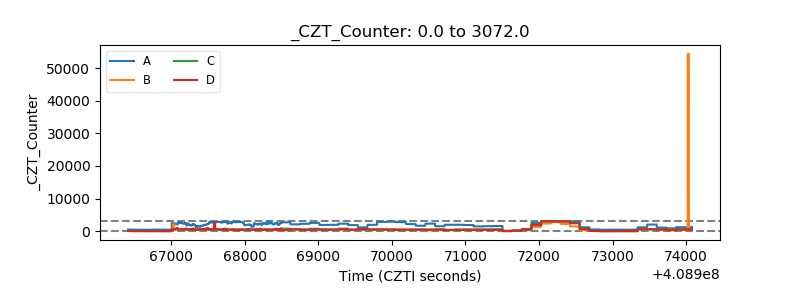 |
| +2.5 Volts monitor |  |
| +5 Volts monitor | 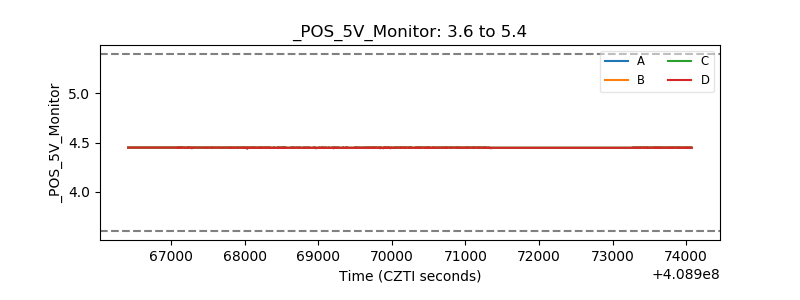 |
| _ROLL_ROT | 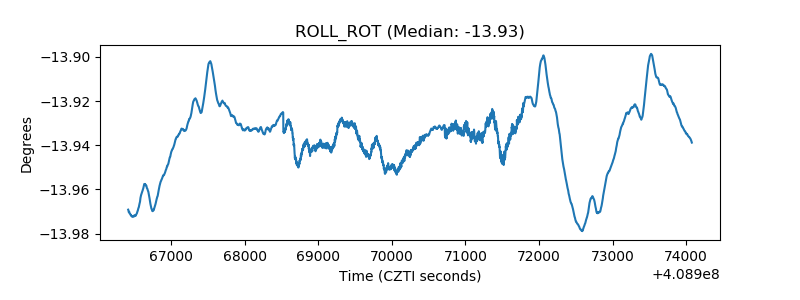 |
| _Roll_DEC | 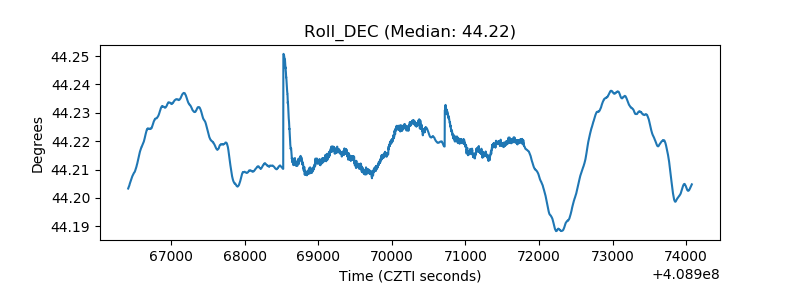 |
| _Roll_RA | 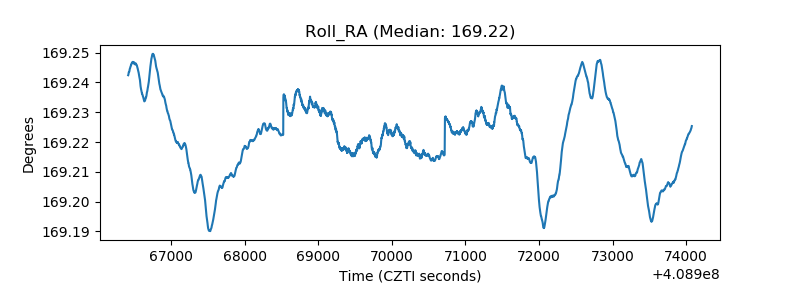 |
| Veto Counter | 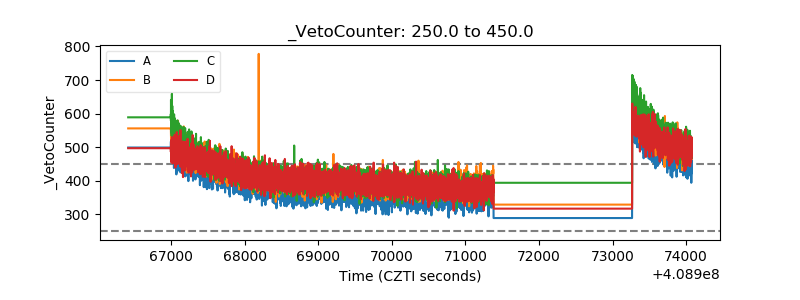 |