| Param | Original file | Final file |
|---|---|---|
| Filename | modeM0/AS1A12_077T06_9000005426_39040cztM0_level2.fits | modeM0/AS1A12_077T06_9000005426_39040cztM0_level2_quad_clean.evt |
| Size (bytes) | 236,940,480 | 58,553,280 |
| Size | 226.0 MB | 55.8 MB |
| Events in quadrant A | 3,621,827 | 370,802 |
| Events in quadrant B | 1,530,458 | 419,590 |
| Events in quadrant C | 1,637,233 | 393,639 |
| Events in quadrant D | 1,735,919 | 366,627 |
| Mode M9 | |||
|---|---|---|---|
| Quadrant | BADHDUFLAG | Total packets | Discarded packets |
| A | 0 | 3 | 0 |
| B | 0 | 3 | 0 |
| C | 0 | 3 | 0 |
| D | 0 | 4 | 0 |
| Mode M0 | |||
|---|---|---|---|
| Quadrant | BADHDUFLAG | Total packets | Discarded packets |
| A | 0 | 12975 | 1 |
| B | 0 | 6414 | 1 |
| C | 0 | 6593 | 1 |
| D | 0 | 7120 | 1 |
| Mode SS | |||
|---|---|---|---|
| Quadrant | BADHDUFLAG | Total packets | Discarded packets |
| A | 0 | 62 | 0 |
| B | 0 | 62 | 0 |
| C | 0 | 62 | 0 |
| D | 0 | 62 | 0 |
| Quadrant | Total seconds | Saturated seconds | Saturation percentage |
|---|---|---|---|
| A | 3134 | 406 | 12.954690% |
| B | 3134 | 5 | 0.159541% |
| C | 3134 | 3 | 0.095724% |
| D | 3134 | 23 | 0.733886% |
Noise dominated data is calculated using 1-second bins in cleaned event files. If a bin has >2000 counts, and if more than 50% of those come from <1% of pixels, then it is considered to be noise-dominated and hence unusable.
| Quadrant | # 1 sec bins | Bins with >0 counts | Bins with >2000 counts | High rate bins dominated by noise | Noise dominated (total time) | Noise dominated (detector-on time) | Marked lightcurve |
|---|---|---|---|---|---|---|---|
| A | 3134 | 3134 | 345 | 345 | 11.01% | 11.01% | 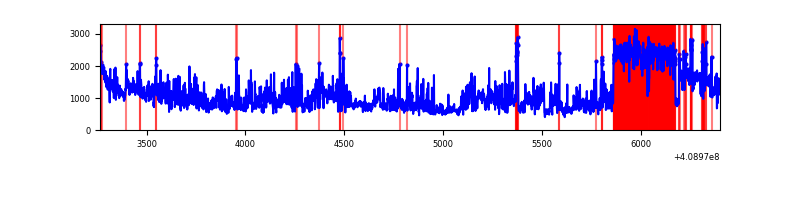 |
| B | 3134 | 3134 | 2 | 2 | 0.06% | 0.06% | 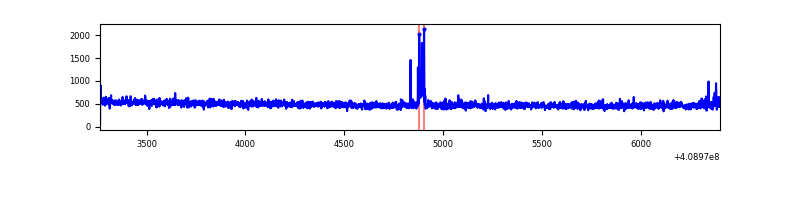 |
| C | 3134 | 3134 | 1 | 1 | 0.03% | 0.03% | 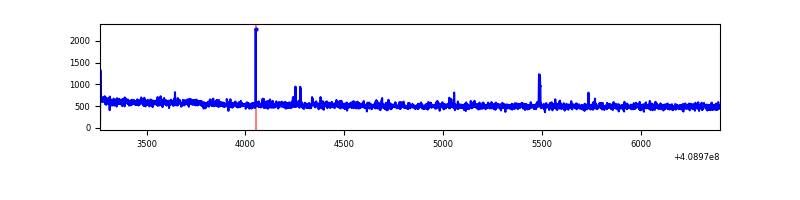 |
| D | 3134 | 3134 | 23 | 23 | 0.73% | 0.73% | 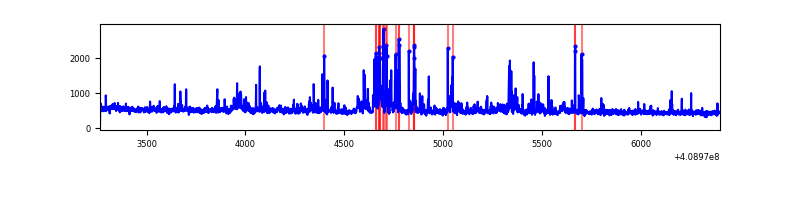 |
Top three noisy pixels from each quadrant. If the there are fewer than three noisy pixels in the level2.evt file, extra rows are filled as -1
| Pixel properties | Quadrant properties | ||||||
|---|---|---|---|---|---|---|---|
| Quadrant | DetID | PixID | Counts | Sigma | Mean | Median | Sigma |
| A | 15 | 222 | 1888719 | 24996.17 | 373 | 367 | 75.5 |
| A | 10 | 83 | 237447 | 3138.23 | 373 | 367 | 75.5 |
| A | 6 | 10 | 28995 | 378.95 | 373 | 367 | 75.5 |
| B | 15 | 85 | 25193 | 341.98 | 381 | 371 | 72.6 |
| B | 12 | 111 | 8698 | 114.72 | 381 | 371 | 72.6 |
| B | 11 | 111 | 8151 | 107.19 | 381 | 371 | 72.6 |
| C | 15 | 214 | 129689 | 1467.25 | 376 | 379 | 88.1 |
| C | 3 | 233 | 13489 | 148.76 | 376 | 379 | 88.1 |
| C | 2 | 16 | 10067 | 109.93 | 376 | 379 | 88.1 |
| D | 2 | 249 | 133661 | 1422.07 | 380 | 370 | 93.7 |
| D | 2 | 250 | 73676 | 782.1 | 380 | 370 | 93.7 |
| D | 12 | 233 | 26482 | 278.59 | 380 | 370 | 93.7 |
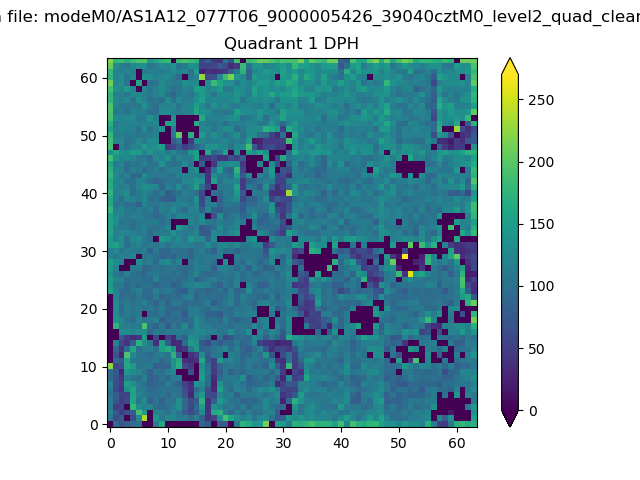
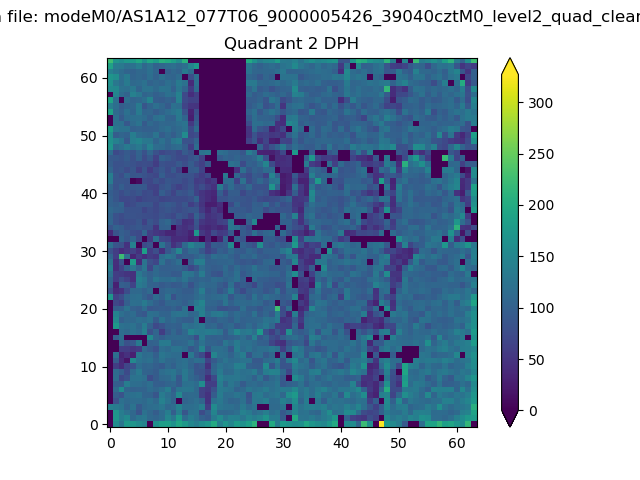
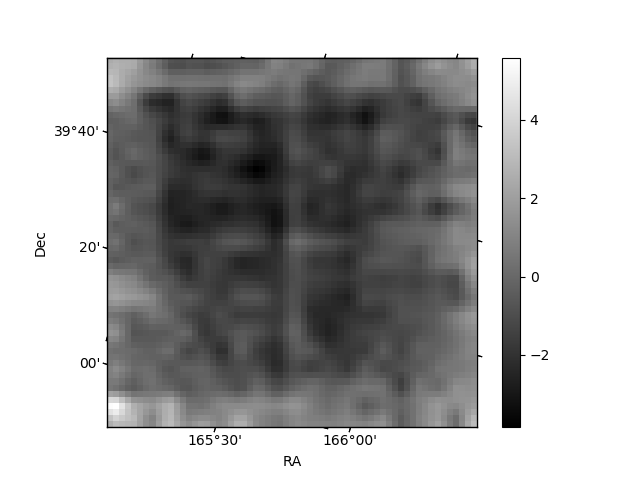
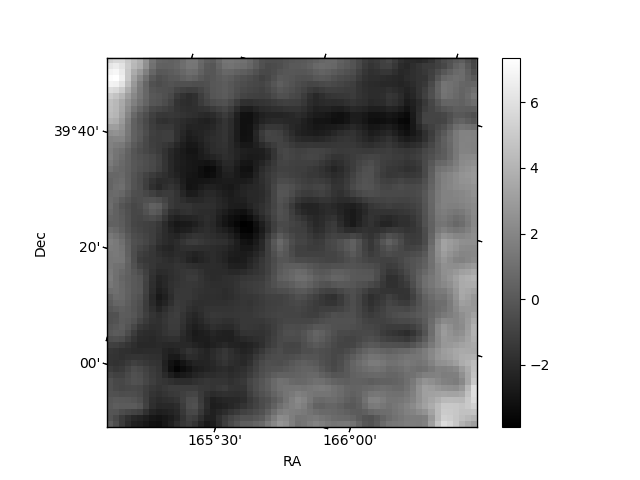
Histogram calculated using DETX and DETY for each event in the final _common_clean file
| Quadrant A |  |
 |
Quadrant B |
|---|---|---|---|
| Quadrant D | 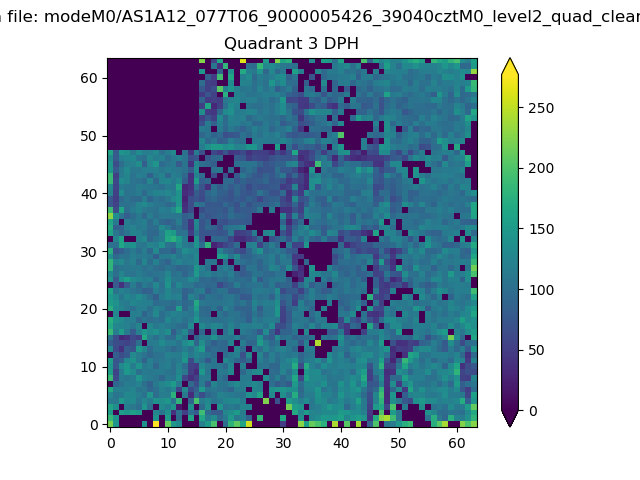 |
 |
Quadrant C |
| Plot type | Count rate plots | Images |
|---|---|---|
| Comparison with Poisson distribution Blue bars denote a histogram of data divided into 1 sec bins. Red curve is a Poisson curve with rate = median count rate of data. |
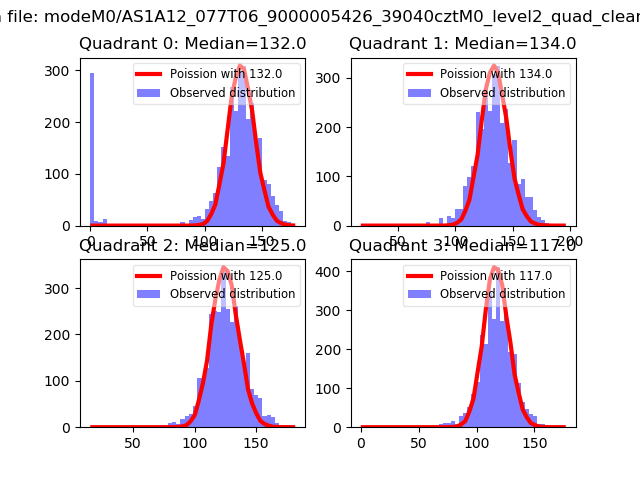 |
 |
| Quadrant-wise count rates Data is divided into 100 sec bins |
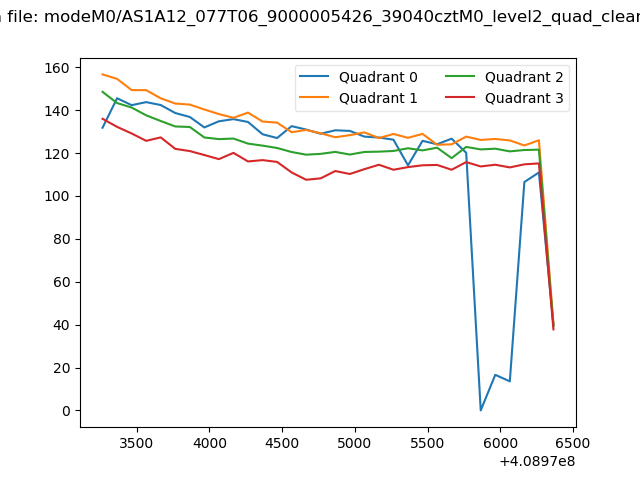 |
|
| Module-wise count rates for Quadrant A Data is divided into 100 sec bins |
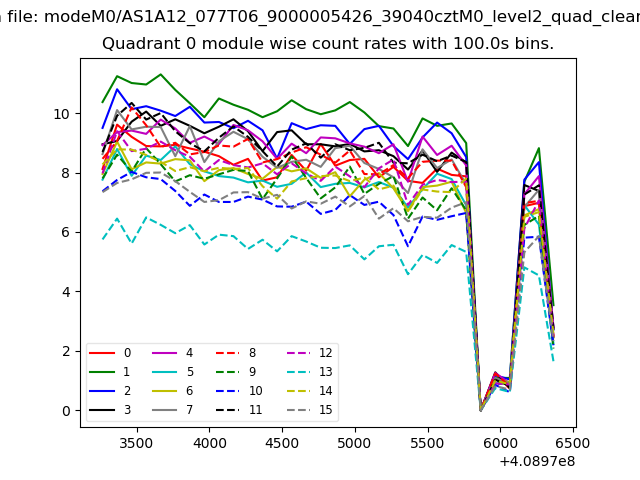 |
 |
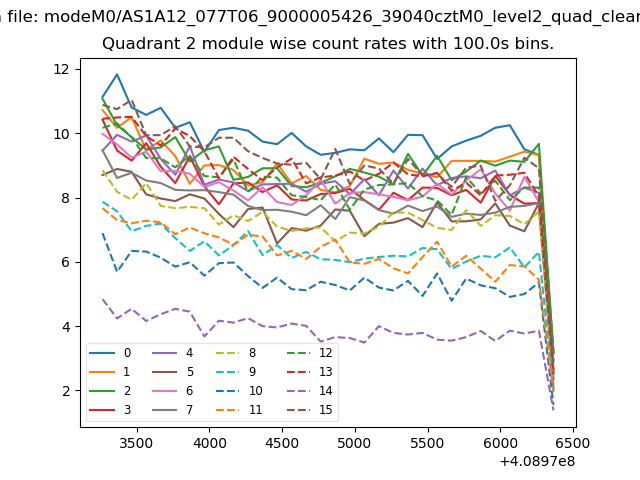
| Module-wise count rates for Quadrant B Data is divided into 100 sec bins |
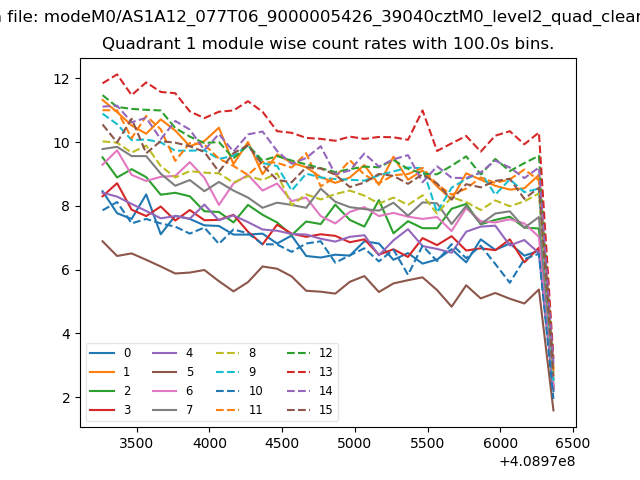 |
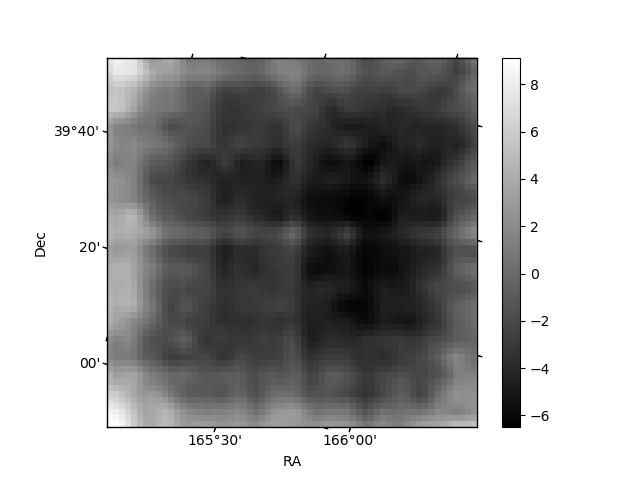 |
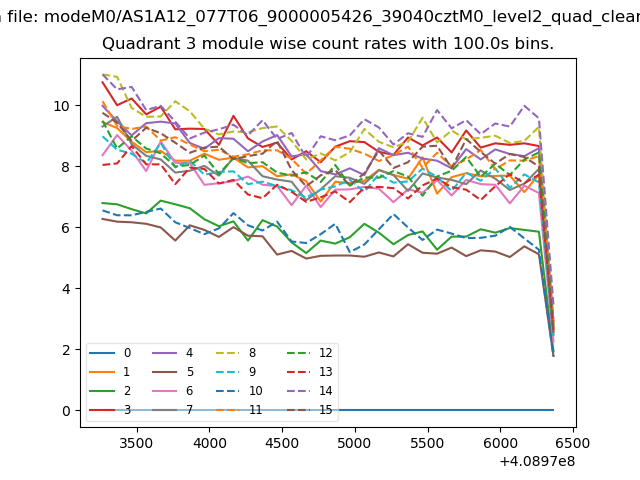
| Module-wise count rates for Quadrant C Data is divided into 100 sec bins |
 |
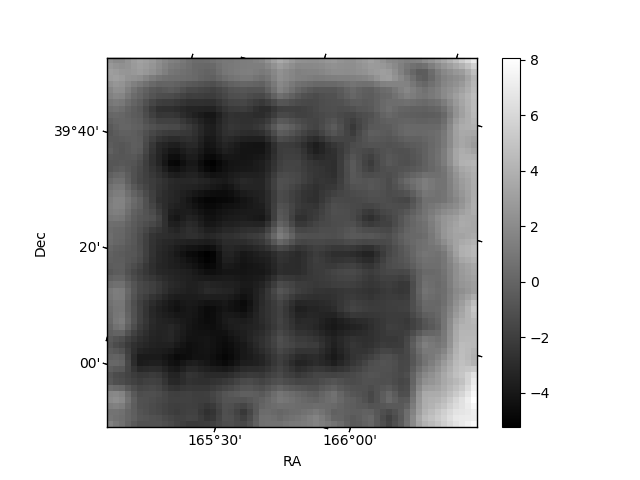 |
| Module-wise count rates for Quadrant D Data is divided into 100 sec bins |
 |
 |
| Parameter | Plot |
|---|---|
| CZT HV Monitor | 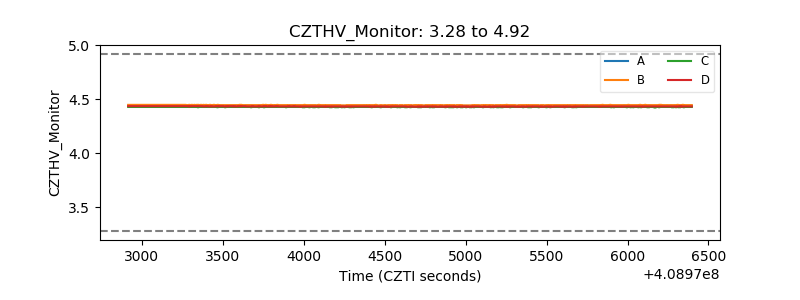 |
| D_VDD | 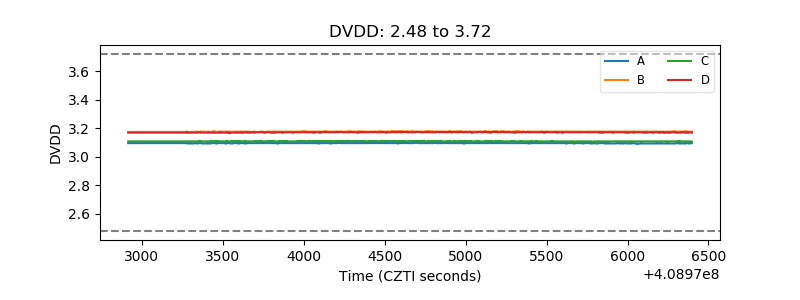 |
| Temperature 1 | 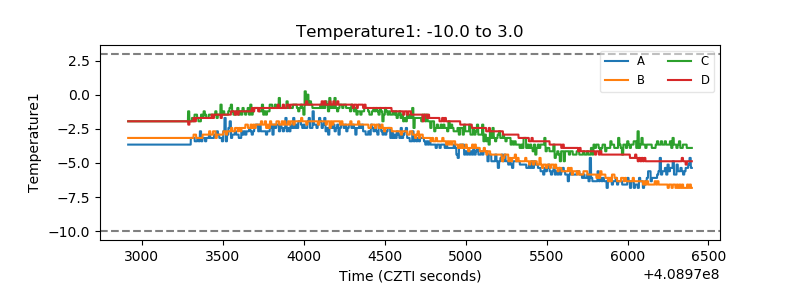 |
| Veto HV Monitor | 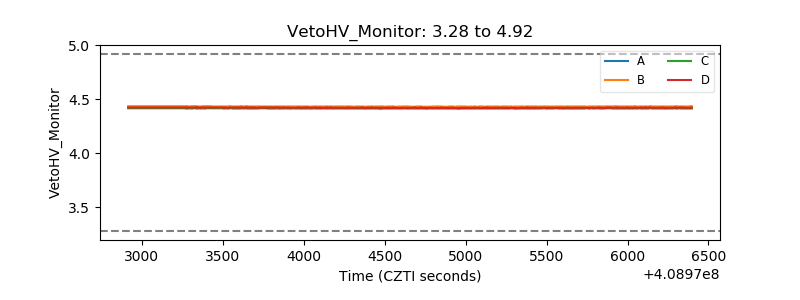 |
| Veto LLD | 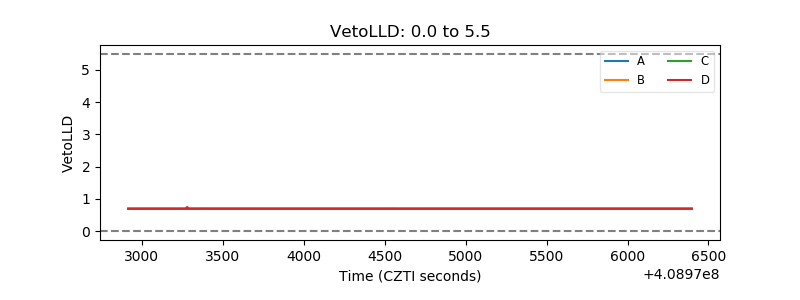 |
| Alpha Counter | 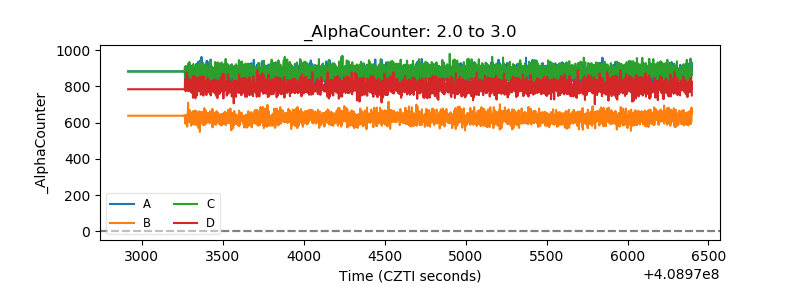 |
| _CPM_Rate | 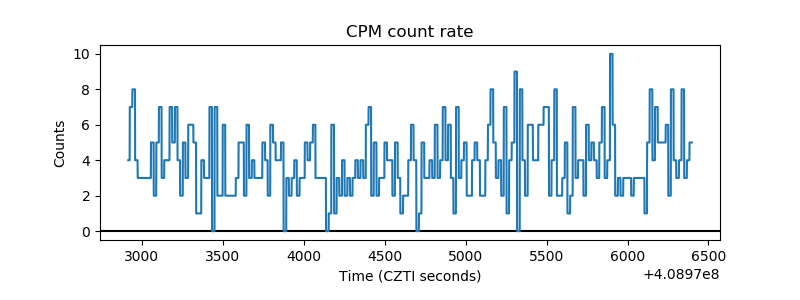 |
| CZT Counter | 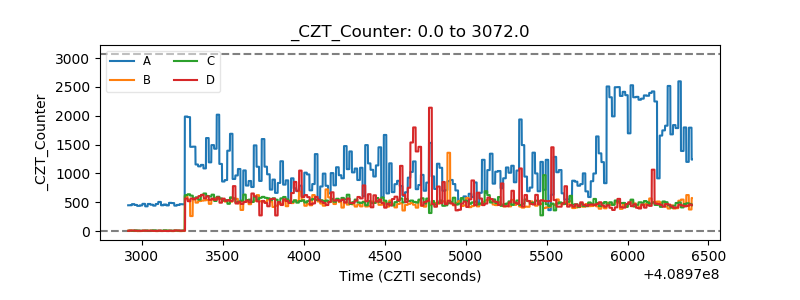 |
| +2.5 Volts monitor | 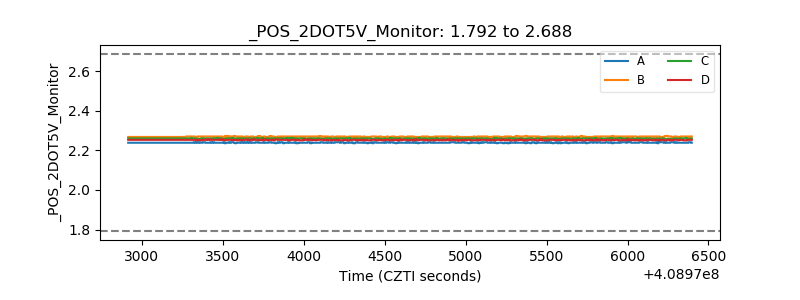 |
| +5 Volts monitor | 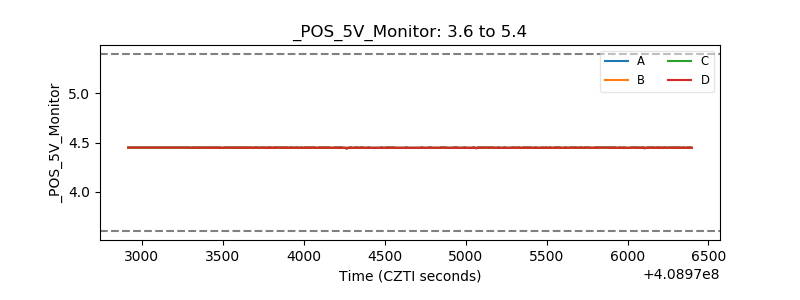 |
| _ROLL_ROT | 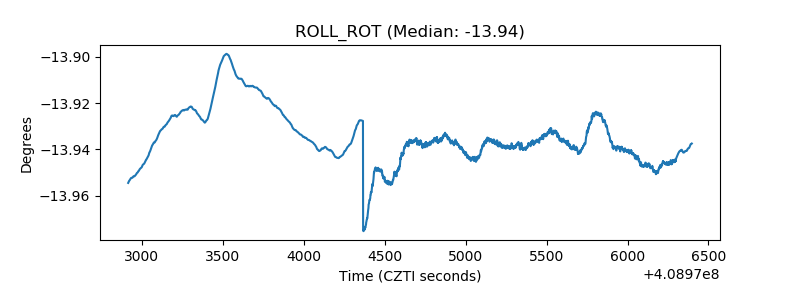 |
| _Roll_DEC | 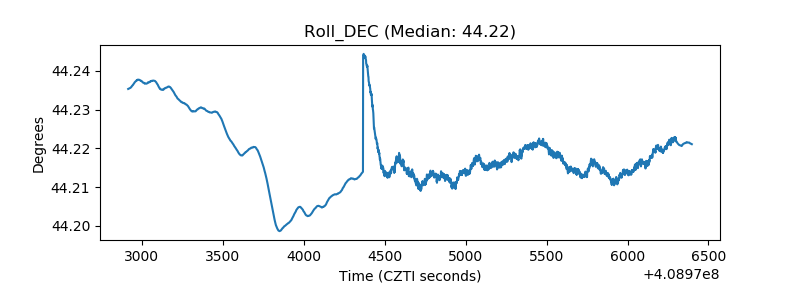 |
| _Roll_RA | 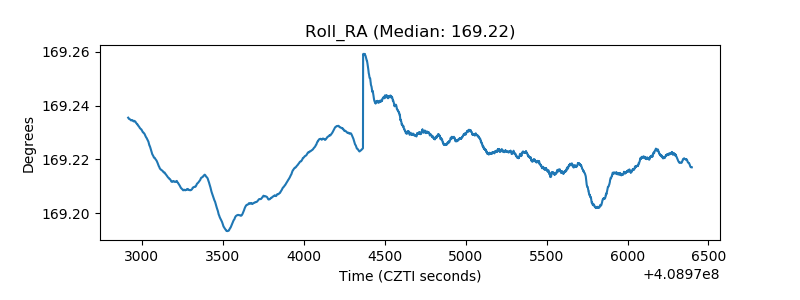 |
| Veto Counter | 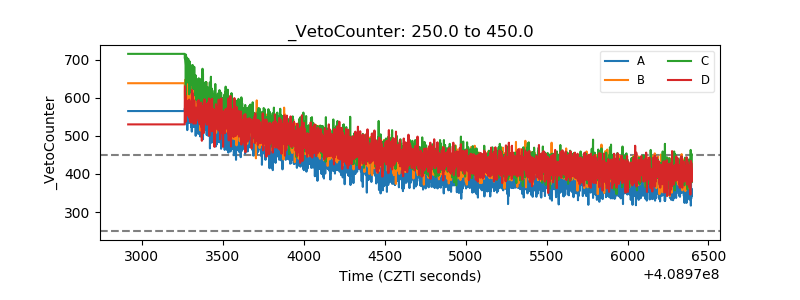 |