| Param | Original file | Final file |
|---|---|---|
| Filename | modeM0/AS1C06_010T05_9000005424_39006cztM0_level2.fits | modeM0/AS1C06_010T05_9000005424_39006cztM0_level2_quad_clean.evt |
| Size (bytes) | 653,702,400 | 173,770,560 |
| Size | 623.4 MB | 165.7 MB |
| Events in quadrant A | 7,017,492 | 1,141,310 |
| Events in quadrant B | 5,581,847 | 1,187,624 |
| Events in quadrant C | 5,006,713 | 1,144,106 |
| Events in quadrant D | 5,767,920 | 1,052,987 |
| Mode SS | |||
|---|---|---|---|
| Quadrant | BADHDUFLAG | Total packets | Discarded packets |
| A | 0 | 216 | 0 |
| B | 0 | 216 | 0 |
| C | 0 | 216 | 0 |
| D | 0 | 216 | 0 |
| Mode M9 | |||
|---|---|---|---|
| Quadrant | BADHDUFLAG | Total packets | Discarded packets |
| A | 0 | 34 | 0 |
| B | 0 | 34 | 0 |
| C | 0 | 34 | 0 |
| D | 0 | 34 | 0 |
| Mode M0 | |||
|---|---|---|---|
| Quadrant | BADHDUFLAG | Total packets | Discarded packets |
| A | 0 | 27384 | 3 |
| B | 0 | 23933 | 2 |
| C | 0 | 21567 | 2 |
| D | 0 | 24549 | 2 |
| Quadrant | Total seconds | Saturated seconds | Saturation percentage |
|---|---|---|---|
| A | 10623 | 400 | 3.765415% |
| B | 10623 | 246 | 2.315730% |
| C | 10623 | 28 | 0.263579% |
| D | 10623 | 134 | 1.261414% |
Noise dominated data is calculated using 1-second bins in cleaned event files. If a bin has >2000 counts, and if more than 50% of those come from <1% of pixels, then it is considered to be noise-dominated and hence unusable.
| Quadrant | # 1 sec bins | Bins with >0 counts | Bins with >2000 counts | High rate bins dominated by noise | Noise dominated (total time) | Noise dominated (detector-on time) | Marked lightcurve |
|---|---|---|---|---|---|---|---|
| A | 13519 | 10625 | 385 | 385 | 2.85% | 3.62% | 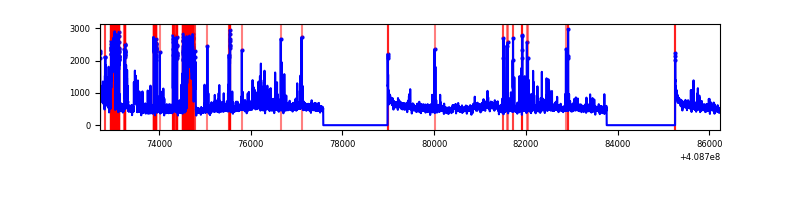 |
| B | 13519 | 10625 | 184 | 184 | 1.36% | 1.73% | 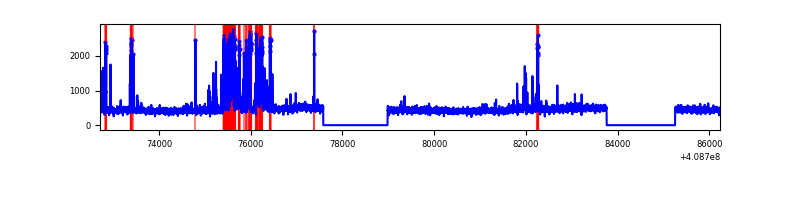 |
| C | 13519 | 10625 | 21 | 21 | 0.16% | 0.20% | 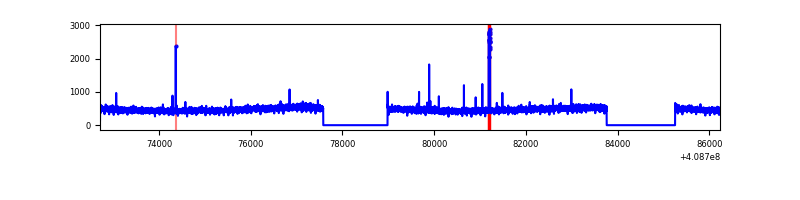 |
| D | 13519 | 10625 | 135 | 135 | 1.00% | 1.27% | 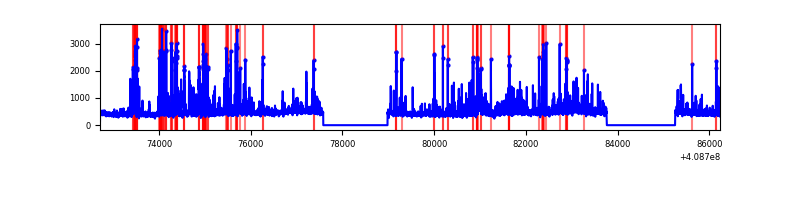 |
Top three noisy pixels from each quadrant. If the there are fewer than three noisy pixels in the level2.evt file, extra rows are filled as -1
| Pixel properties | Quadrant properties | ||||||
|---|---|---|---|---|---|---|---|
| Quadrant | DetID | PixID | Counts | Sigma | Mean | Median | Sigma |
| A | 15 | 222 | 1353118 | 5731.61 | 1169 | 1141 | 235.9 |
| A | 10 | 83 | 741728 | 3139.66 | 1169 | 1141 | 235.9 |
| A | 13 | 248 | 193734 | 816.48 | 1169 | 1141 | 235.9 |
| B | 5 | 172 | 923645 | 4152.33 | 1163 | 1128 | 222.2 |
| B | 0 | 230 | 48069 | 211.29 | 1163 | 1128 | 222.2 |
| B | 12 | 111 | 28592 | 123.62 | 1163 | 1128 | 222.2 |
| C | 15 | 214 | 438822 | 1645.6 | 1149 | 1155 | 266.0 |
| C | 1 | 23 | 65916 | 243.5 | 1149 | 1155 | 266.0 |
| C | 1 | 128 | 15788 | 55.02 | 1149 | 1155 | 266.0 |
| D | 12 | 227 | 746657 | 2683.62 | 1143 | 1109 | 277.8 |
| D | 2 | 249 | 164372 | 587.67 | 1143 | 1109 | 277.8 |
| D | 13 | 249 | 123358 | 440.04 | 1143 | 1109 | 277.8 |
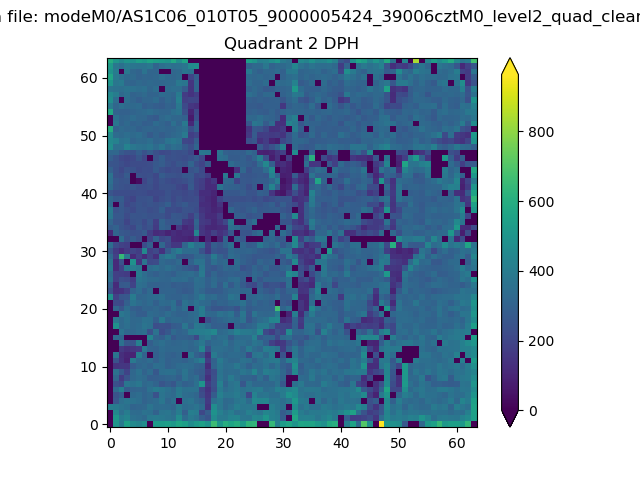
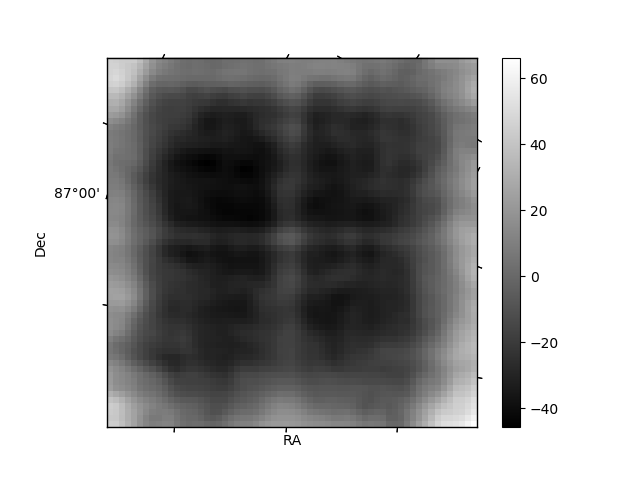
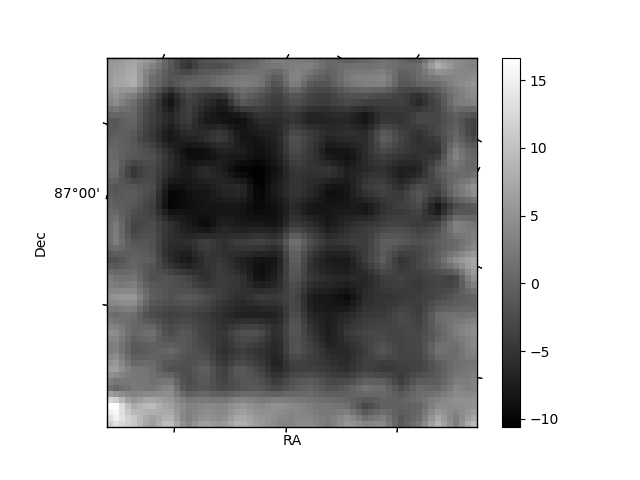
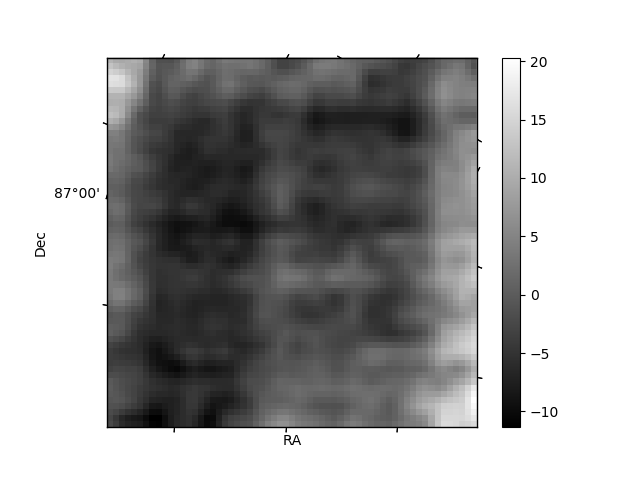
Histogram calculated using DETX and DETY for each event in the final _common_clean file
| Quadrant A | 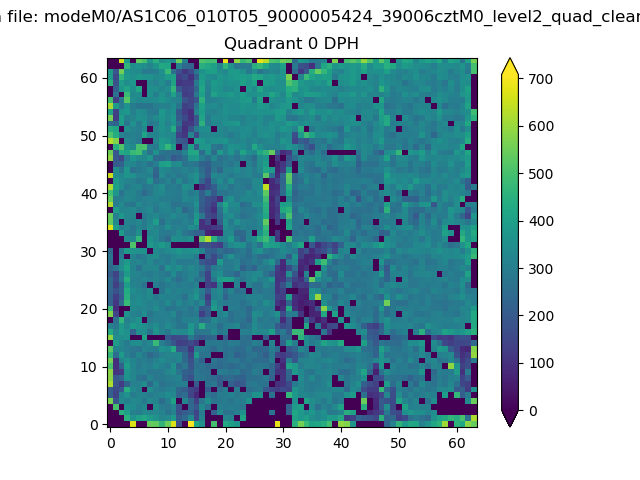 |
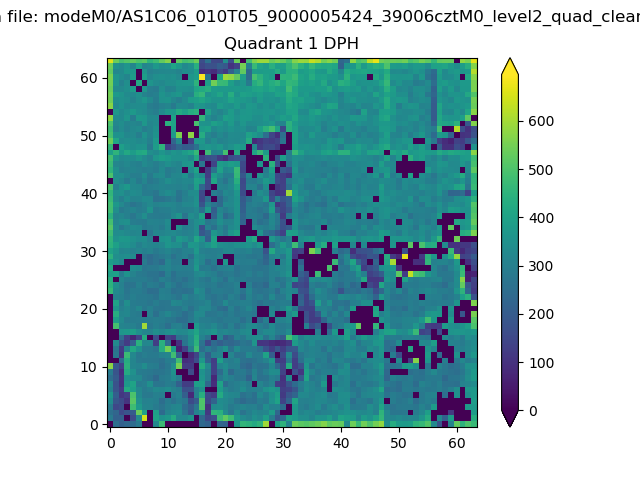 |
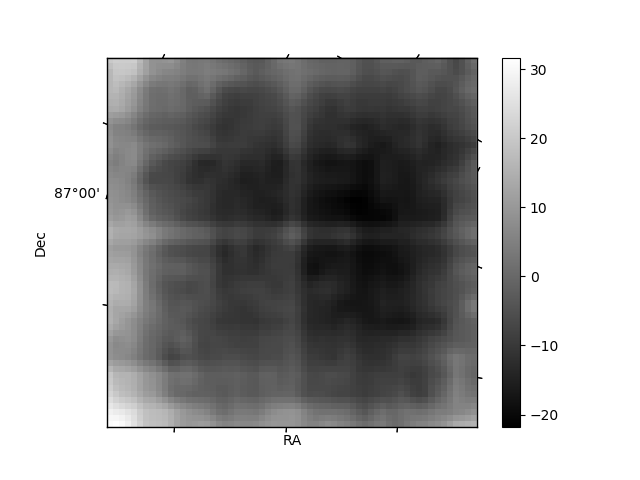
Quadrant B |
|---|---|---|---|
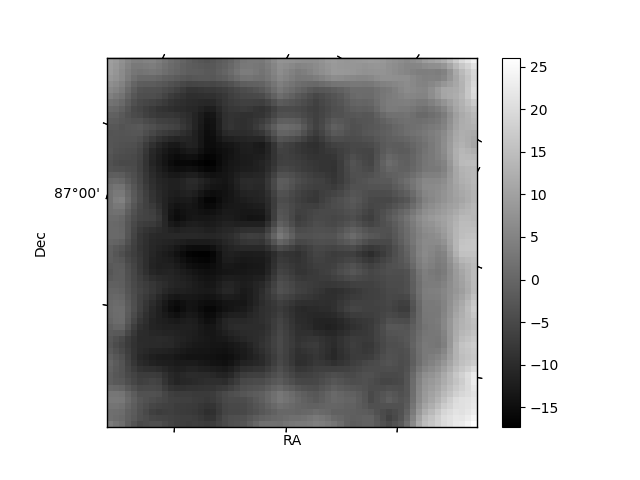
| Quadrant D | 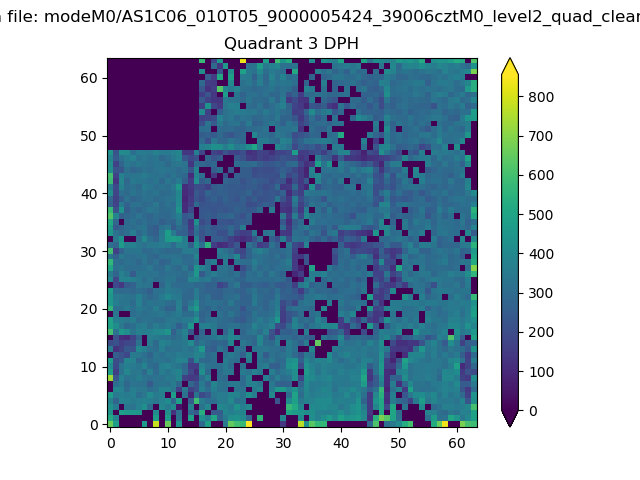 |
 |
Quadrant C |
| Plot type | Count rate plots | Images |
|---|---|---|
| Comparison with Poisson distribution Blue bars denote a histogram of data divided into 1 sec bins. Red curve is a Poisson curve with rate = median count rate of data. |
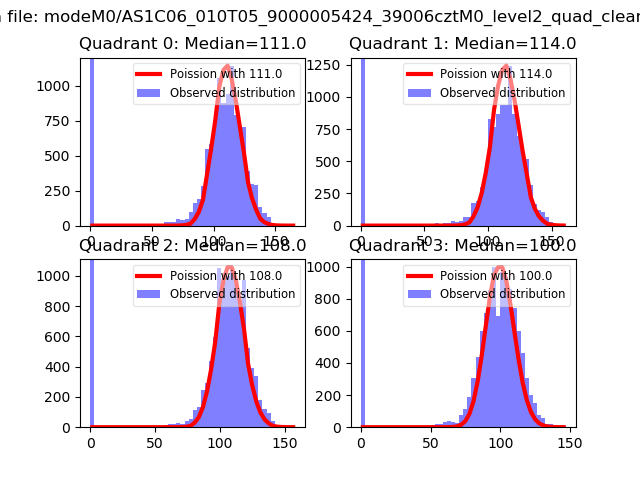 |
 |
| Quadrant-wise count rates Data is divided into 100 sec bins |
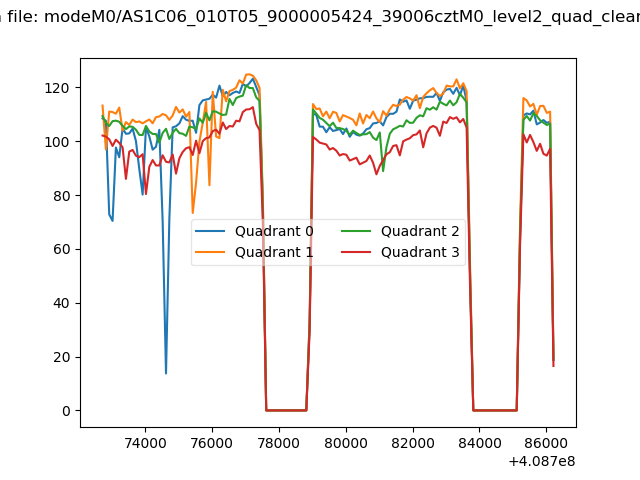 |
|
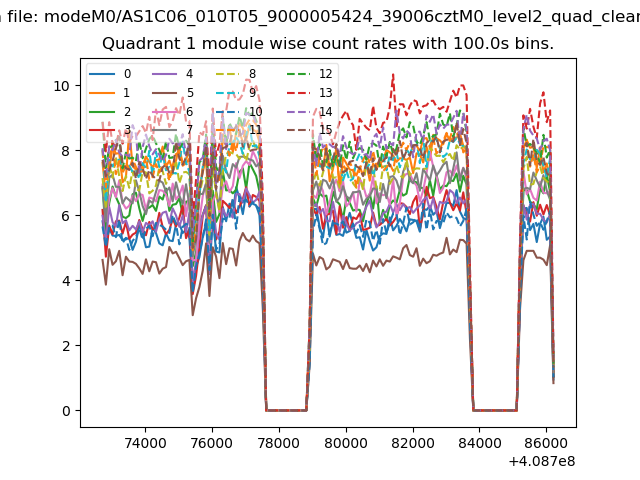
| Module-wise count rates for Quadrant A Data is divided into 100 sec bins |
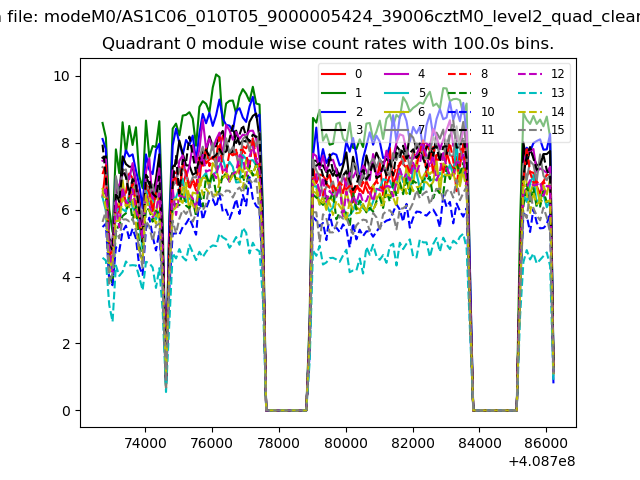 |
 |
| Module-wise count rates for Quadrant B Data is divided into 100 sec bins |
 |
 |
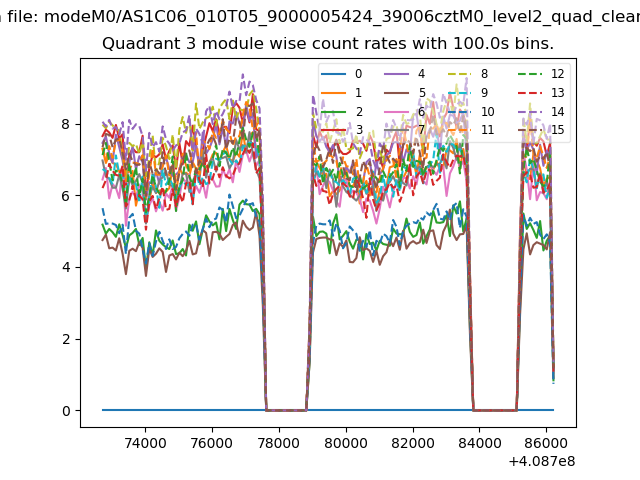
| Module-wise count rates for Quadrant C Data is divided into 100 sec bins |
 |
 |
| Module-wise count rates for Quadrant D Data is divided into 100 sec bins |
 |
 |
| Parameter | Plot |
|---|---|
| CZT HV Monitor |  |
| D_VDD | 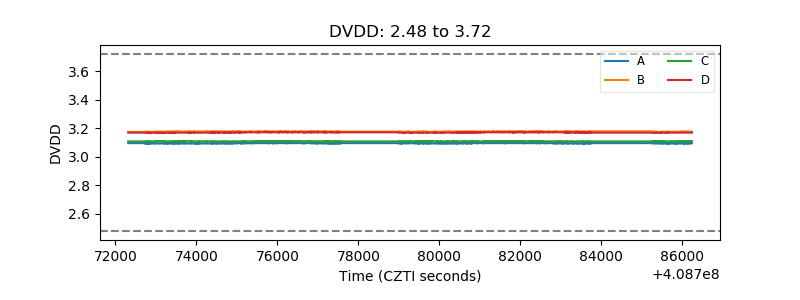 |
| Temperature 1 | 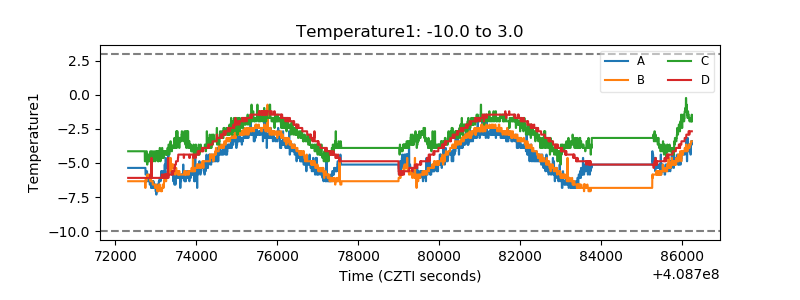 |
| Veto HV Monitor | 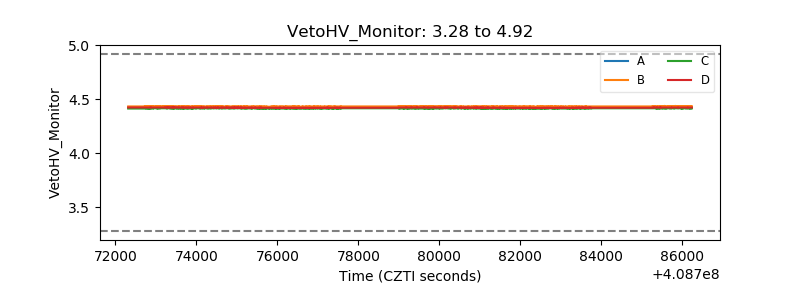 |
| Veto LLD | 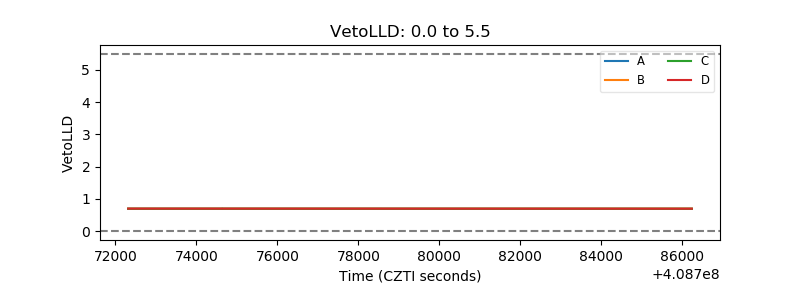 |
| Alpha Counter | 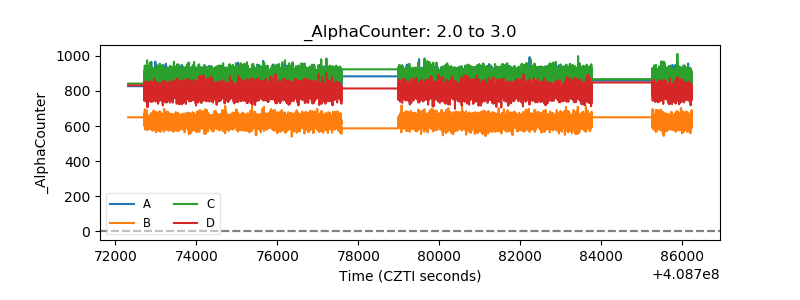 |
| _CPM_Rate | 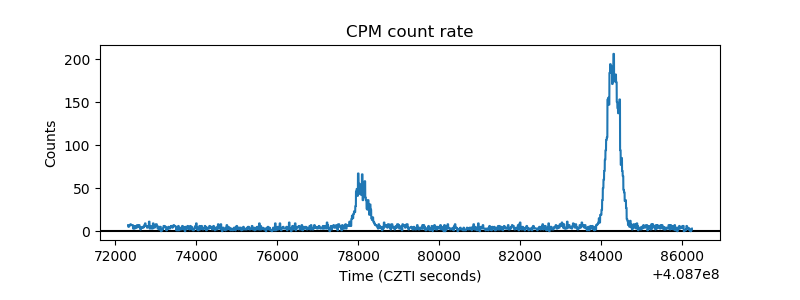 |
| CZT Counter | 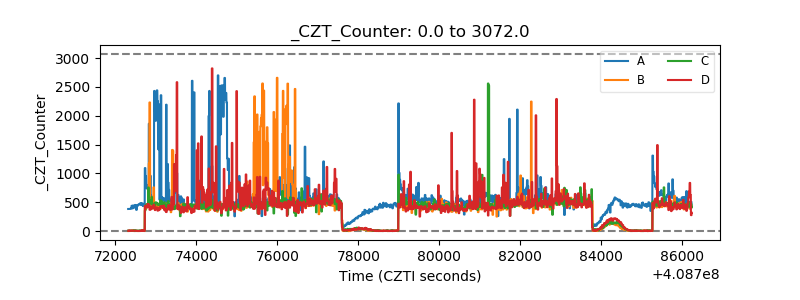 |
| +2.5 Volts monitor | 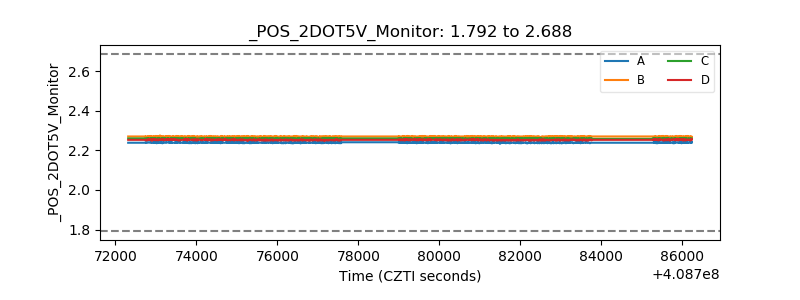 |
| +5 Volts monitor | 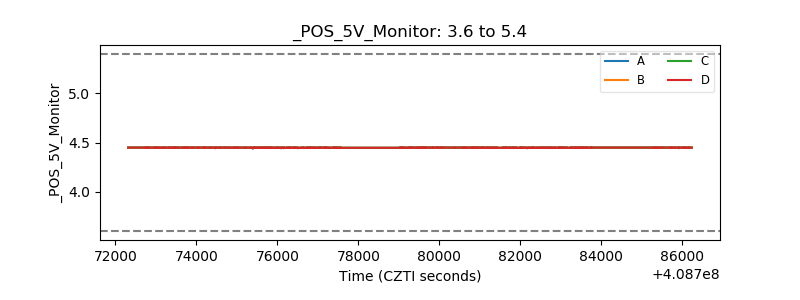 |
| _ROLL_ROT | 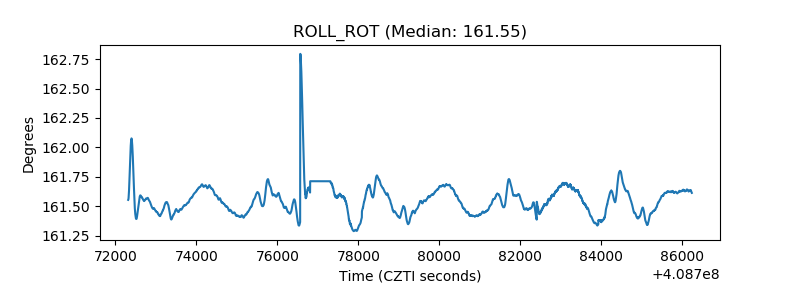 |
| _Roll_DEC | 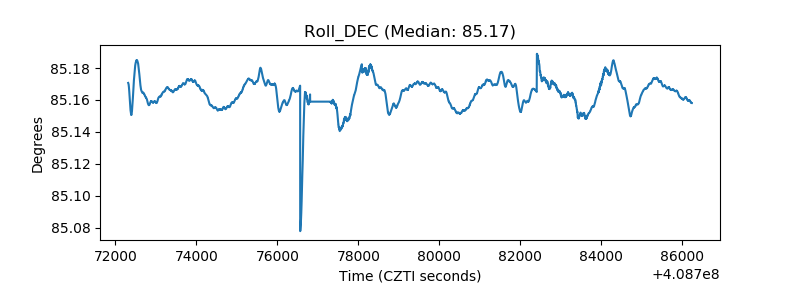 |
| _Roll_RA | 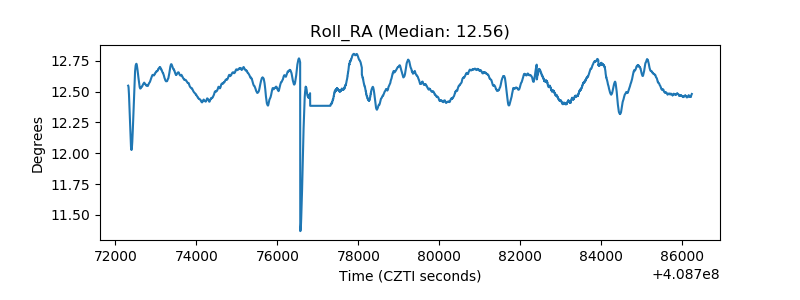 |
| Veto Counter | 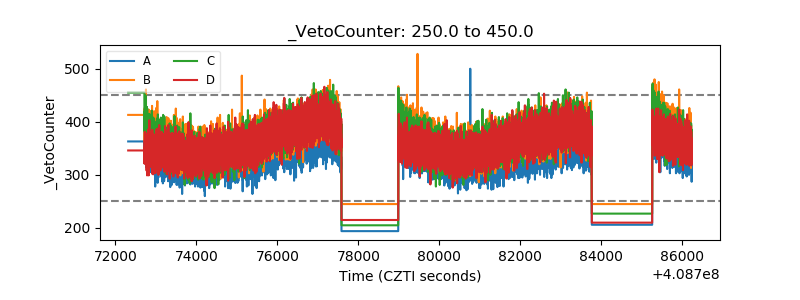 |