| Param | Original file | Final file |
|---|---|---|
| Filename | modeM0/AS1C06_010T05_9000005424_39007cztM0_level2.fits | modeM0/AS1C06_010T05_9000005424_39007cztM0_level2_quad_clean.evt |
| Size (bytes) | 235,117,440 | 65,845,440 |
| Size | 224.2 MB | 62.8 MB |
| Events in quadrant A | 2,349,916 | 441,804 |
| Events in quadrant B | 1,945,115 | 448,075 |
| Events in quadrant C | 1,866,033 | 426,989 |
| Events in quadrant D | 2,230,494 | 395,553 |
| Mode SS | |||
|---|---|---|---|
| Quadrant | BADHDUFLAG | Total packets | Discarded packets |
| A | 0 | 80 | 0 |
| B | 0 | 80 | 0 |
| C | 0 | 80 | 0 |
| D | 0 | 80 | 0 |
| Mode M9 | |||
|---|---|---|---|
| Quadrant | BADHDUFLAG | Total packets | Discarded packets |
| A | 0 | 3 | 0 |
| B | 0 | 3 | 0 |
| C | 0 | 3 | 0 |
| D | 0 | 4 | 0 |
| Mode M0 | |||
|---|---|---|---|
| Quadrant | BADHDUFLAG | Total packets | Discarded packets |
| A | 0 | 9463 | 1 |
| B | 0 | 8544 | 1 |
| C | 0 | 8078 | 1 |
| D | 0 | 9350 | 1 |
| Quadrant | Total seconds | Saturated seconds | Saturation percentage |
|---|---|---|---|
| A | 3987 | 53 | 1.329320% |
| B | 3987 | 59 | 1.479809% |
| C | 3987 | 10 | 0.250815% |
| D | 3987 | 23 | 0.576875% |
Noise dominated data is calculated using 1-second bins in cleaned event files. If a bin has >2000 counts, and if more than 50% of those come from <1% of pixels, then it is considered to be noise-dominated and hence unusable.
| Quadrant | # 1 sec bins | Bins with >0 counts | Bins with >2000 counts | High rate bins dominated by noise | Noise dominated (total time) | Noise dominated (detector-on time) | Marked lightcurve |
|---|---|---|---|---|---|---|---|
| A | 3987 | 3987 | 43 | 43 | 1.08% | 1.08% | 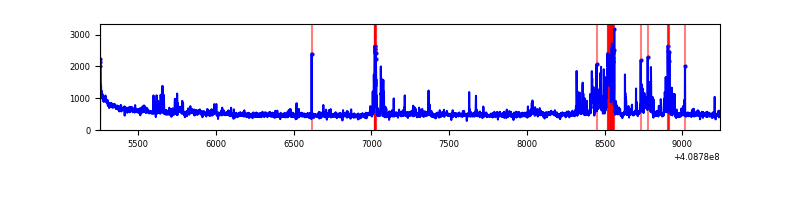 |
| B | 3987 | 3987 | 52 | 52 | 1.30% | 1.30% | 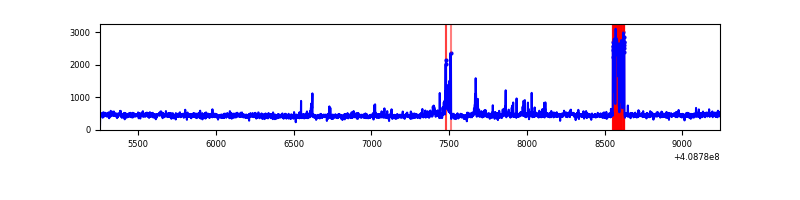 |
| C | 3987 | 3987 | 8 | 8 | 0.20% | 0.20% | 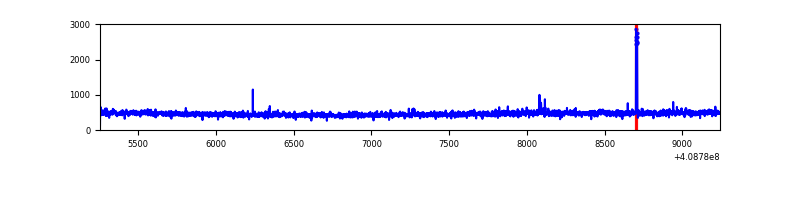 |
| D | 3987 | 3987 | 22 | 22 | 0.55% | 0.55% | 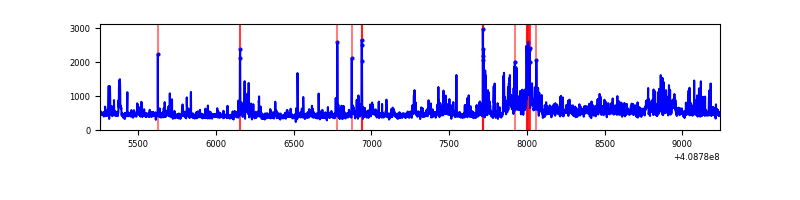 |
Top three noisy pixels from each quadrant. If the there are fewer than three noisy pixels in the level2.evt file, extra rows are filled as -1
| Pixel properties | Quadrant properties | ||||||
|---|---|---|---|---|---|---|---|
| Quadrant | DetID | PixID | Counts | Sigma | Mean | Median | Sigma |
| A | 13 | 248 | 325278 | 3657.35 | 434 | 425 | 88.8 |
| A | 10 | 83 | 279307 | 3139.79 | 434 | 425 | 88.8 |
| A | 15 | 222 | 53931 | 602.4 | 434 | 425 | 88.8 |
| B | 5 | 172 | 191566 | 2297.77 | 429 | 418 | 83.2 |
| B | 0 | 230 | 37039 | 440.22 | 429 | 418 | 83.2 |
| B | 15 | 85 | 20452 | 240.83 | 429 | 418 | 83.2 |
| C | 15 | 214 | 166245 | 1675.81 | 422 | 425 | 98.9 |
| C | 1 | 23 | 22909 | 227.23 | 422 | 425 | 98.9 |
| C | 1 | 128 | 20180 | 199.65 | 422 | 425 | 98.9 |
| D | 12 | 227 | 211966 | 2024.4 | 425 | 412 | 104.5 |
| D | 1 | 52 | 110326 | 1051.79 | 425 | 412 | 104.5 |
| D | 12 | 235 | 90968 | 866.55 | 425 | 412 | 104.5 |
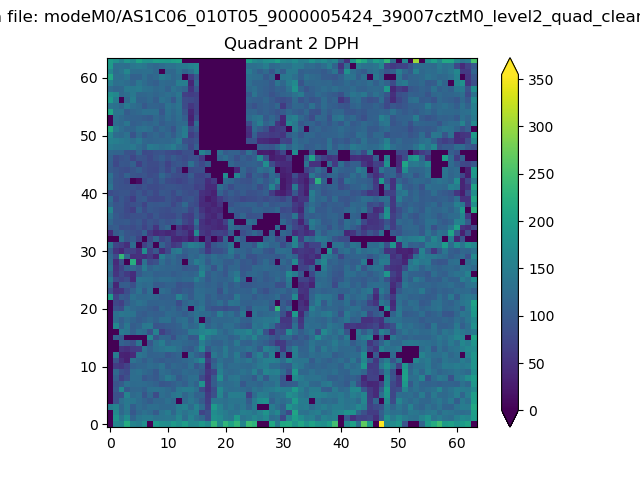
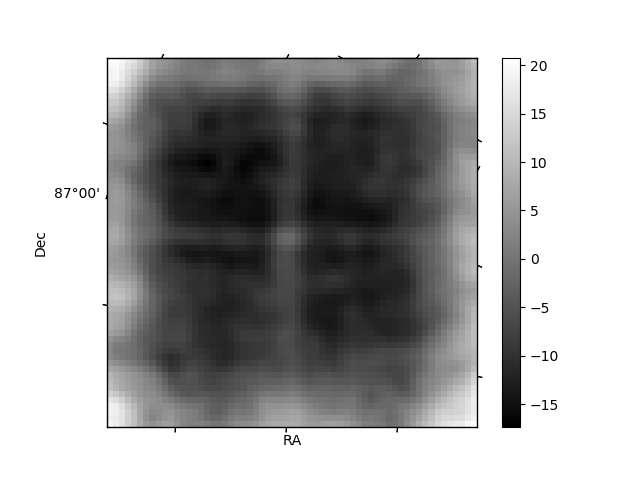
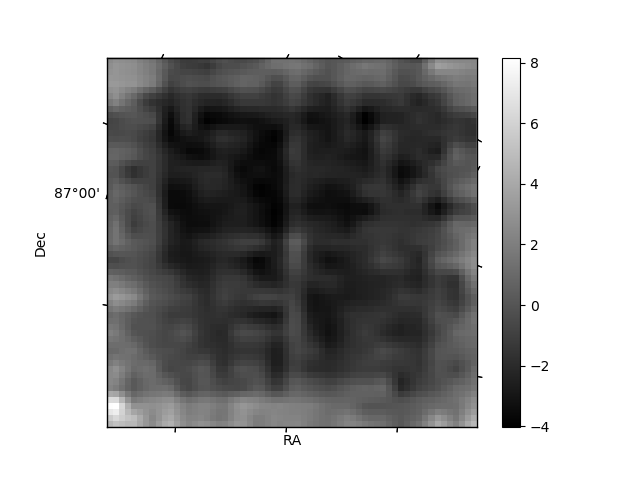
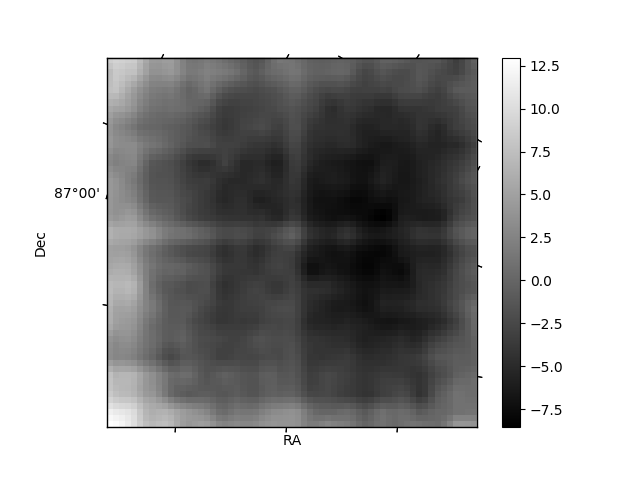
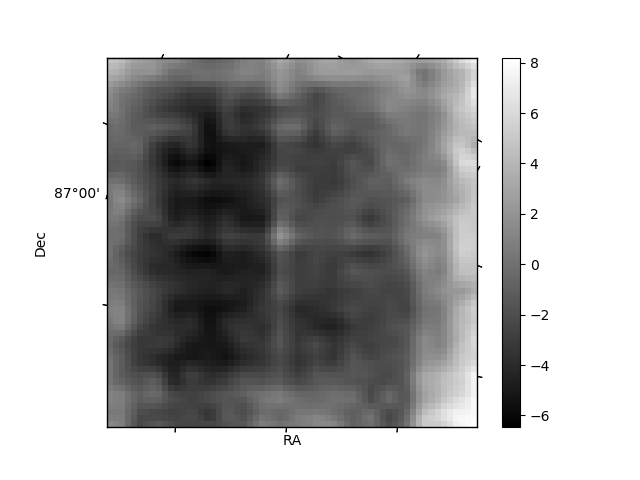
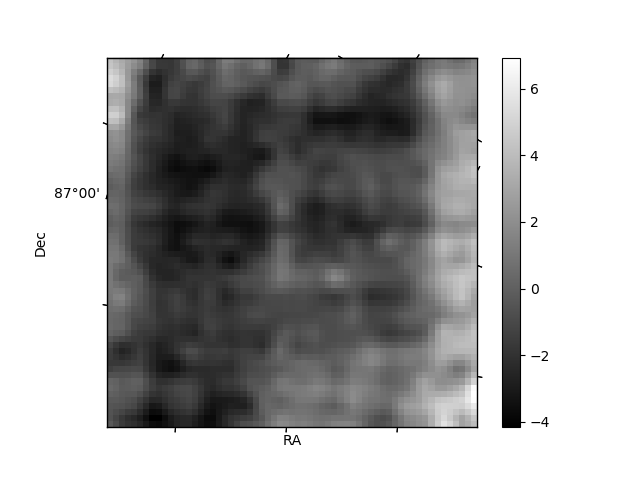
Histogram calculated using DETX and DETY for each event in the final _common_clean file
| Quadrant A | 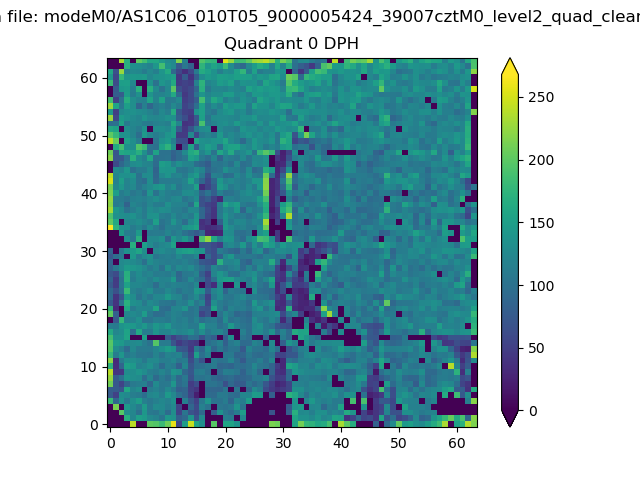 |
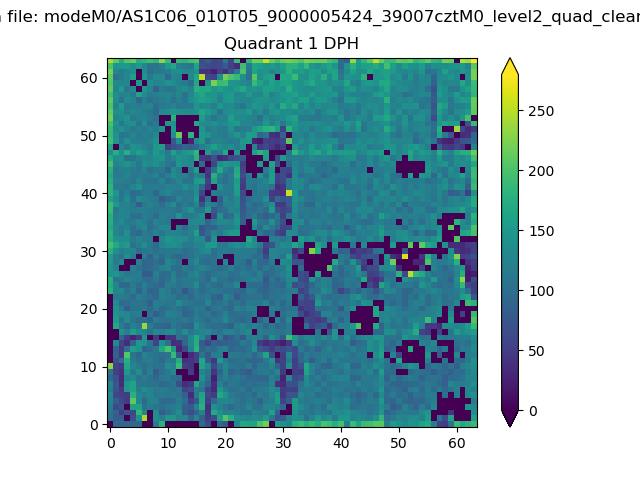 |
Quadrant B |
|---|---|---|---|
| Quadrant D | 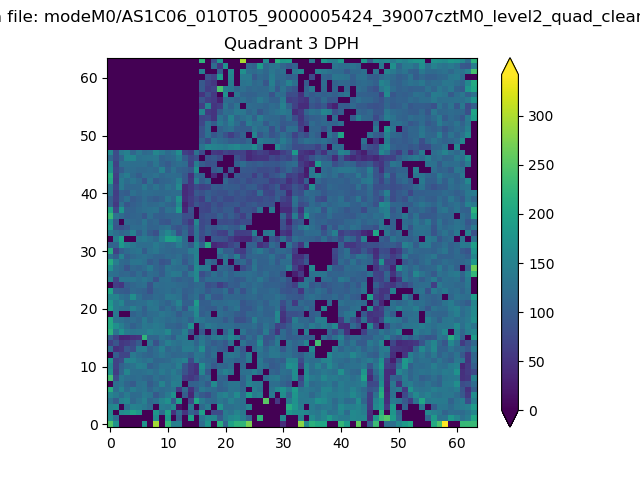 |
 |
Quadrant C |
| Plot type | Count rate plots | Images |
|---|---|---|
| Comparison with Poisson distribution Blue bars denote a histogram of data divided into 1 sec bins. Red curve is a Poisson curve with rate = median count rate of data. |
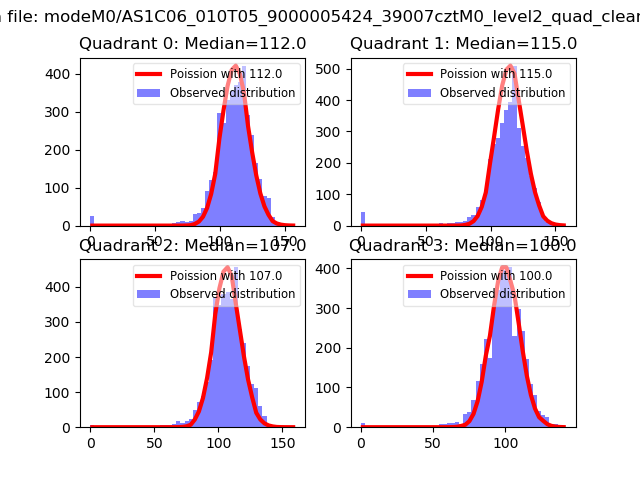 |
 |
| Quadrant-wise count rates Data is divided into 100 sec bins |
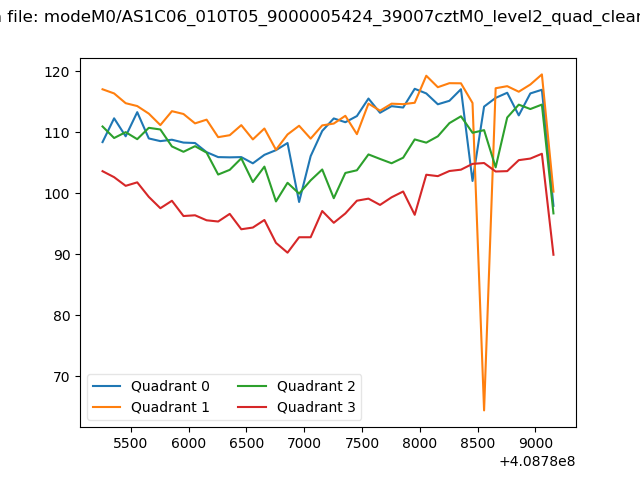 |
|
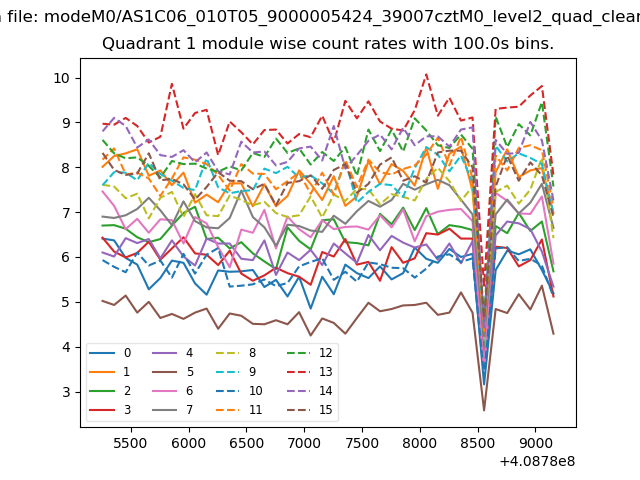
| Module-wise count rates for Quadrant A Data is divided into 100 sec bins |
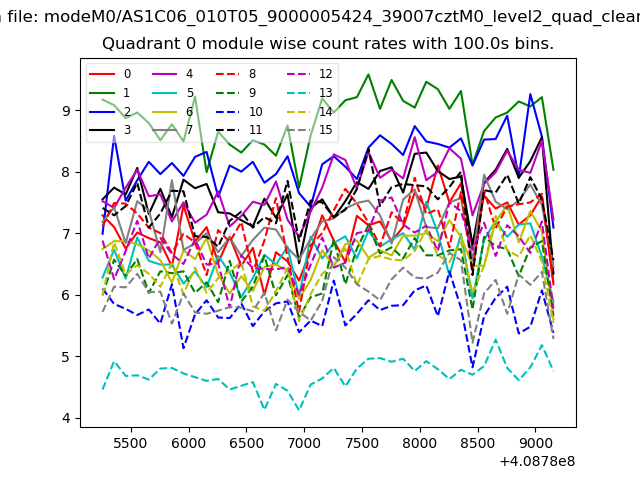 |
 |
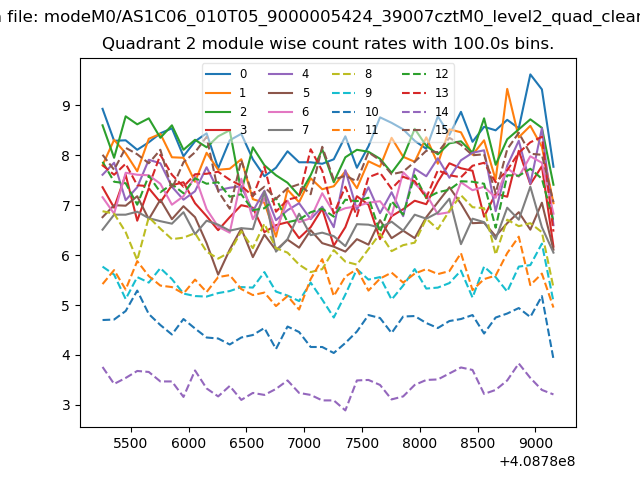
| Module-wise count rates for Quadrant B Data is divided into 100 sec bins |
 |
 |
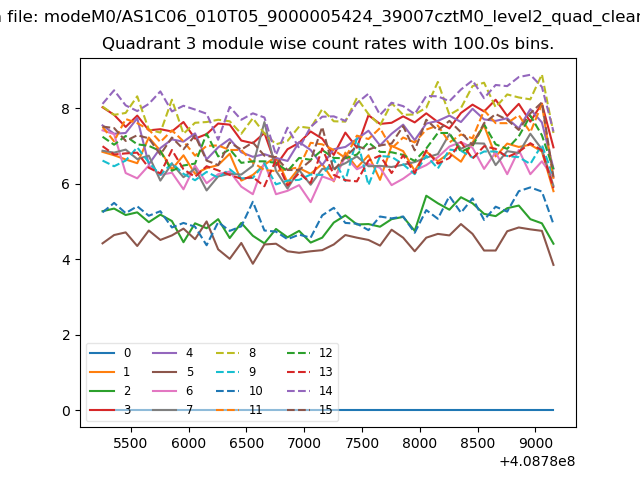
| Module-wise count rates for Quadrant C Data is divided into 100 sec bins |
 |
 |
| Module-wise count rates for Quadrant D Data is divided into 100 sec bins |
 |
 |
| Parameter | Plot |
|---|---|
| CZT HV Monitor | 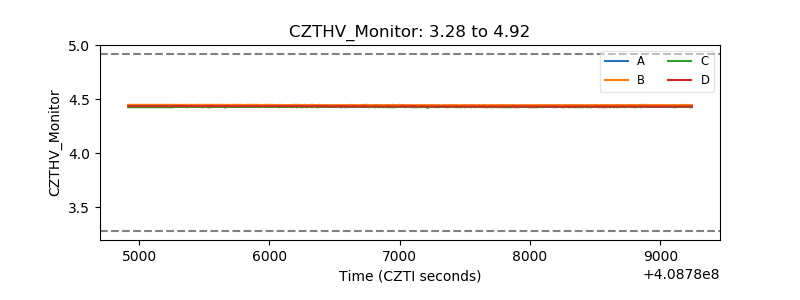 |
| D_VDD | 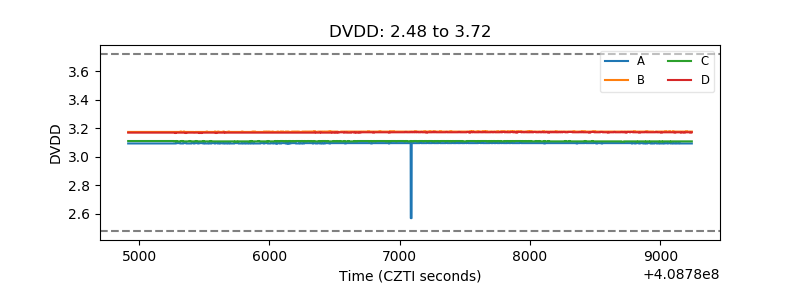 |
| Temperature 1 | 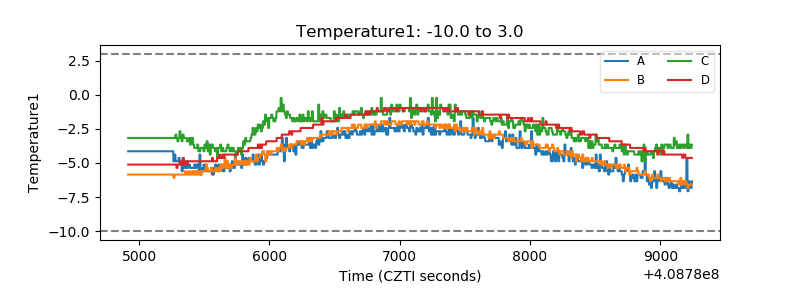 |
| Veto HV Monitor | 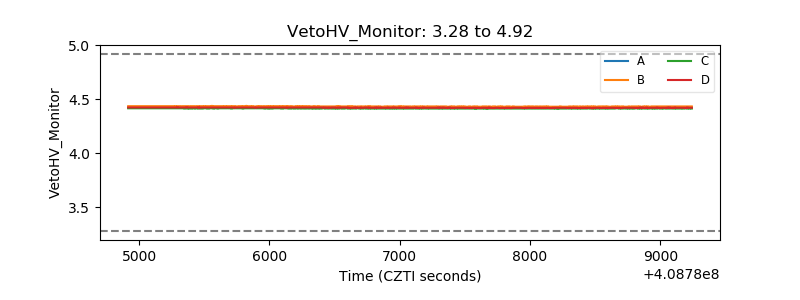 |
| Veto LLD | 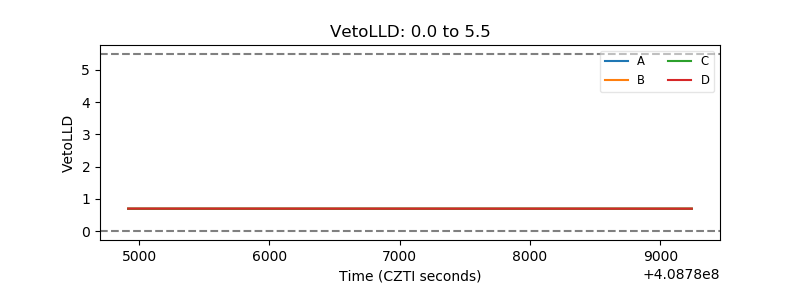 |
| Alpha Counter | 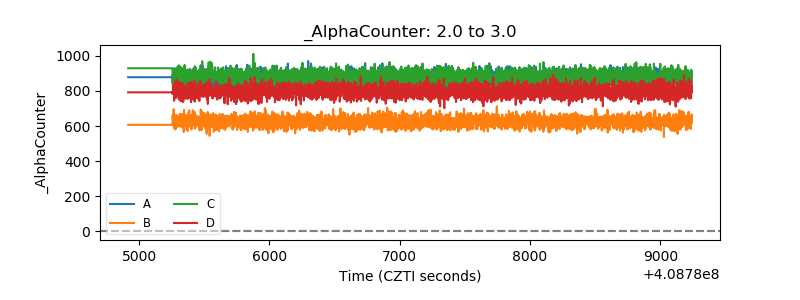 |
| _CPM_Rate | 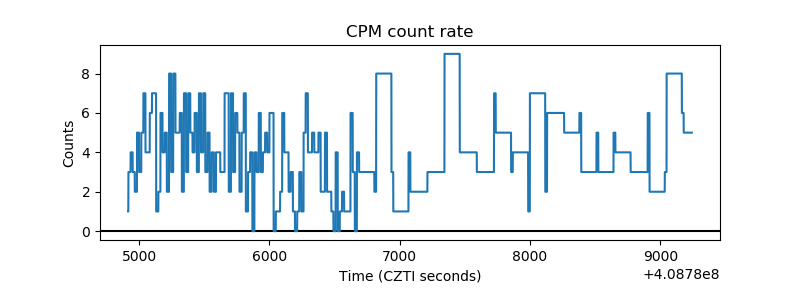 |
| CZT Counter | 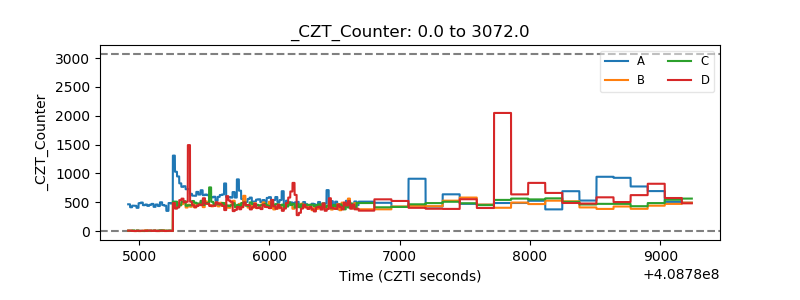 |
| +2.5 Volts monitor | 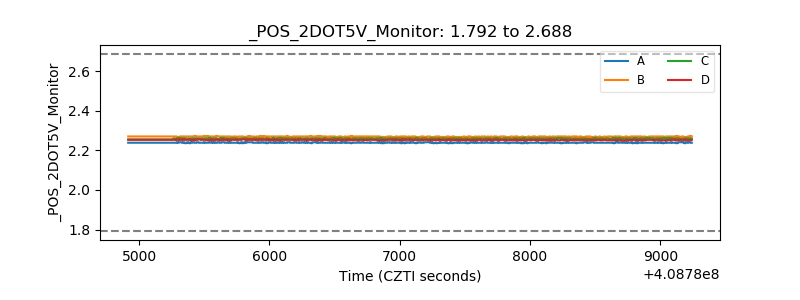 |
| +5 Volts monitor | 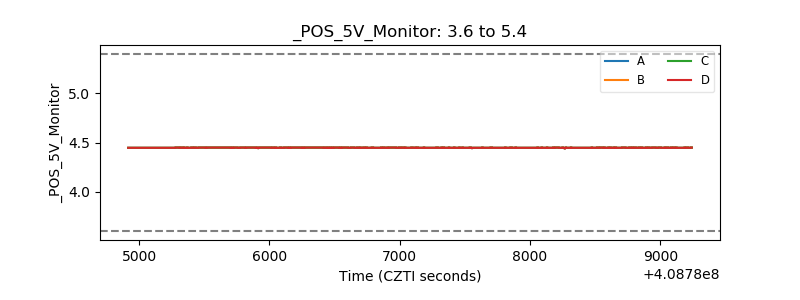 |
| _ROLL_ROT | 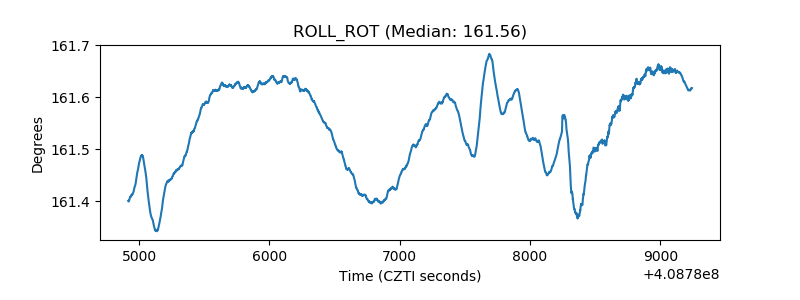 |
| _Roll_DEC | 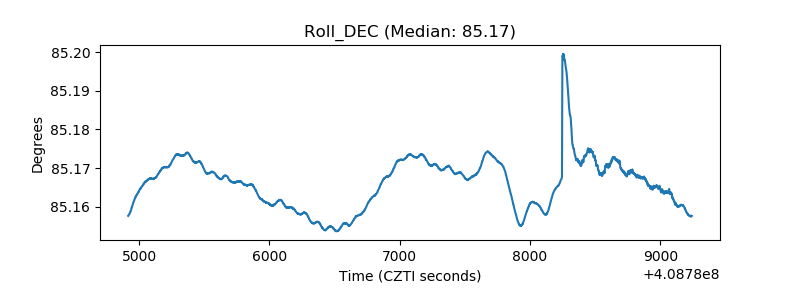 |
| _Roll_RA | 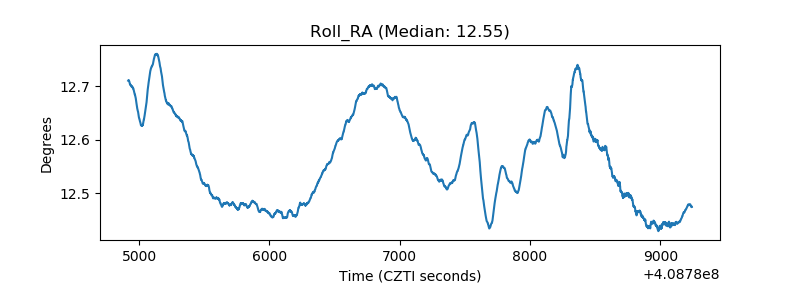 |
| Veto Counter | 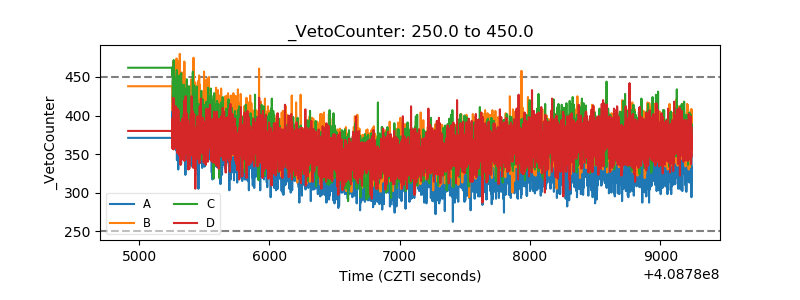 |