| Param | Original file | Final file |
|---|---|---|
| Filename | modeM0/AS1A12_042T01_9000005428_39028cztM0_level2.fits | modeM0/AS1A12_042T01_9000005428_39028cztM0_level2_quad_clean.evt |
| Size (bytes) | 22,553,280 | 5,362,560 |
| Size | 21.5 MB | 5.1 MB |
| Events in quadrant A | 350,427 | 29,516 |
| Events in quadrant B | 138,076 | 37,149 |
| Events in quadrant C | 150,471 | 34,833 |
| Events in quadrant D | 169,101 | 32,221 |
| Mode M0 | |||
|---|---|---|---|
| Quadrant | BADHDUFLAG | Total packets | Discarded packets |
| A | 0 | 1221 | 1 |
| B | 0 | 592 | 0 |
| C | 0 | 601 | 0 |
| D | 0 | 680 | 0 |
| Mode SS | |||
|---|---|---|---|
| Quadrant | BADHDUFLAG | Total packets | Discarded packets |
| A | 0 | 6 | 0 |
| B | 0 | 6 | 0 |
| C | 0 | 6 | 0 |
| D | 0 | 6 | 0 |
| Quadrant | Total seconds | Saturated seconds | Saturation percentage |
|---|---|---|---|
| A | 296 | 61 | 20.608108% |
| B | 296 | 0 | 0.000000% |
| C | 296 | 1 | 0.337838% |
| D | 296 | 4 | 1.351351% |
Noise dominated data is calculated using 1-second bins in cleaned event files. If a bin has >2000 counts, and if more than 50% of those come from <1% of pixels, then it is considered to be noise-dominated and hence unusable.
| Quadrant | # 1 sec bins | Bins with >0 counts | Bins with >2000 counts | High rate bins dominated by noise | Noise dominated (total time) | Noise dominated (detector-on time) | Marked lightcurve |
|---|---|---|---|---|---|---|---|
| A | 296 | 296 | 55 | 55 | 18.58% | 18.58% | 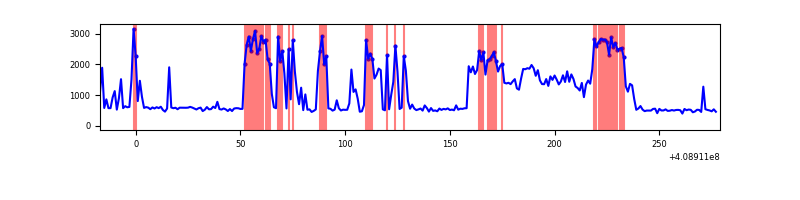 |
| B | 296 | 296 | 0 | 0 | 0.00% | 0.00% | 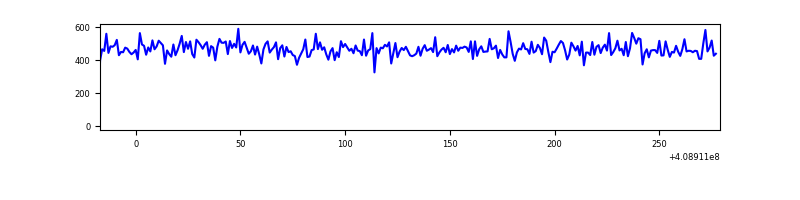 |
| C | 296 | 296 | 0 | 0 | 0.00% | 0.00% | 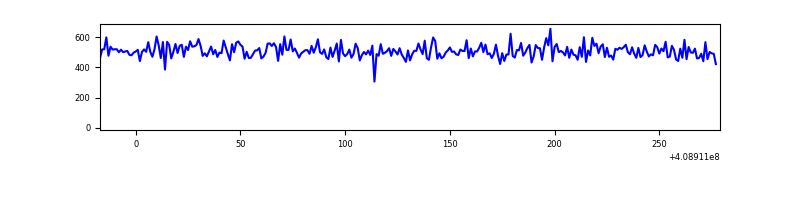 |
| D | 296 | 296 | 3 | 3 | 1.01% | 1.01% | 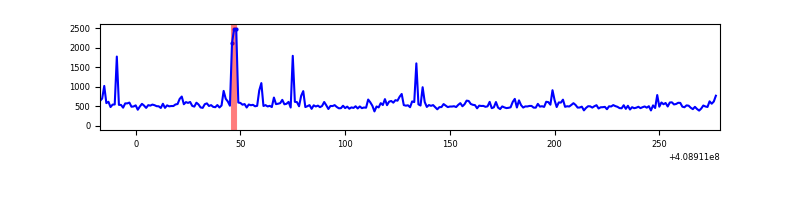 |
Top three noisy pixels from each quadrant. If the there are fewer than three noisy pixels in the level2.evt file, extra rows are filled as -1
| Pixel properties | Quadrant properties | ||||||
|---|---|---|---|---|---|---|---|
| Quadrant | DetID | PixID | Counts | Sigma | Mean | Median | Sigma |
| A | 15 | 222 | 208101 | 24888.03 | 31 | 30 | 8.4 |
| A | 10 | 83 | 19886 | 2375.04 | 31 | 30 | 8.4 |
| A | 13 | 248 | 1397 | 163.51 | 31 | 30 | 8.4 |
| B | 12 | 111 | 784 | 85.29 | 34 | 33 | 8.8 |
| B | 11 | 111 | 684 | 73.93 | 34 | 33 | 8.8 |
| B | 14 | 111 | 638 | 68.71 | 34 | 33 | 8.8 |
| C | 15 | 214 | 11874 | 1156.73 | 35 | 35 | 10.2 |
| C | 10 | 20 | 720 | 66.93 | 35 | 35 | 10.2 |
| C | 13 | 61 | 224 | 18.47 | 35 | 35 | 10.2 |
| D | 12 | 227 | 14647 | 1423.45 | 34 | 33 | 10.3 |
| D | 1 | 47 | 9407 | 913.06 | 34 | 33 | 10.3 |
| D | 12 | 235 | 7182 | 696.34 | 34 | 33 | 10.3 |
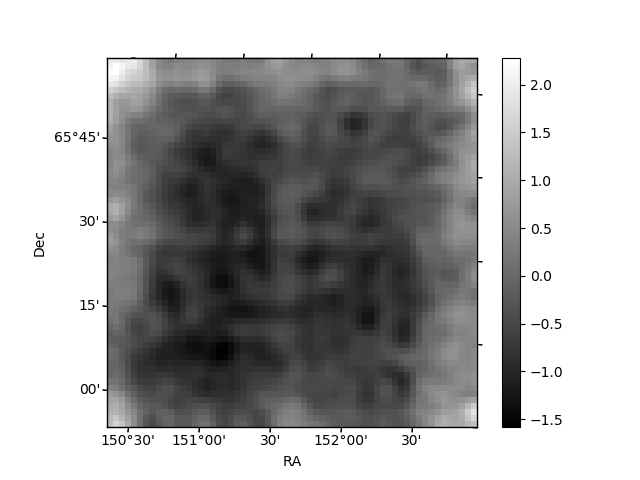
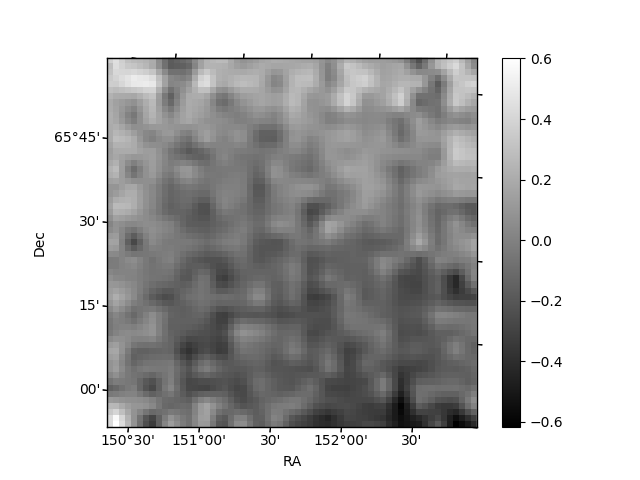
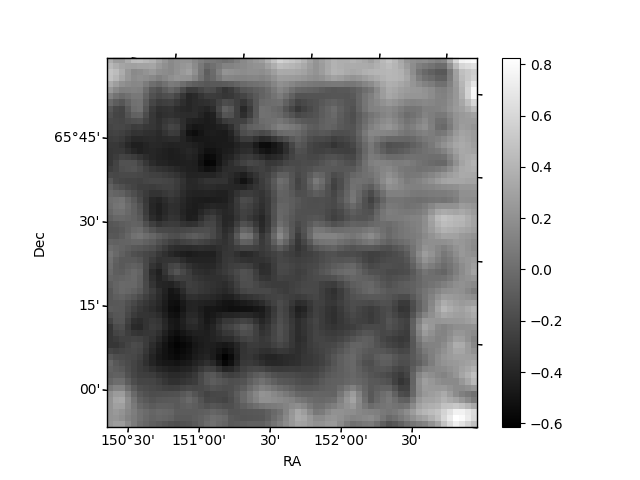
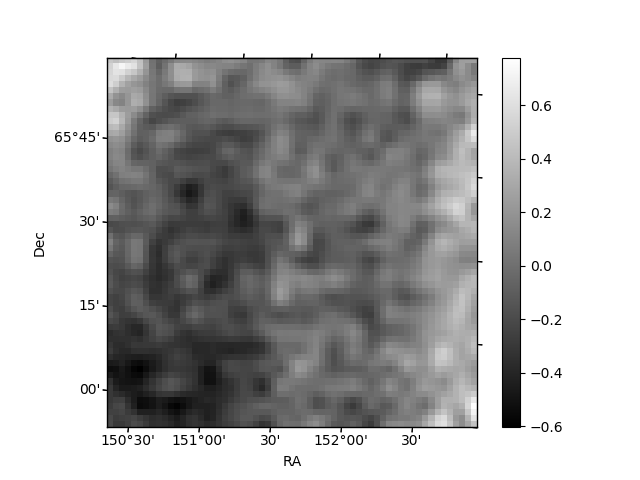
Histogram calculated using DETX and DETY for each event in the final _common_clean file
| Quadrant A | 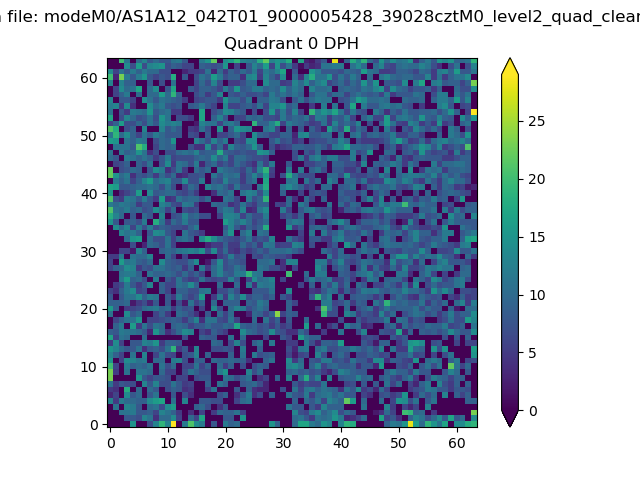 |
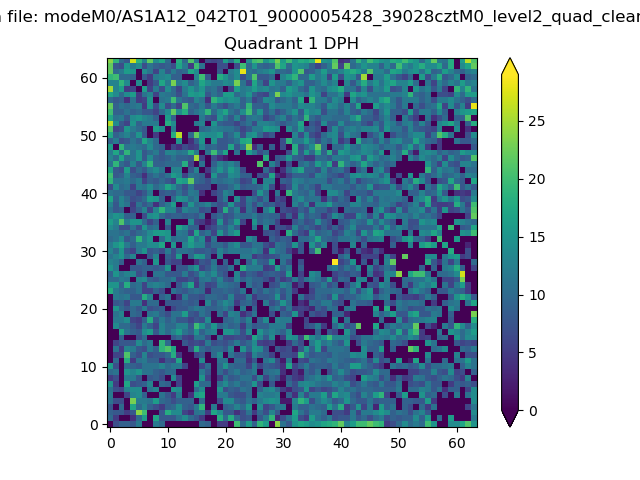 |
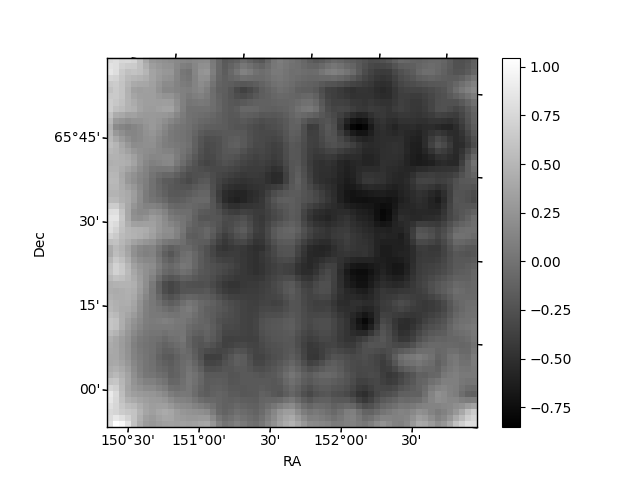
Quadrant B |
|---|---|---|---|
| Quadrant D | 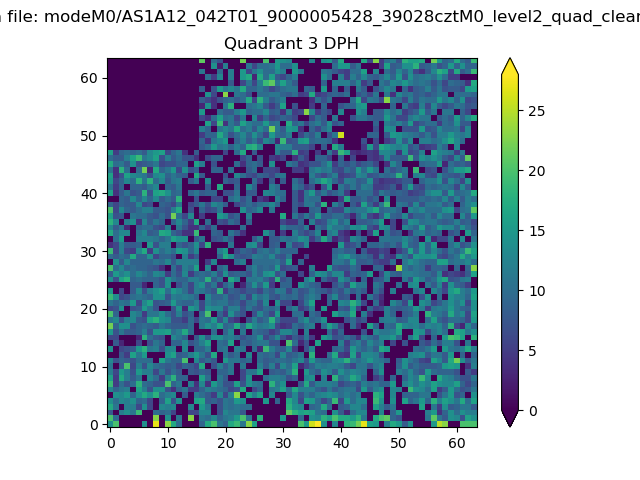 |
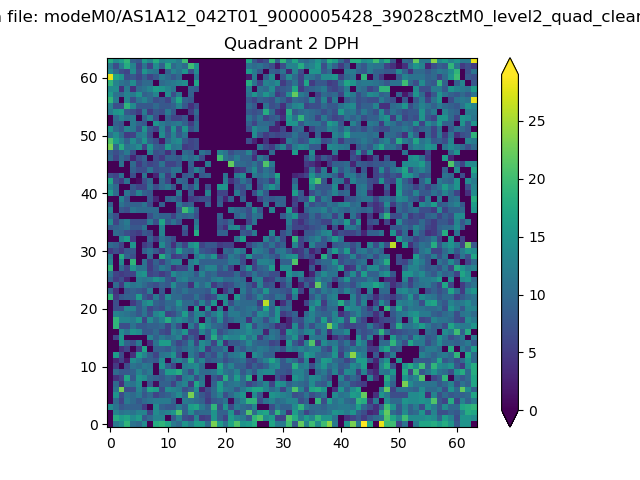 |
Quadrant C |
| Plot type | Count rate plots | Images |
|---|---|---|
| Comparison with Poisson distribution Blue bars denote a histogram of data divided into 1 sec bins. Red curve is a Poisson curve with rate = median count rate of data. |
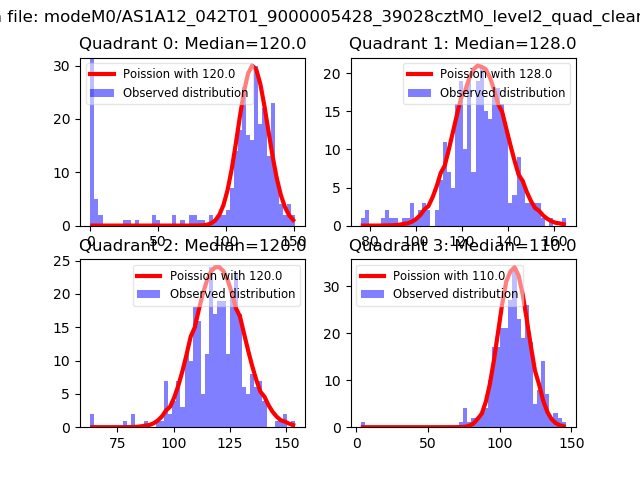 |
 |
| Quadrant-wise count rates Data is divided into 100 sec bins |
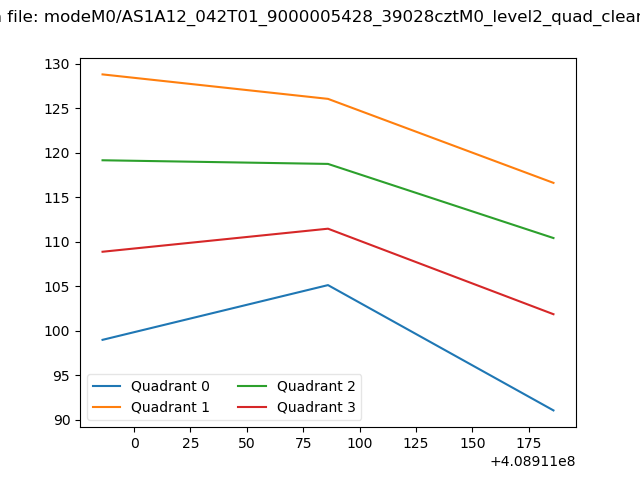 |
|
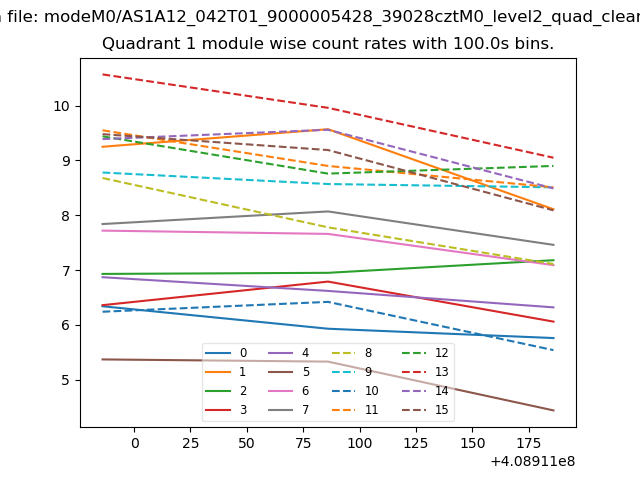
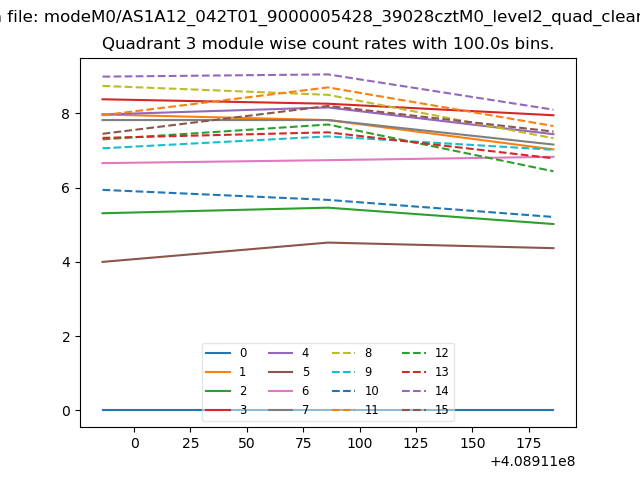
| Module-wise count rates for Quadrant A Data is divided into 100 sec bins |
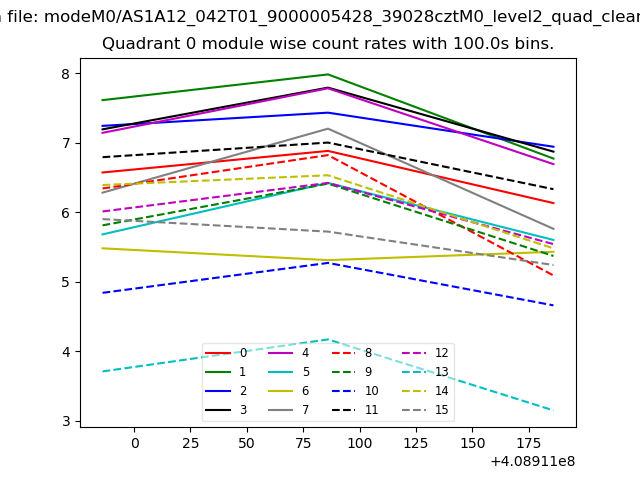 |
 |
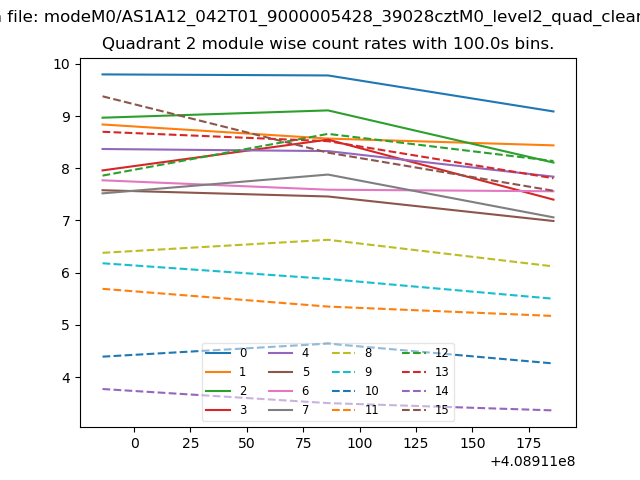
| Module-wise count rates for Quadrant B Data is divided into 100 sec bins |
 |
 |
| Module-wise count rates for Quadrant C Data is divided into 100 sec bins |
 |
 |
| Module-wise count rates for Quadrant D Data is divided into 100 sec bins |
 |
 |
| Parameter | Plot |
|---|---|
| CZT HV Monitor | 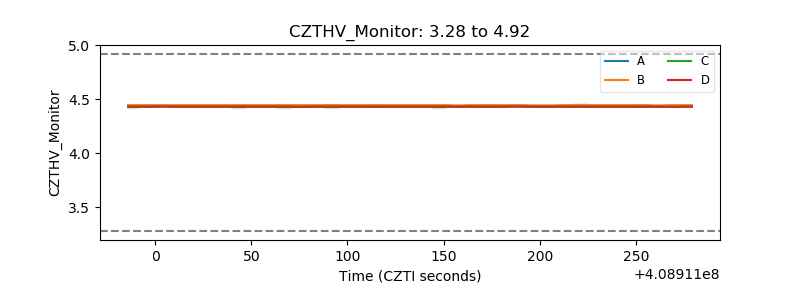 |
| D_VDD | 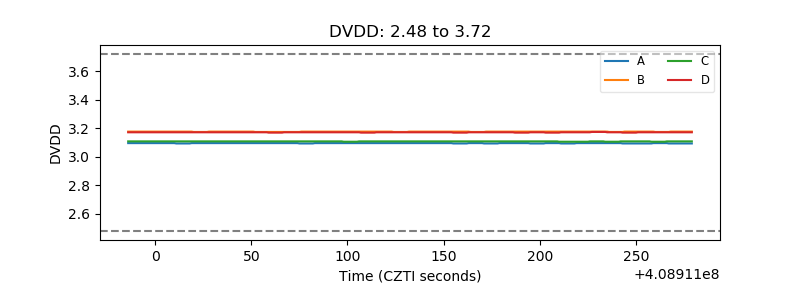 |
| Temperature 1 | 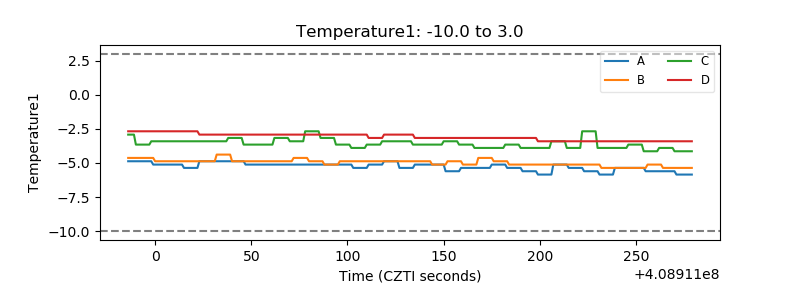 |
| Veto HV Monitor | 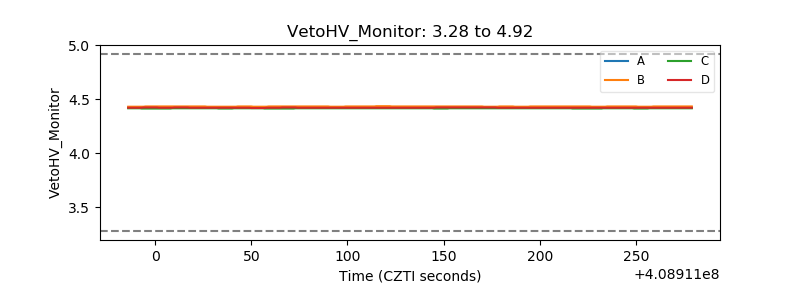 |
| Veto LLD | 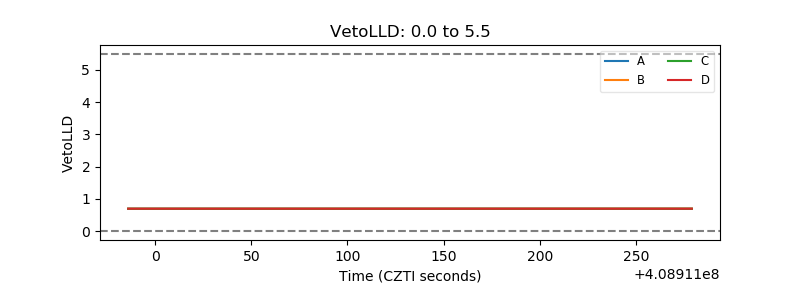 |
| Alpha Counter | 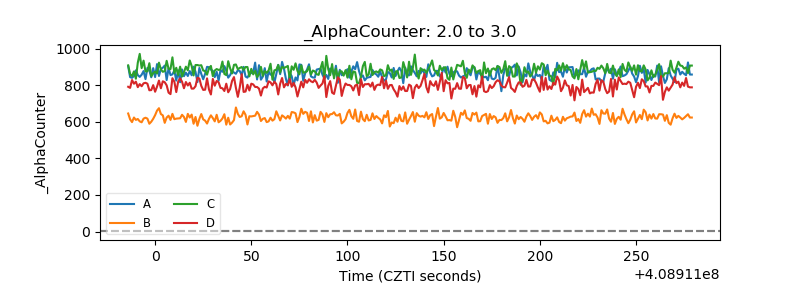 |
| _CPM_Rate | 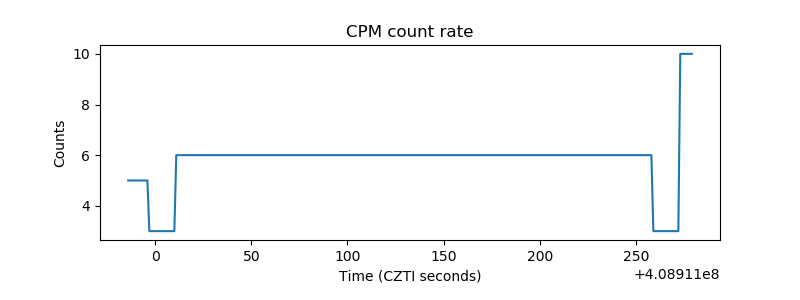 |
| CZT Counter | 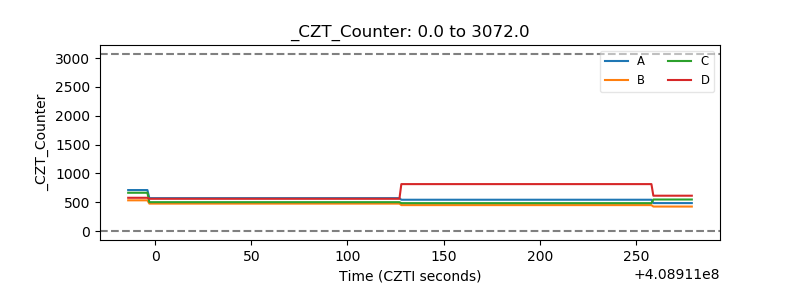 |
| +2.5 Volts monitor |  |
| +5 Volts monitor | 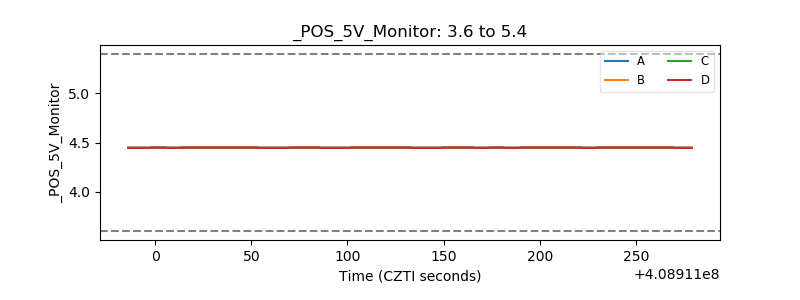 |
| _ROLL_ROT | 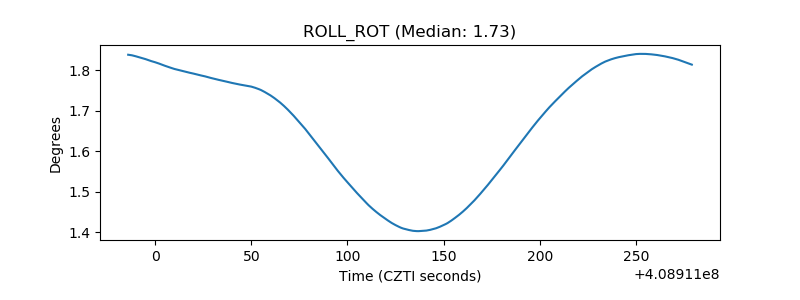 |
| _Roll_DEC | 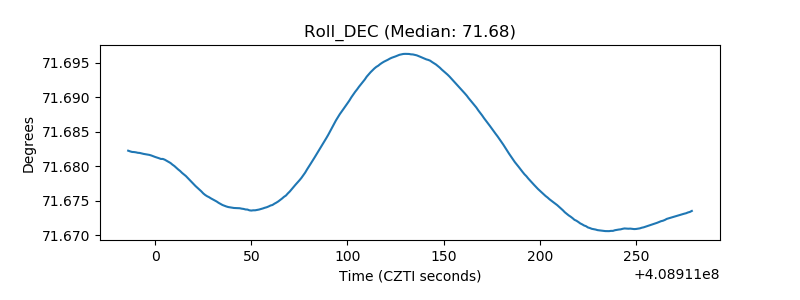 |
| _Roll_RA | 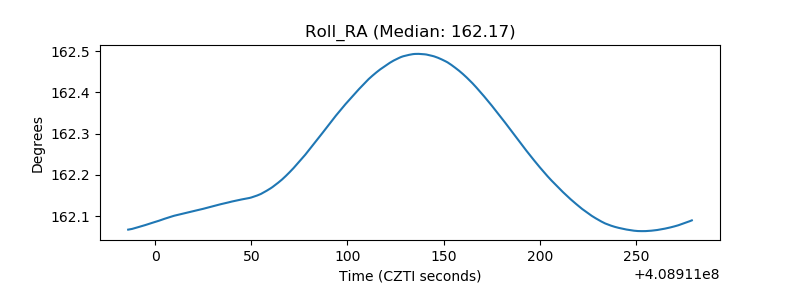 |
| Veto Counter | 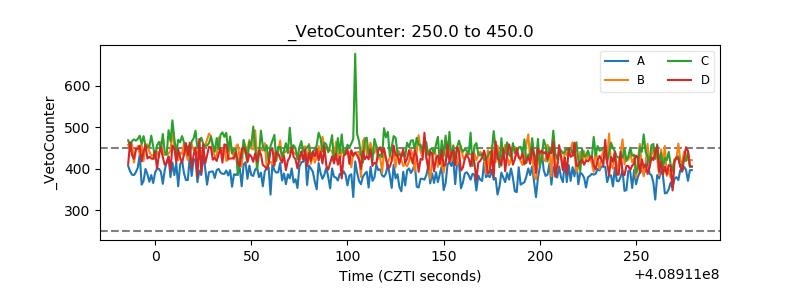 |