| Param | Original file | Final file |
|---|---|---|
| Filename | modeM0/AS1A12_042T01_9000005428_39029cztM0_level2.fits | modeM0/AS1A12_042T01_9000005428_39029cztM0_level2_quad_clean.evt |
| Size (bytes) | 285,742,080 | 79,646,400 |
| Size | 272.5 MB | 76.0 MB |
| Events in quadrant A | 3,537,504 | 512,241 |
| Events in quadrant B | 2,007,713 | 551,446 |
| Events in quadrant C | 2,149,144 | 532,456 |
| Events in quadrant D | 2,523,692 | 491,863 |
| Mode M0 | |||
|---|---|---|---|
| Quadrant | BADHDUFLAG | Total packets | Discarded packets |
| A | 0 | 13561 | 2 |
| B | 0 | 9298 | 1 |
| C | 0 | 9279 | 1 |
| D | 0 | 10574 | 1 |
| Mode SS | |||
|---|---|---|---|
| Quadrant | BADHDUFLAG | Total packets | Discarded packets |
| A | 0 | 96 | 0 |
| B | 0 | 96 | 0 |
| C | 0 | 96 | 0 |
| D | 0 | 96 | 0 |
| Mode M9 | |||
|---|---|---|---|
| Quadrant | BADHDUFLAG | Total packets | Discarded packets |
| A | 0 | 20 | 0 |
| B | 0 | 20 | 0 |
| C | 0 | 20 | 0 |
| D | 0 | 20 | 0 |
| Quadrant | Total seconds | Saturated seconds | Saturation percentage |
|---|---|---|---|
| A | 4601 | 284 | 6.172571% |
| B | 4601 | 2 | 0.043469% |
| C | 4601 | 3 | 0.065203% |
| D | 4601 | 61 | 1.325799% |
Noise dominated data is calculated using 1-second bins in cleaned event files. If a bin has >2000 counts, and if more than 50% of those come from <1% of pixels, then it is considered to be noise-dominated and hence unusable.
| Quadrant | # 1 sec bins | Bins with >0 counts | Bins with >2000 counts | High rate bins dominated by noise | Noise dominated (total time) | Noise dominated (detector-on time) | Marked lightcurve |
|---|---|---|---|---|---|---|---|
| A | 6634 | 4602 | 263 | 263 | 3.96% | 5.71% | 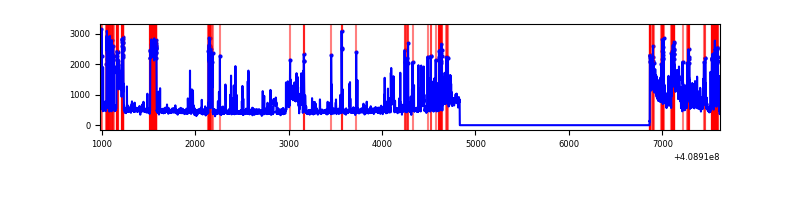 |
| B | 6634 | 4602 | 0 | 0 | 0.00% | 0.00% | 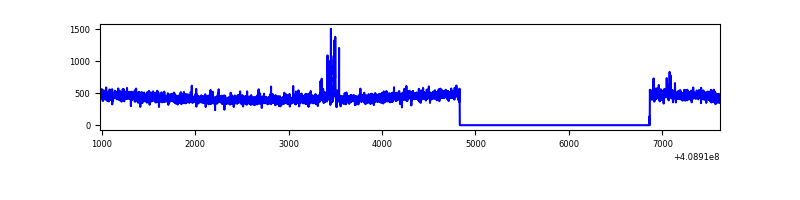 |
| C | 6634 | 4602 | 0 | 0 | 0.00% | 0.00% | 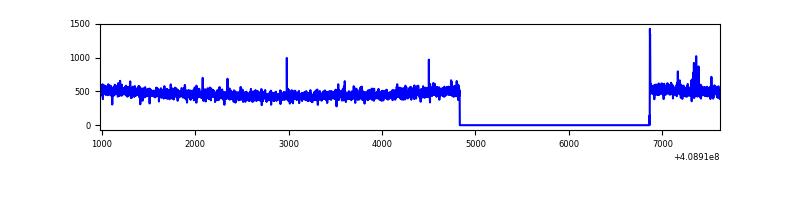 |
| D | 6634 | 4602 | 64 | 64 | 0.96% | 1.39% | 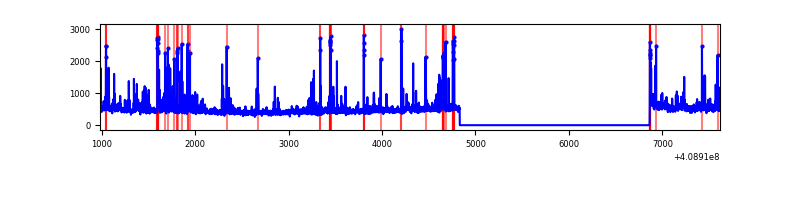 |
Top three noisy pixels from each quadrant. If the there are fewer than three noisy pixels in the level2.evt file, extra rows are filled as -1
| Pixel properties | Quadrant properties | ||||||
|---|---|---|---|---|---|---|---|
| Quadrant | DetID | PixID | Counts | Sigma | Mean | Median | Sigma |
| A | 15 | 222 | 1165396 | 11799.1 | 485 | 476 | 98.7 |
| A | 10 | 83 | 299652 | 3030.26 | 485 | 476 | 98.7 |
| A | 13 | 248 | 151920 | 1533.93 | 485 | 476 | 98.7 |
| B | 5 | 172 | 38707 | 402.13 | 497 | 483 | 95.1 |
| B | 12 | 111 | 11728 | 118.3 | 497 | 483 | 95.1 |
| B | 0 | 230 | 10984 | 110.47 | 497 | 483 | 95.1 |
| C | 15 | 214 | 189956 | 1641.1 | 493 | 496 | 115.4 |
| C | 9 | 54 | 12714 | 105.83 | 493 | 496 | 115.4 |
| C | 15 | 159 | 7097 | 57.18 | 493 | 496 | 115.4 |
| D | 12 | 235 | 210905 | 1780.6 | 486 | 473 | 118.2 |
| D | 12 | 227 | 130378 | 1099.21 | 486 | 473 | 118.2 |
| D | 13 | 249 | 103557 | 872.26 | 486 | 473 | 118.2 |
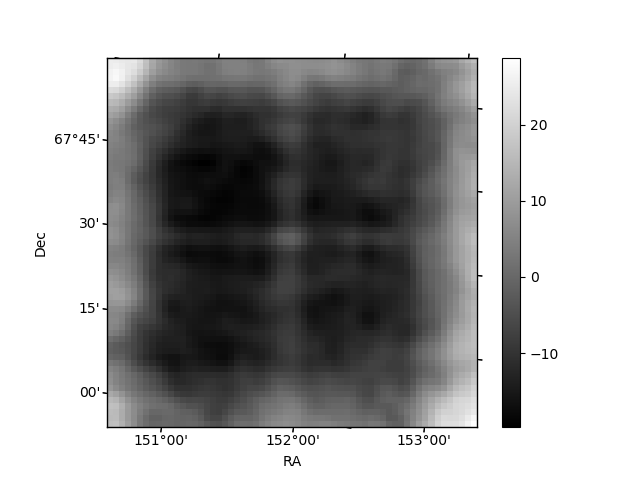
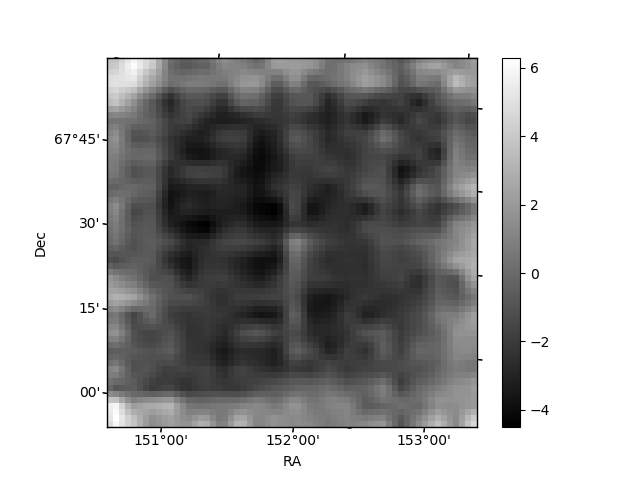
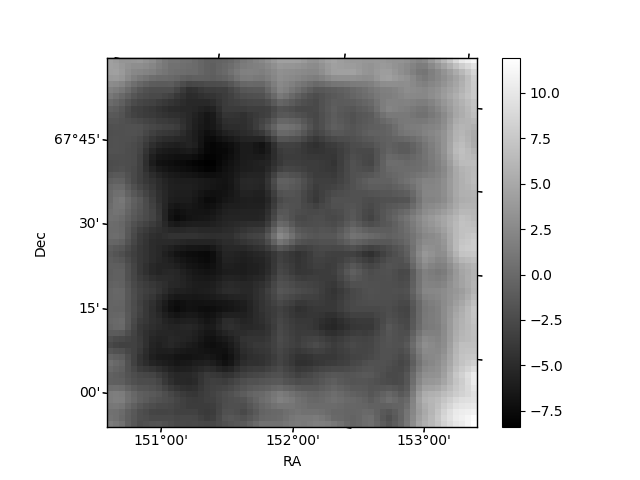
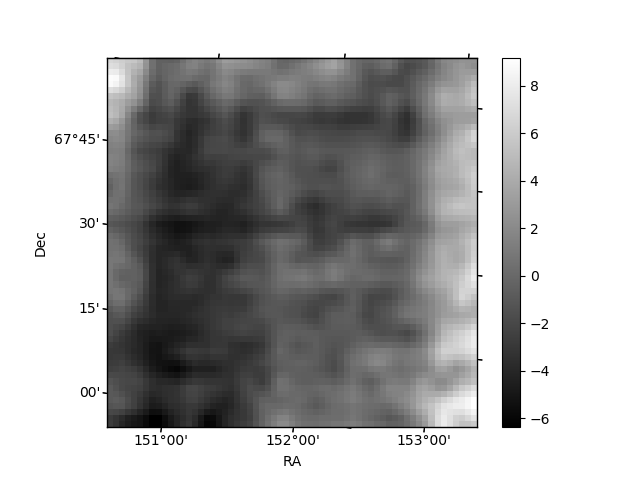
Histogram calculated using DETX and DETY for each event in the final _common_clean file
| Quadrant A | 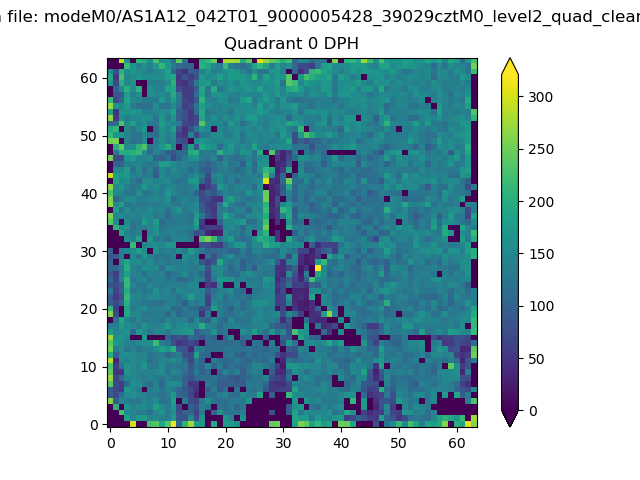 |
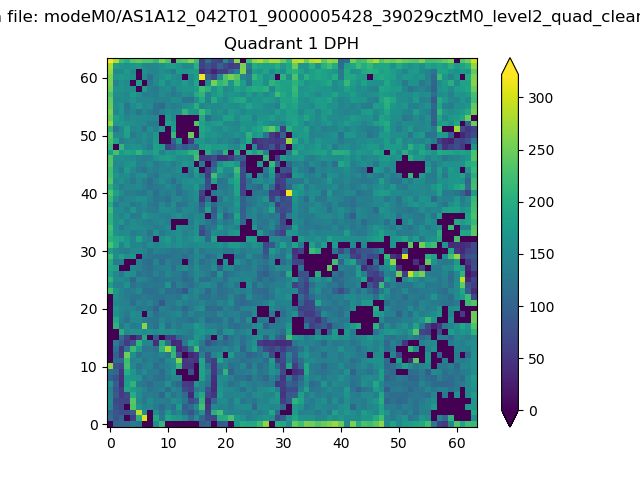 |
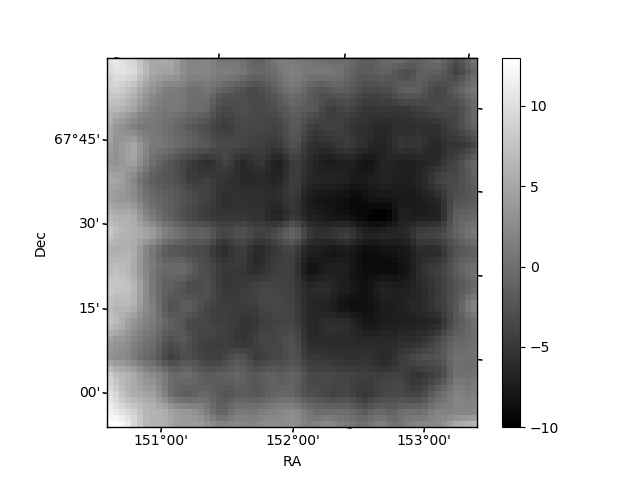
Quadrant B |
|---|---|---|---|
| Quadrant D | 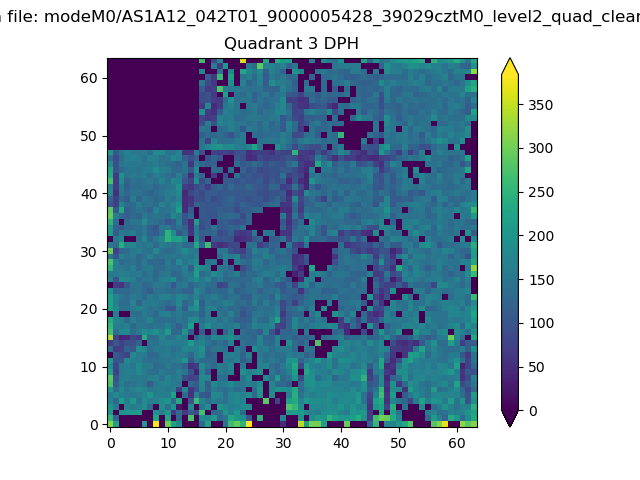 |
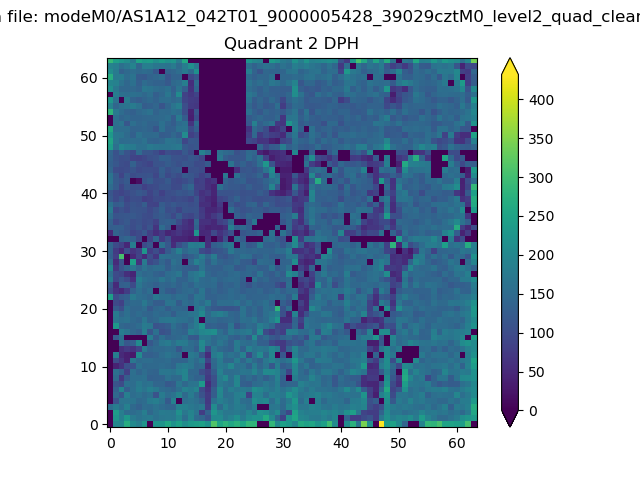 |
Quadrant C |
| Plot type | Count rate plots | Images |
|---|---|---|
| Comparison with Poisson distribution Blue bars denote a histogram of data divided into 1 sec bins. Red curve is a Poisson curve with rate = median count rate of data. |
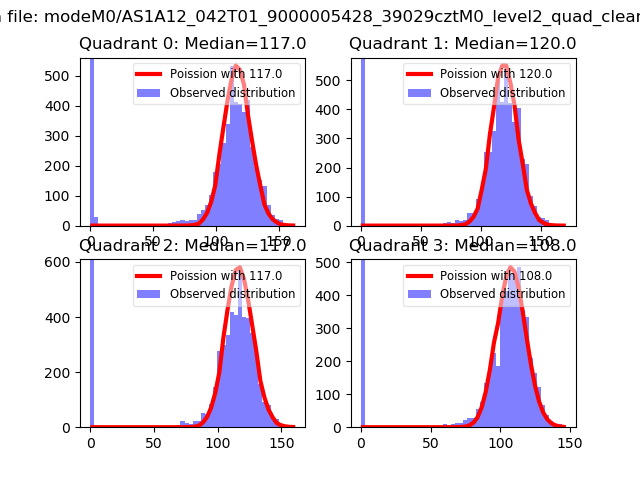 |
 |
| Quadrant-wise count rates Data is divided into 100 sec bins |
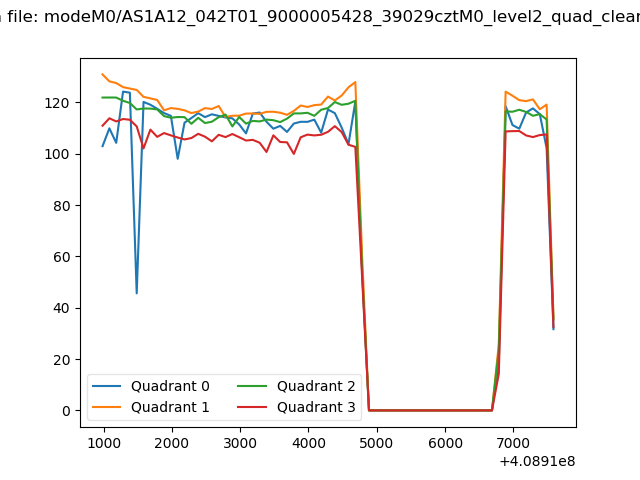 |
|
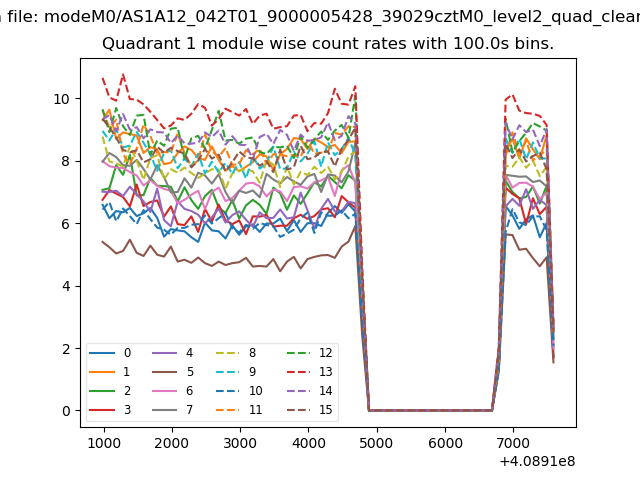
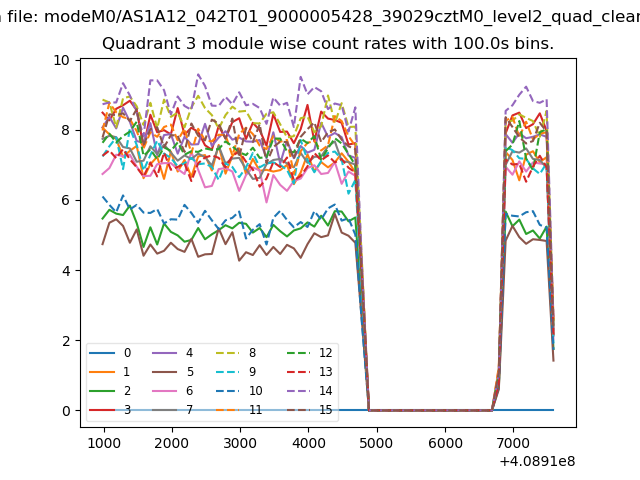
| Module-wise count rates for Quadrant A Data is divided into 100 sec bins |
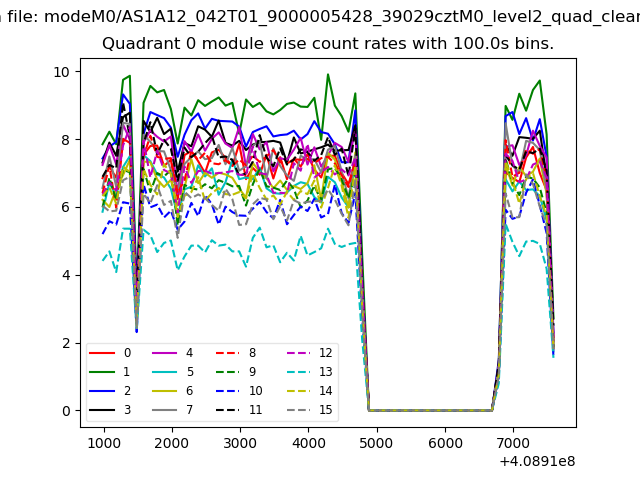 |
 |
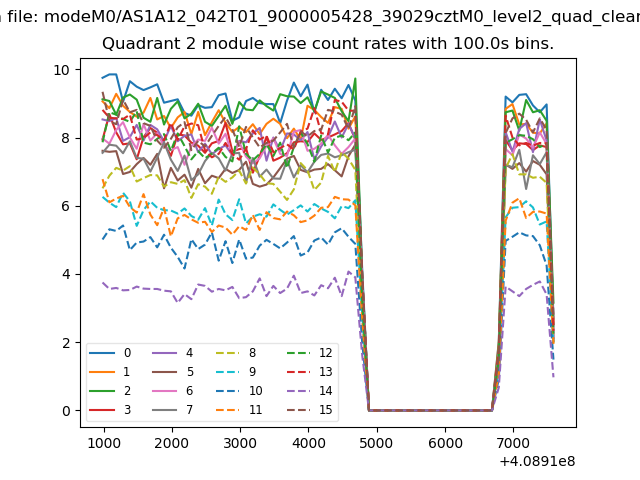
| Module-wise count rates for Quadrant B Data is divided into 100 sec bins |
 |
 |
| Module-wise count rates for Quadrant C Data is divided into 100 sec bins |
 |
 |
| Module-wise count rates for Quadrant D Data is divided into 100 sec bins |
 |
 |
| Parameter | Plot |
|---|---|
| CZT HV Monitor | 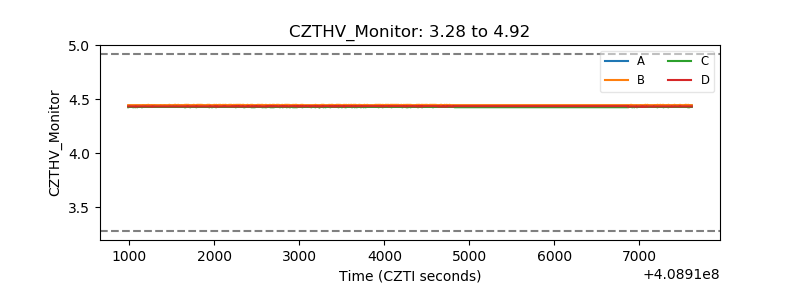 |
| D_VDD |  |
| Temperature 1 | 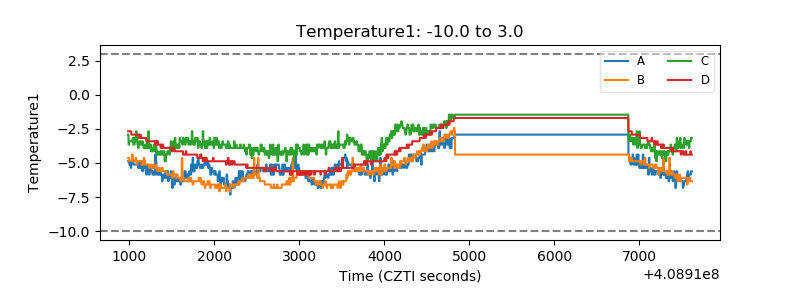 |
| Veto HV Monitor | 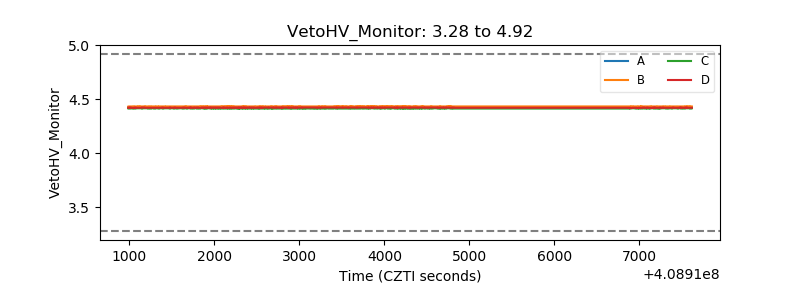 |
| Veto LLD | 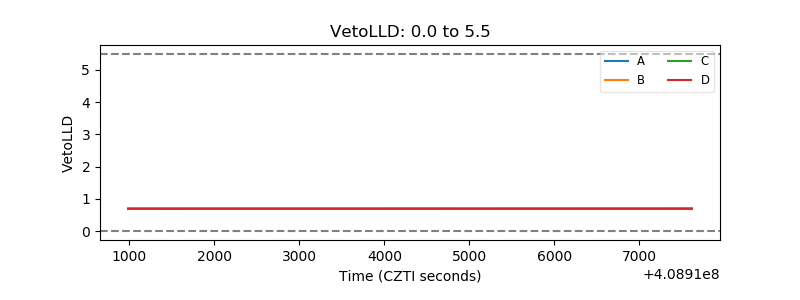 |
| Alpha Counter | 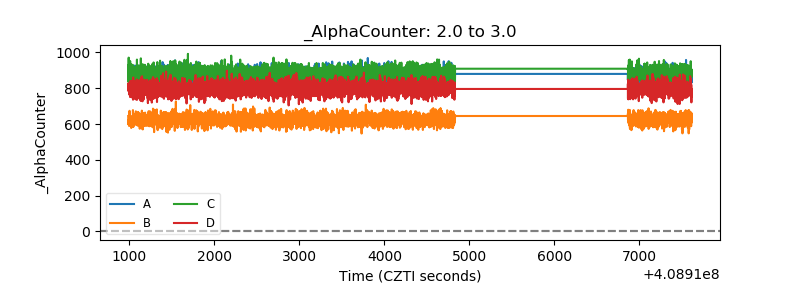 |
| _CPM_Rate | 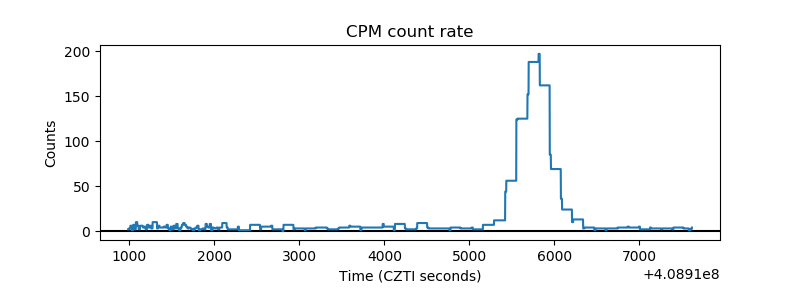 |
| CZT Counter | 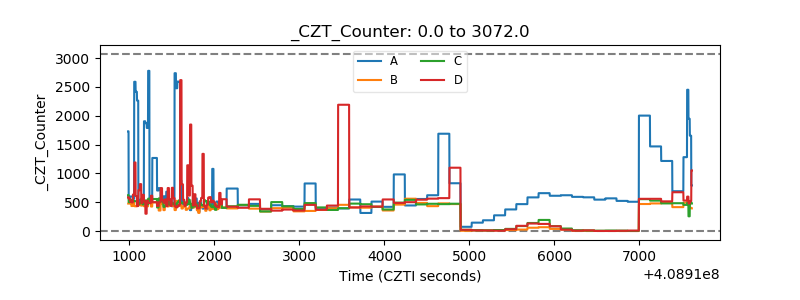 |
| +2.5 Volts monitor | 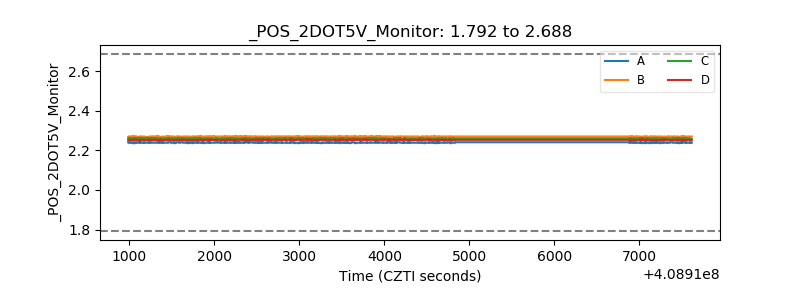 |
| +5 Volts monitor | 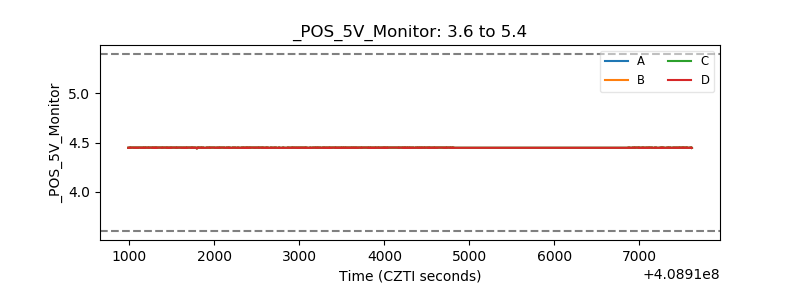 |
| _ROLL_ROT | 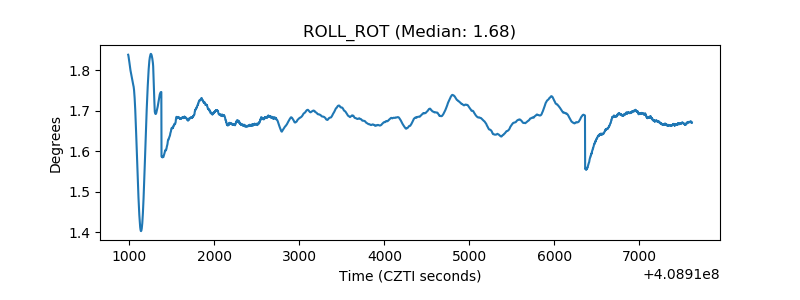 |
| _Roll_DEC | 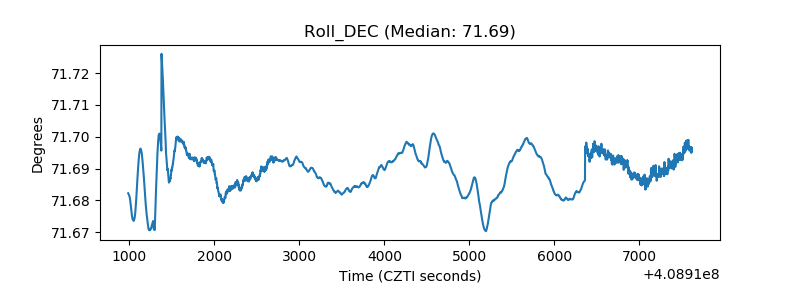 |
| _Roll_RA | 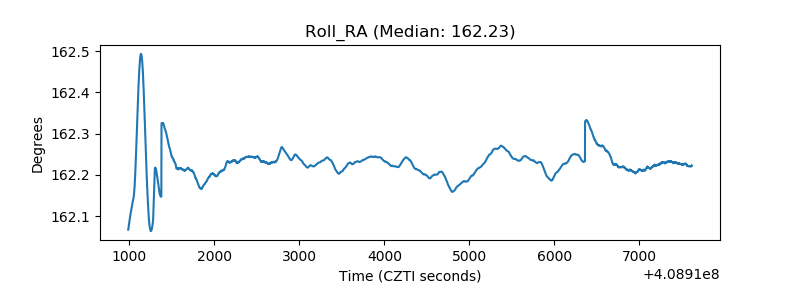 |
| Veto Counter | 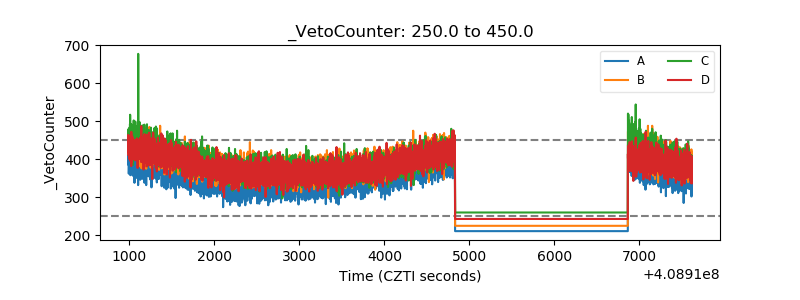 |