| Param | Original file | Final file |
|---|---|---|
| Filename | modeM0/AS1A12_042T01_9000005428_39030cztM0_level2.fits | modeM0/AS1A12_042T01_9000005428_39030cztM0_level2_quad_clean.evt |
| Size (bytes) | 335,361,600 | 90,783,360 |
| Size | 319.8 MB | 86.6 MB |
| Events in quadrant A | 4,192,707 | 589,817 |
| Events in quadrant B | 2,427,849 | 623,628 |
| Events in quadrant C | 2,505,542 | 601,852 |
| Events in quadrant D | 2,866,761 | 555,671 |
| Mode M0 | |||
|---|---|---|---|
| Quadrant | BADHDUFLAG | Total packets | Discarded packets |
| A | 0 | 16077 | 3 |
| B | 0 | 11149 | 2 |
| C | 0 | 10935 | 2 |
| D | 0 | 12230 | 2 |
| Mode SS | |||
|---|---|---|---|
| Quadrant | BADHDUFLAG | Total packets | Discarded packets |
| A | 0 | 108 | 0 |
| B | 0 | 108 | 0 |
| C | 0 | 108 | 0 |
| D | 0 | 108 | 0 |
| Mode M9 | |||
|---|---|---|---|
| Quadrant | BADHDUFLAG | Total packets | Discarded packets |
| A | 0 | 28 | 0 |
| B | 0 | 28 | 0 |
| C | 0 | 28 | 0 |
| D | 0 | 29 | 0 |
| Quadrant | Total seconds | Saturated seconds | Saturation percentage |
|---|---|---|---|
| A | 5405 | 244 | 4.514339% |
| B | 5405 | 18 | 0.333025% |
| C | 5405 | 6 | 0.111008% |
| D | 5405 | 51 | 0.943571% |
Noise dominated data is calculated using 1-second bins in cleaned event files. If a bin has >2000 counts, and if more than 50% of those come from <1% of pixels, then it is considered to be noise-dominated and hence unusable.
| Quadrant | # 1 sec bins | Bins with >0 counts | Bins with >2000 counts | High rate bins dominated by noise | Noise dominated (total time) | Noise dominated (detector-on time) | Marked lightcurve |
|---|---|---|---|---|---|---|---|
| A | 7138 | 5406 | 236 | 236 | 3.31% | 4.37% | 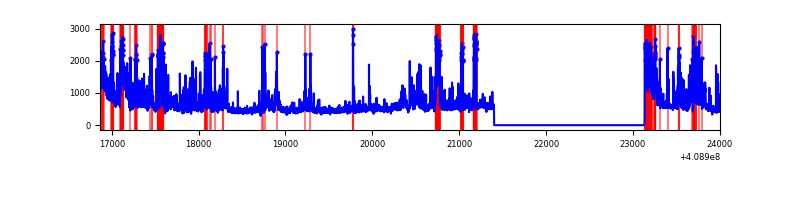 |
| B | 7138 | 5406 | 13 | 13 | 0.18% | 0.24% | 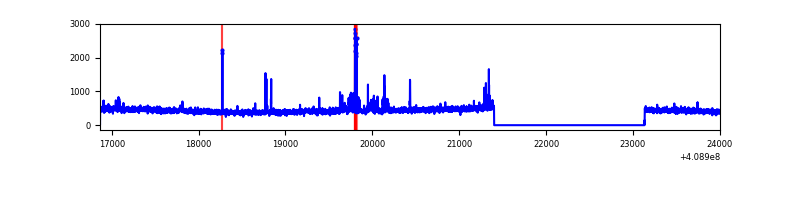 |
| C | 7138 | 5406 | 2 | 2 | 0.03% | 0.04% | 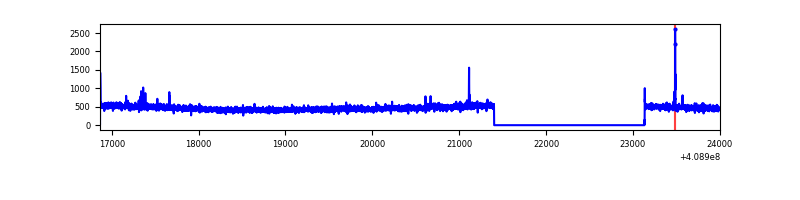 |
| D | 7138 | 5406 | 51 | 51 | 0.71% | 0.94% | 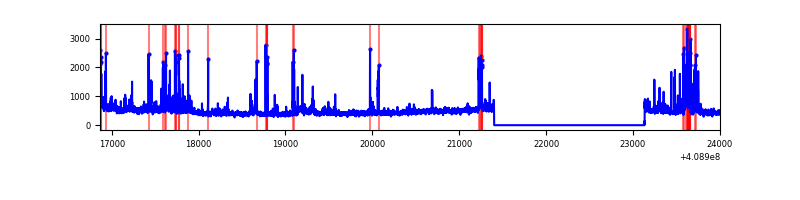 |
Top three noisy pixels from each quadrant. If the there are fewer than three noisy pixels in the level2.evt file, extra rows are filled as -1
| Pixel properties | Quadrant properties | ||||||
|---|---|---|---|---|---|---|---|
| Quadrant | DetID | PixID | Counts | Sigma | Mean | Median | Sigma |
| A | 15 | 222 | 1387999 | 12036.42 | 571 | 558 | 115.3 |
| A | 10 | 83 | 412423 | 3573.04 | 571 | 558 | 115.3 |
| A | 13 | 248 | 131955 | 1139.9 | 571 | 558 | 115.3 |
| B | 5 | 172 | 122400 | 1100.24 | 578 | 562 | 110.7 |
| B | 0 | 230 | 18556 | 162.49 | 578 | 562 | 110.7 |
| B | 12 | 111 | 13901 | 120.46 | 578 | 562 | 110.7 |
| C | 15 | 214 | 228742 | 1728.06 | 573 | 577 | 132.0 |
| C | 15 | 159 | 15872 | 115.84 | 573 | 577 | 132.0 |
| C | 1 | 128 | 6467 | 44.61 | 573 | 577 | 132.0 |
| D | 12 | 235 | 245358 | 1773.88 | 566 | 550 | 138.0 |
| D | 2 | 249 | 137070 | 989.22 | 566 | 550 | 138.0 |
| D | 13 | 171 | 129066 | 931.23 | 566 | 550 | 138.0 |
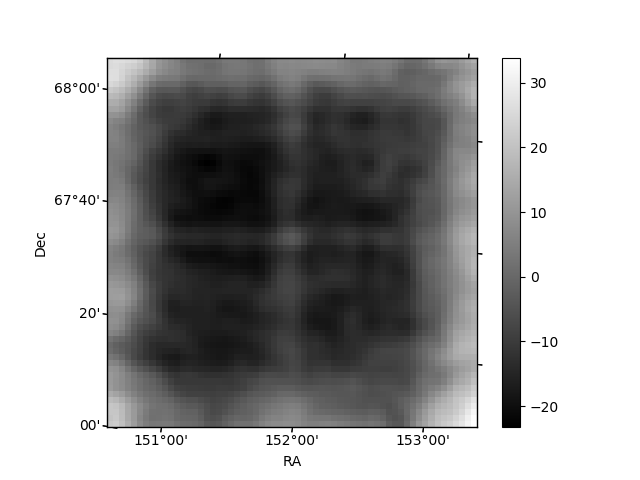
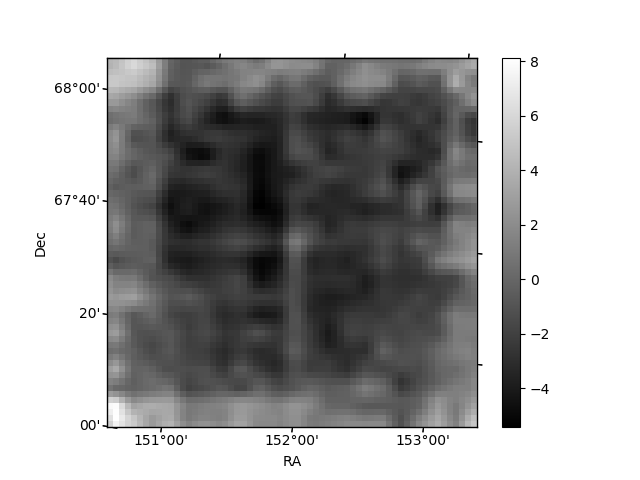
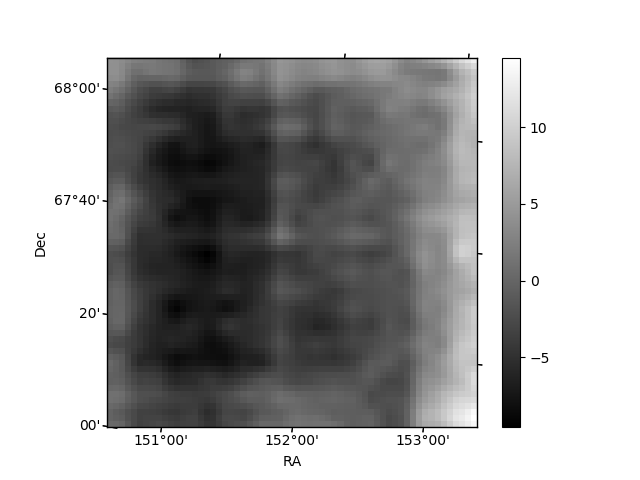
Histogram calculated using DETX and DETY for each event in the final _common_clean file
| Quadrant A | 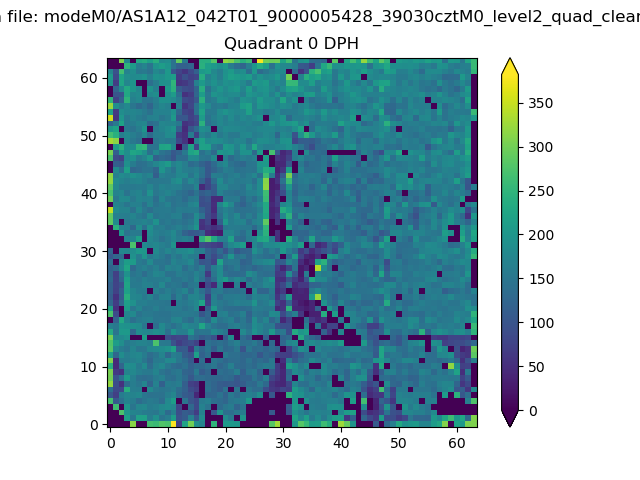 |
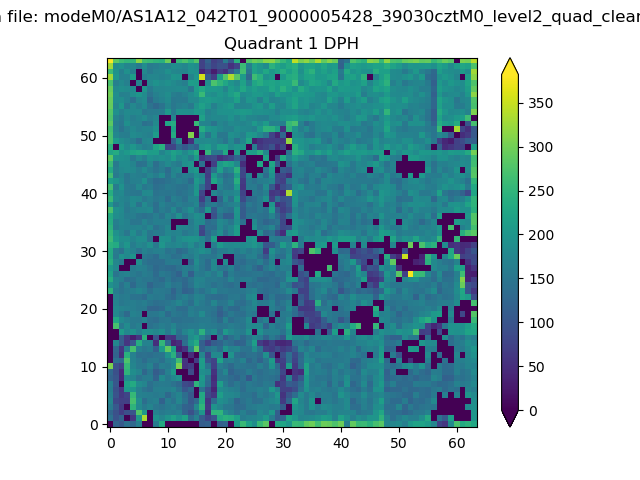 |
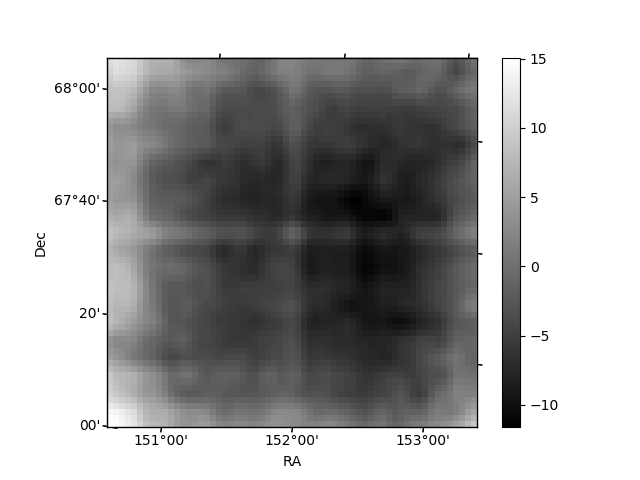
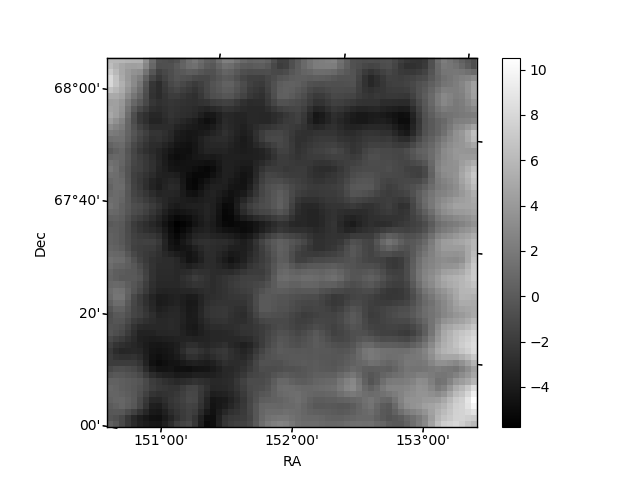
Quadrant B |
|---|---|---|---|
| Quadrant D | 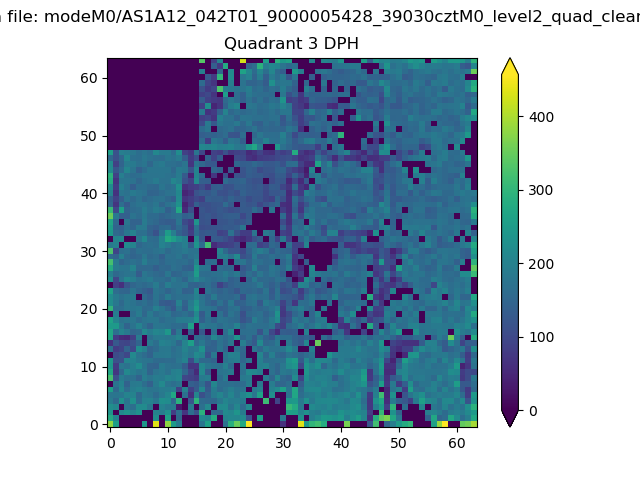 |
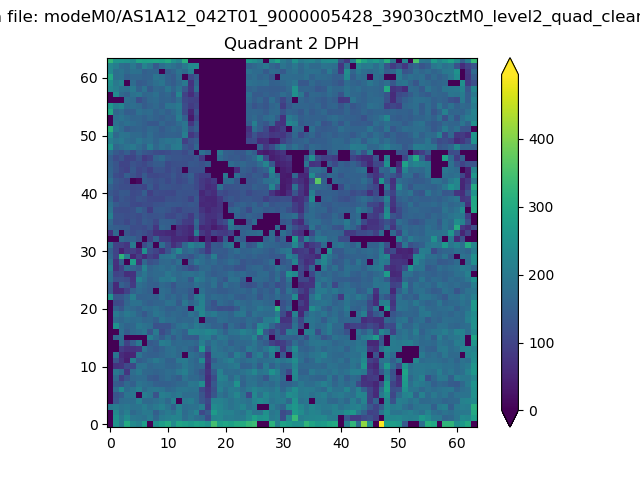 |
Quadrant C |
| Plot type | Count rate plots | Images |
|---|---|---|
| Comparison with Poisson distribution Blue bars denote a histogram of data divided into 1 sec bins. Red curve is a Poisson curve with rate = median count rate of data. |
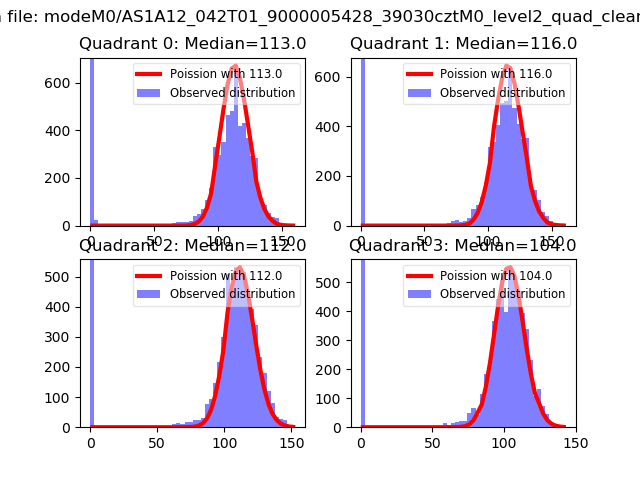 |
 |
| Quadrant-wise count rates Data is divided into 100 sec bins |
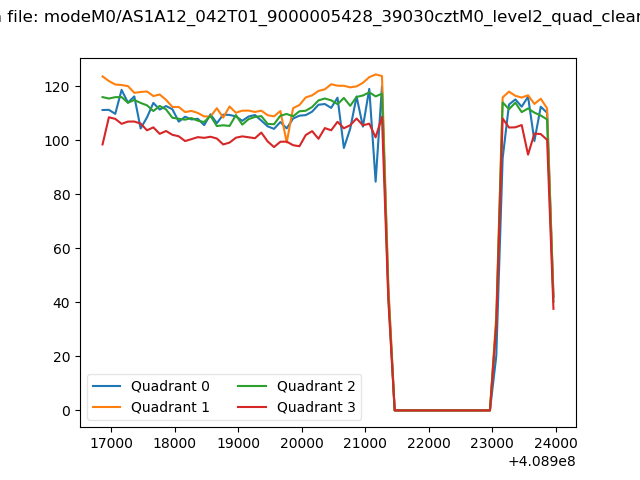 |
|
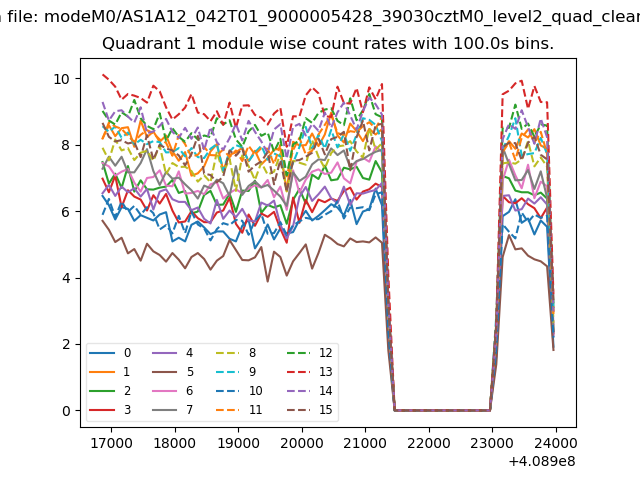
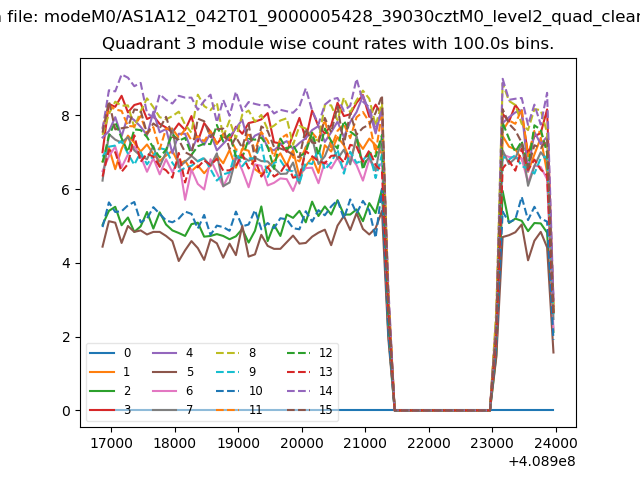
| Module-wise count rates for Quadrant A Data is divided into 100 sec bins |
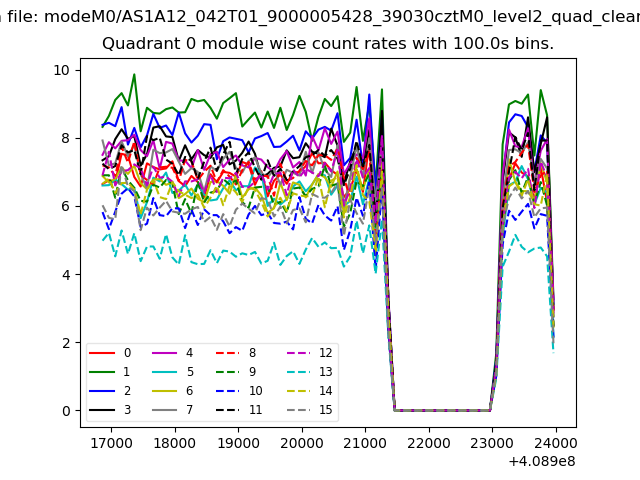 |
 |
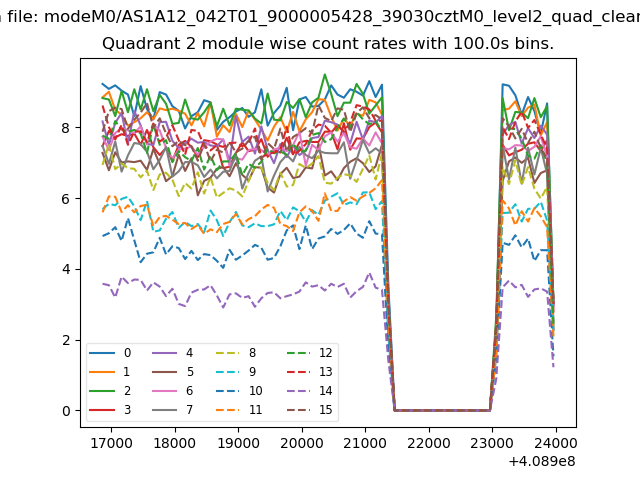
| Module-wise count rates for Quadrant B Data is divided into 100 sec bins |
 |
 |
| Module-wise count rates for Quadrant C Data is divided into 100 sec bins |
 |
 |
| Module-wise count rates for Quadrant D Data is divided into 100 sec bins |
 |
 |
| Parameter | Plot |
|---|---|
| CZT HV Monitor | 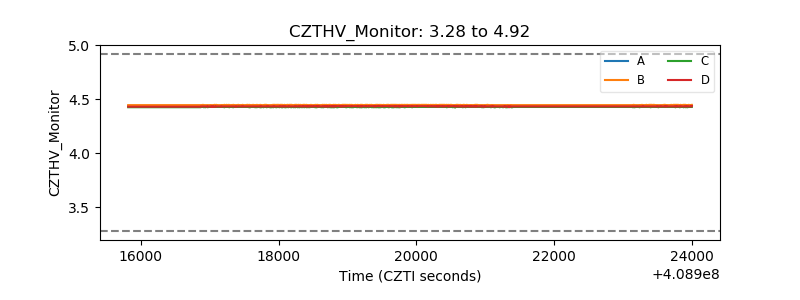 |
| D_VDD | 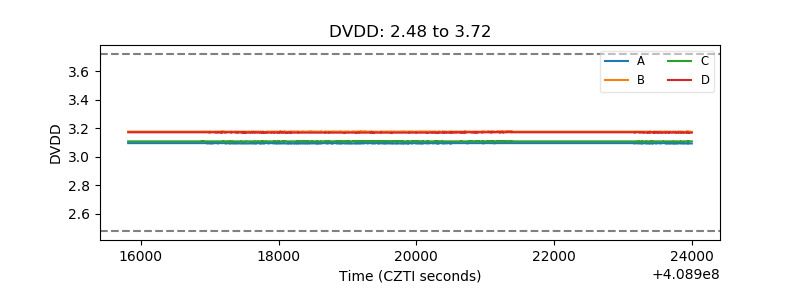 |
| Temperature 1 | 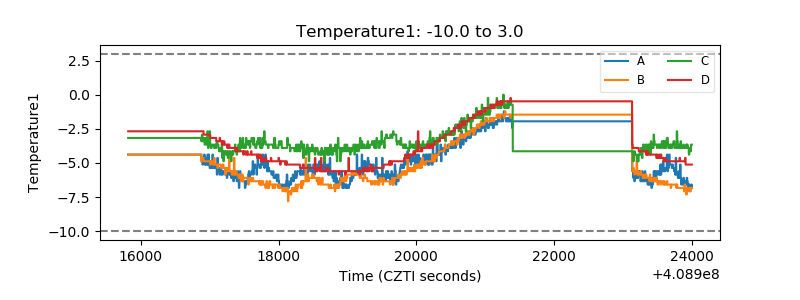 |
| Veto HV Monitor | 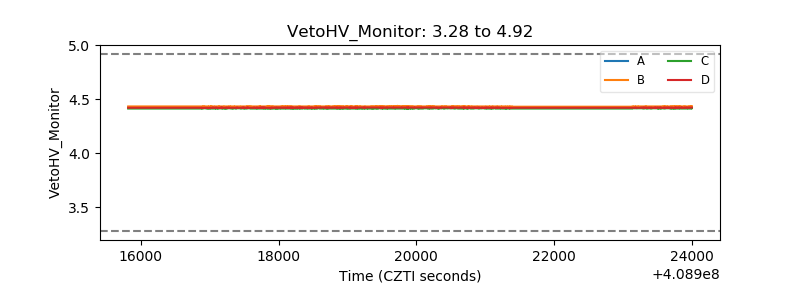 |
| Veto LLD | 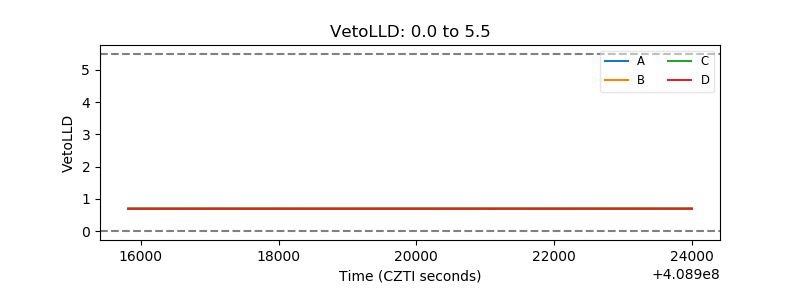 |
| Alpha Counter | 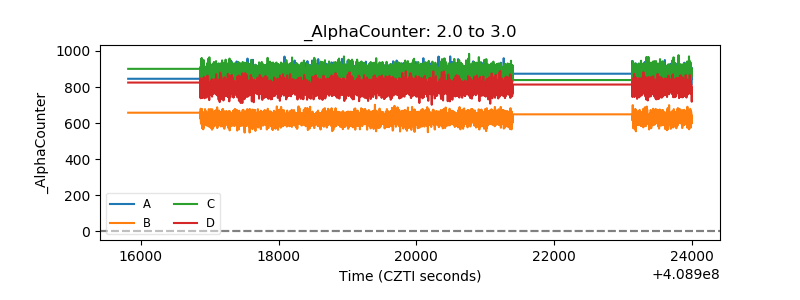 |
| _CPM_Rate | 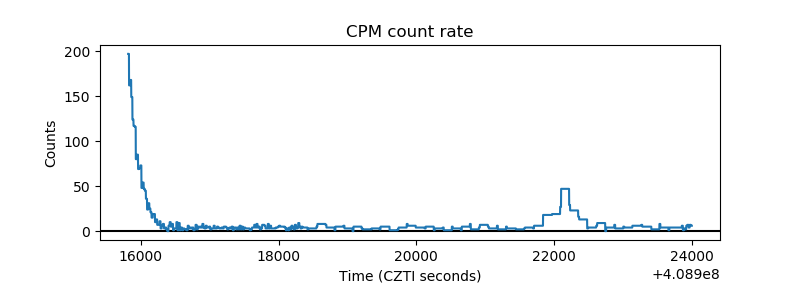 |
| CZT Counter | 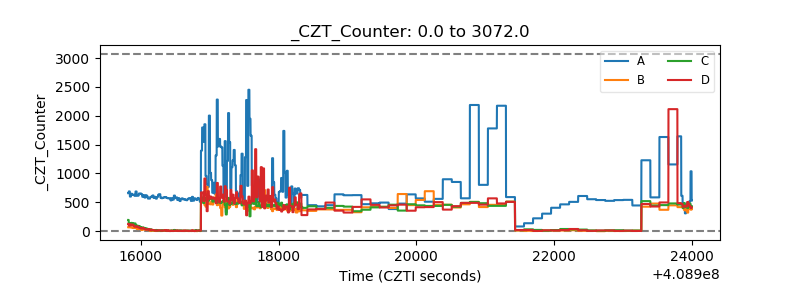 |
| +2.5 Volts monitor | 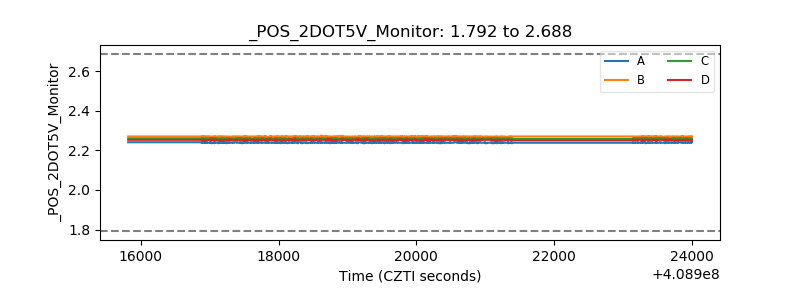 |
| +5 Volts monitor | 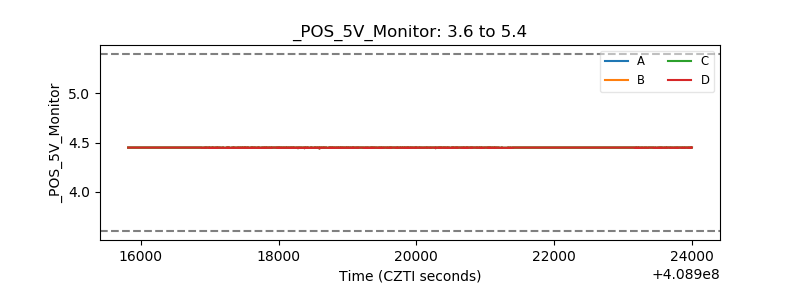 |
| _ROLL_ROT | 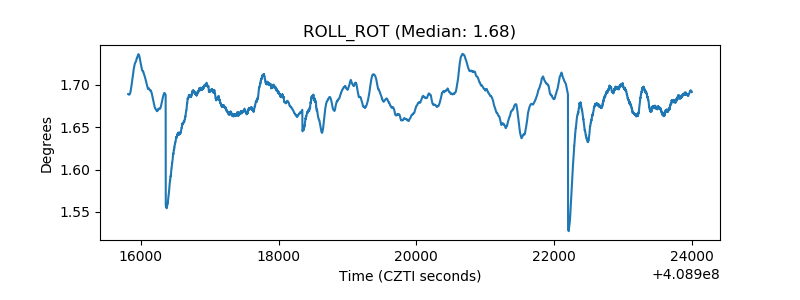 |
| _Roll_DEC | 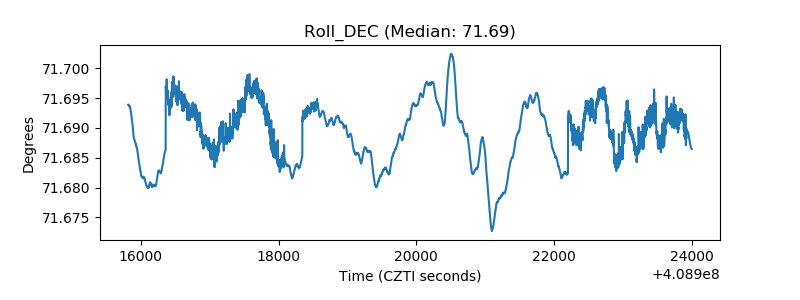 |
| _Roll_RA | 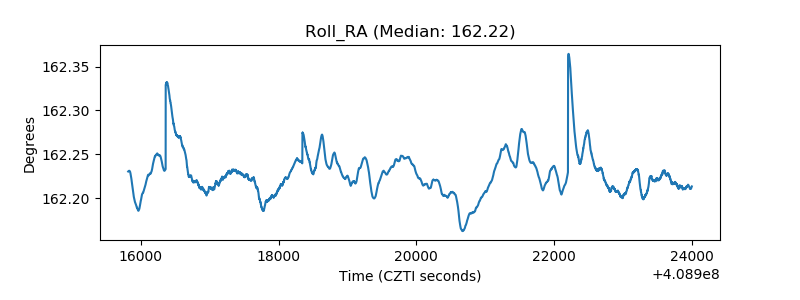 |
| Veto Counter | 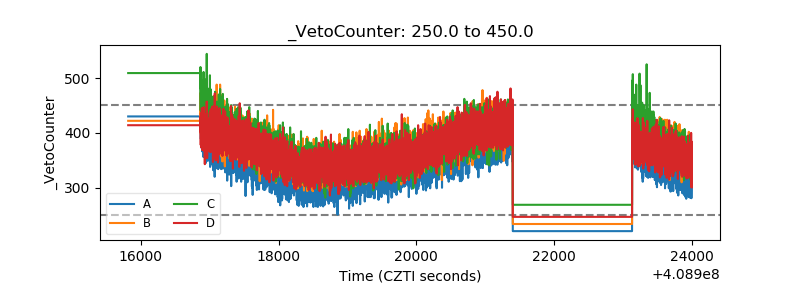 |