| Param | Original file | Final file |
|---|---|---|
| Filename | modeM0/AS1A12_042T01_9000005428_39031cztM0_level2.fits | modeM0/AS1A12_042T01_9000005428_39031cztM0_level2_quad_clean.evt |
| Size (bytes) | 358,416,000 | 92,399,040 |
| Size | 341.8 MB | 88.1 MB |
| Events in quadrant A | 4,727,909 | 592,346 |
| Events in quadrant B | 2,468,446 | 638,084 |
| Events in quadrant C | 2,578,598 | 613,651 |
| Events in quadrant D | 3,057,358 | 562,703 |
| Mode M0 | |||
|---|---|---|---|
| Quadrant | BADHDUFLAG | Total packets | Discarded packets |
| A | 0 | 17851 | 3 |
| B | 0 | 11426 | 2 |
| C | 0 | 11352 | 2 |
| D | 0 | 13092 | 2 |
| Mode SS | |||
|---|---|---|---|
| Quadrant | BADHDUFLAG | Total packets | Discarded packets |
| A | 0 | 114 | 0 |
| B | 0 | 114 | 0 |
| C | 0 | 114 | 0 |
| D | 0 | 114 | 0 |
| Mode M9 | |||
|---|---|---|---|
| Quadrant | BADHDUFLAG | Total packets | Discarded packets |
| A | 0 | 24 | 0 |
| B | 0 | 24 | 0 |
| C | 0 | 24 | 0 |
| D | 0 | 25 | 0 |
| Quadrant | Total seconds | Saturated seconds | Saturation percentage |
|---|---|---|---|
| A | 5588 | 372 | 6.657122% |
| B | 5588 | 20 | 0.357910% |
| C | 5588 | 5 | 0.089477% |
| D | 5588 | 89 | 1.592699% |
Noise dominated data is calculated using 1-second bins in cleaned event files. If a bin has >2000 counts, and if more than 50% of those come from <1% of pixels, then it is considered to be noise-dominated and hence unusable.
| Quadrant | # 1 sec bins | Bins with >0 counts | Bins with >2000 counts | High rate bins dominated by noise | Noise dominated (total time) | Noise dominated (detector-on time) | Marked lightcurve |
|---|---|---|---|---|---|---|---|
| A | 7021 | 5589 | 315 | 315 | 4.49% | 5.64% | 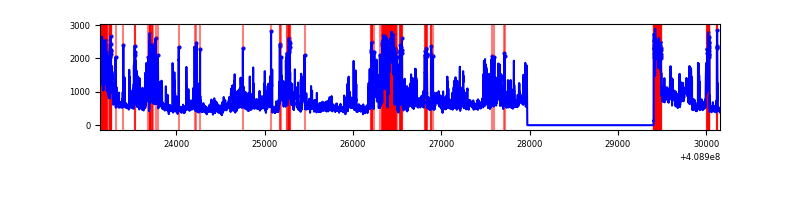 |
| B | 7021 | 5589 | 5 | 5 | 0.07% | 0.09% | 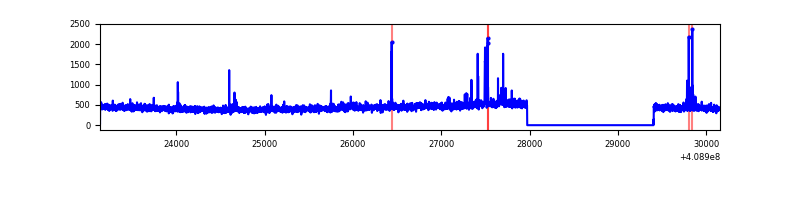 |
| C | 7021 | 5589 | 2 | 2 | 0.03% | 0.04% | 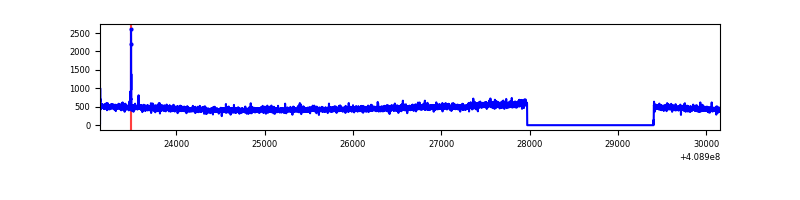 |
| D | 7021 | 5589 | 72 | 72 | 1.03% | 1.29% | 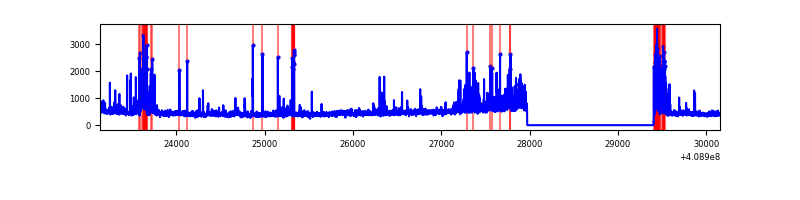 |
Top three noisy pixels from each quadrant. If the there are fewer than three noisy pixels in the level2.evt file, extra rows are filled as -1
| Pixel properties | Quadrant properties | ||||||
|---|---|---|---|---|---|---|---|
| Quadrant | DetID | PixID | Counts | Sigma | Mean | Median | Sigma |
| A | 15 | 222 | 1308313 | 10907.57 | 592 | 579 | 119.9 |
| A | 10 | 83 | 407722 | 3395.91 | 592 | 579 | 119.9 |
| A | 13 | 248 | 326496 | 2718.41 | 592 | 579 | 119.9 |
| B | 5 | 172 | 58903 | 499.77 | 603 | 585 | 116.7 |
| B | 0 | 230 | 20103 | 167.26 | 603 | 585 | 116.7 |
| B | 12 | 111 | 14968 | 123.26 | 603 | 585 | 116.7 |
| C | 15 | 214 | 236550 | 1705.45 | 594 | 597 | 138.4 |
| C | 15 | 159 | 9224 | 62.36 | 594 | 597 | 138.4 |
| C | 3 | 233 | 9213 | 62.28 | 594 | 597 | 138.4 |
| D | 2 | 249 | 354383 | 2459.36 | 585 | 568 | 143.9 |
| D | 12 | 235 | 175607 | 1216.69 | 585 | 568 | 143.9 |
| D | 12 | 227 | 69175 | 476.89 | 585 | 568 | 143.9 |
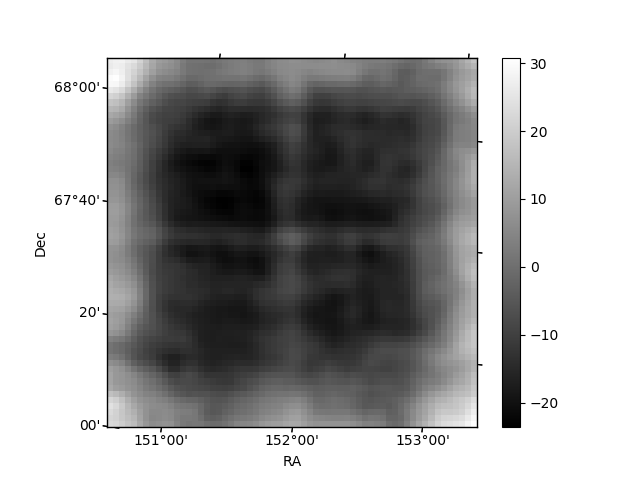
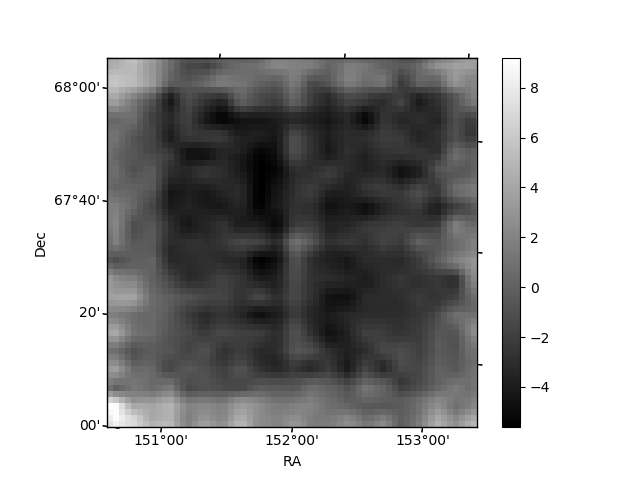
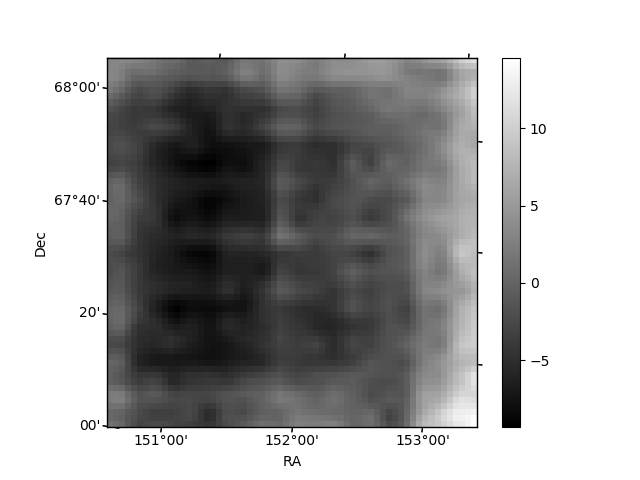
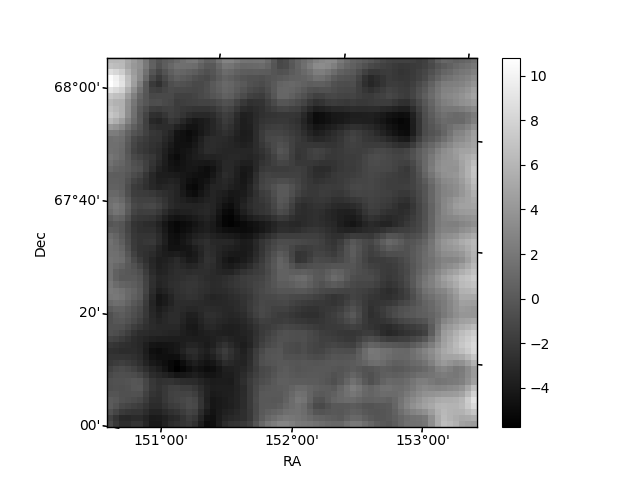
Histogram calculated using DETX and DETY for each event in the final _common_clean file
| Quadrant A | 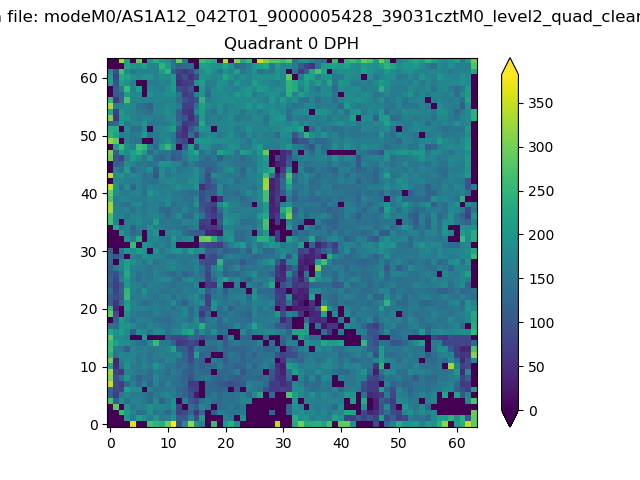 |
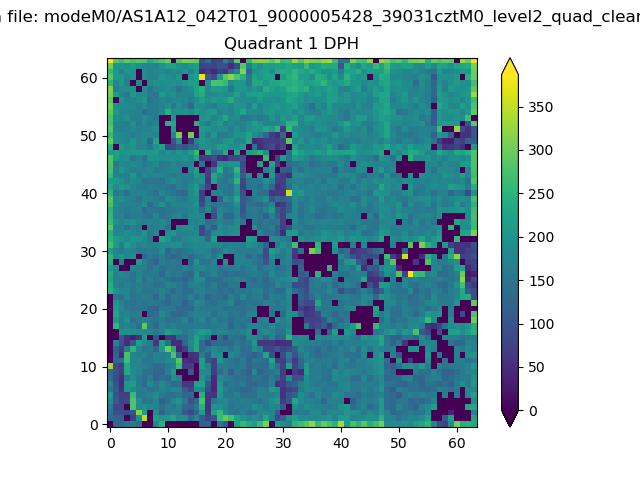 |
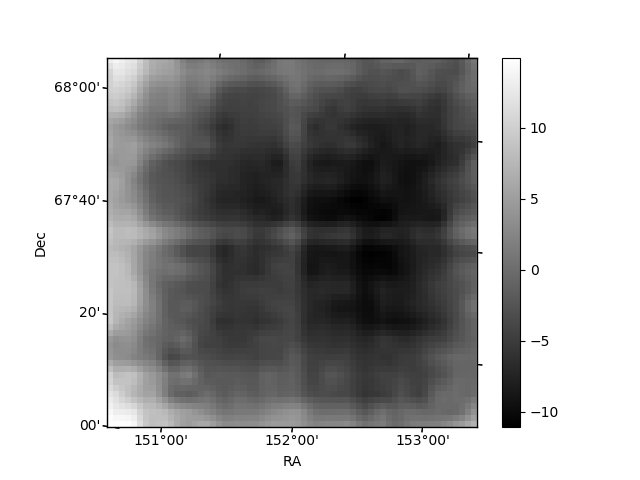
Quadrant B |
|---|---|---|---|
| Quadrant D | 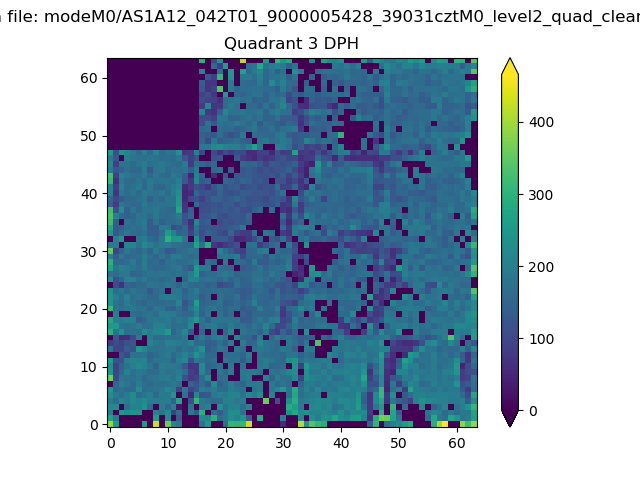 |
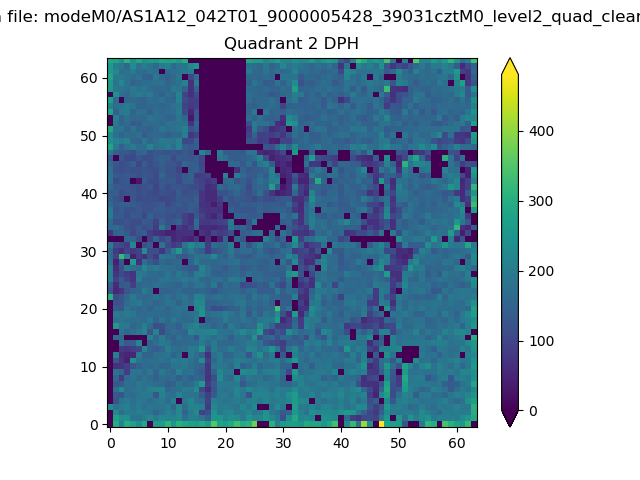 |
Quadrant C |
| Plot type | Count rate plots | Images |
|---|---|---|
| Comparison with Poisson distribution Blue bars denote a histogram of data divided into 1 sec bins. Red curve is a Poisson curve with rate = median count rate of data. |
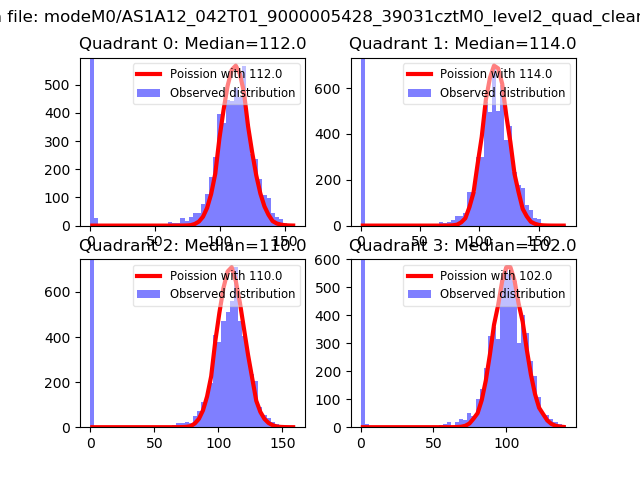 |
 |
| Quadrant-wise count rates Data is divided into 100 sec bins |
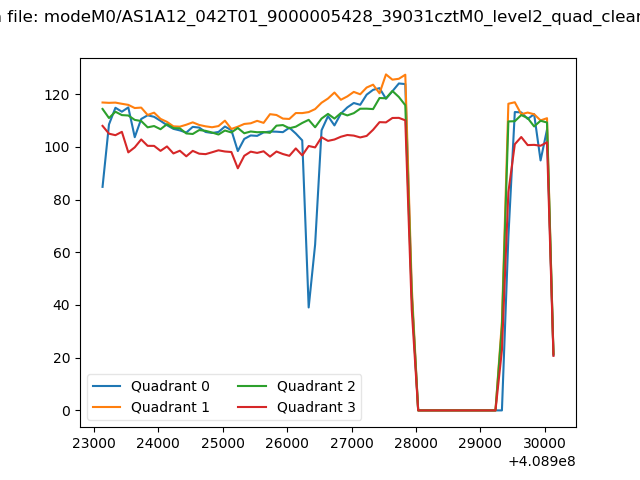 |
|
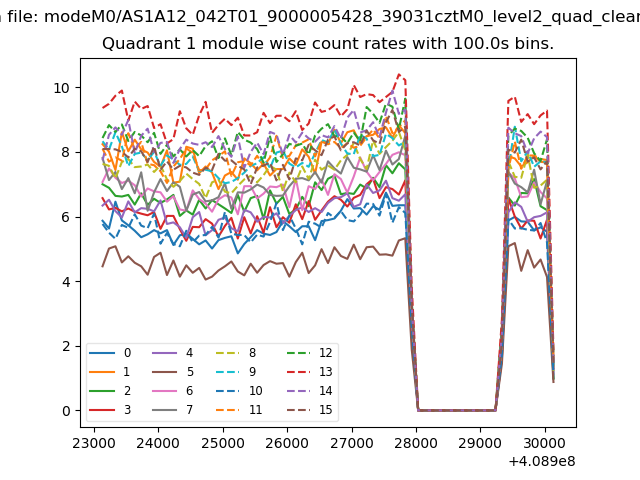
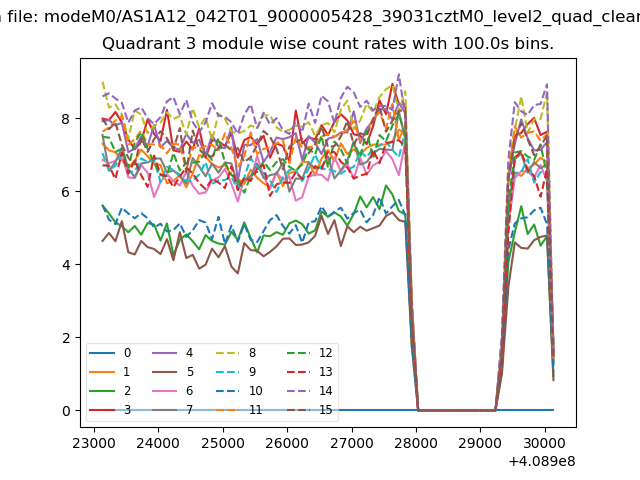
| Module-wise count rates for Quadrant A Data is divided into 100 sec bins |
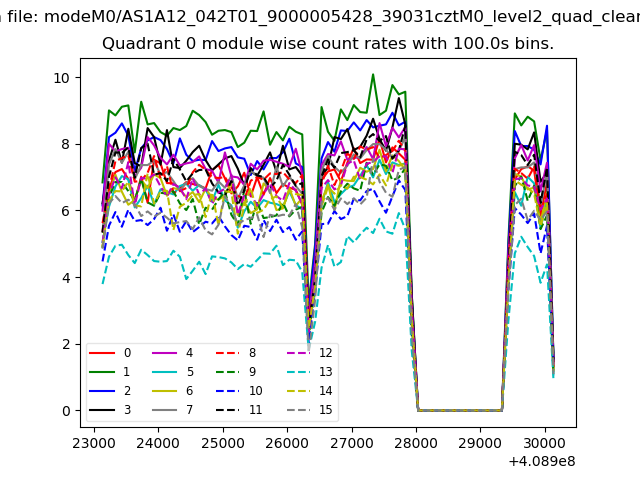 |
 |
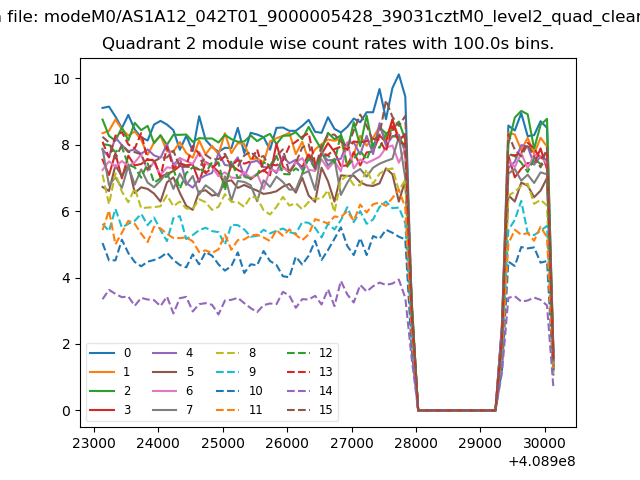
| Module-wise count rates for Quadrant B Data is divided into 100 sec bins |
 |
 |
| Module-wise count rates for Quadrant C Data is divided into 100 sec bins |
 |
 |
| Module-wise count rates for Quadrant D Data is divided into 100 sec bins |
 |
 |
| Parameter | Plot |
|---|---|
| CZT HV Monitor | 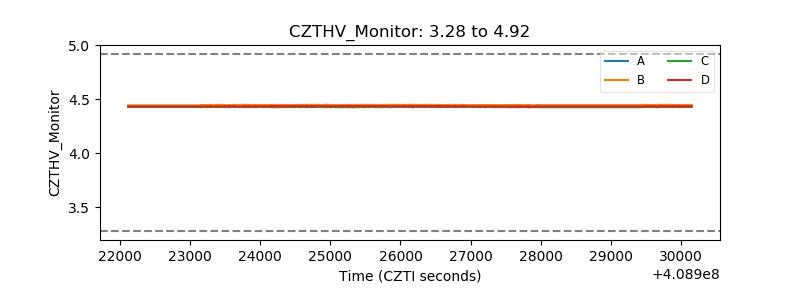 |
| D_VDD | 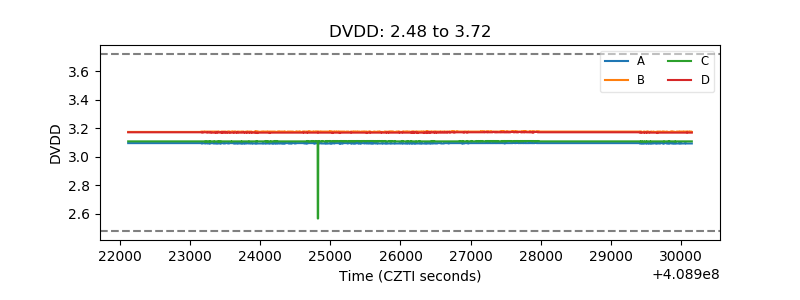 |
| Temperature 1 | 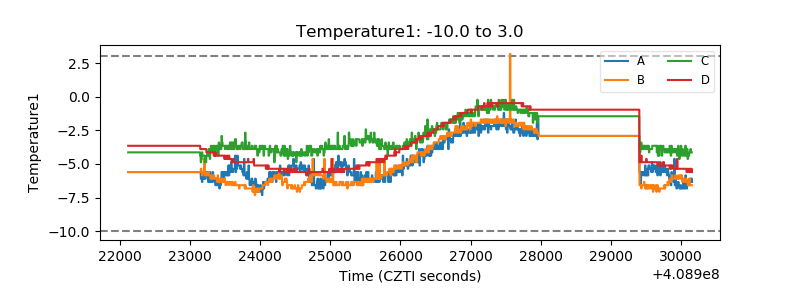 |
| Veto HV Monitor | 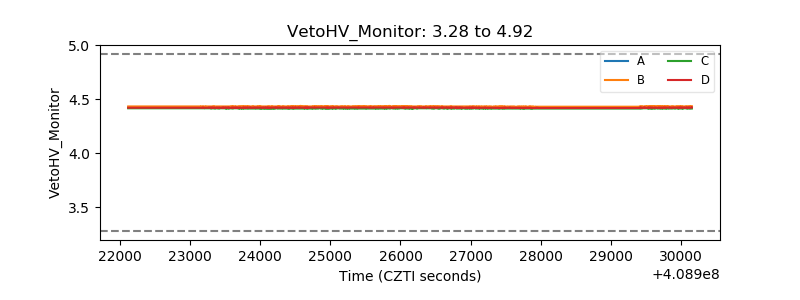 |
| Veto LLD | 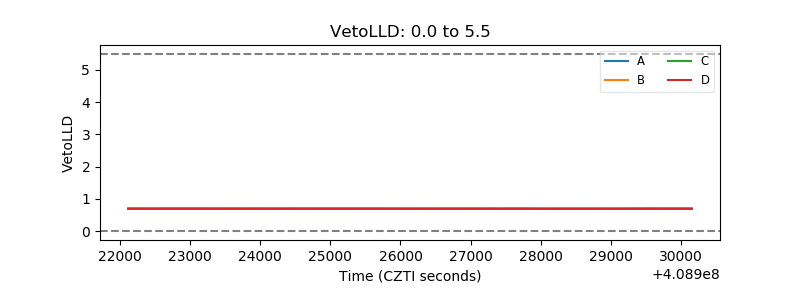 |
| Alpha Counter | 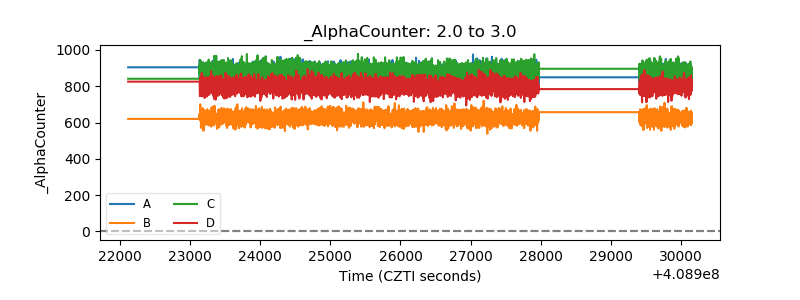 |
| _CPM_Rate | 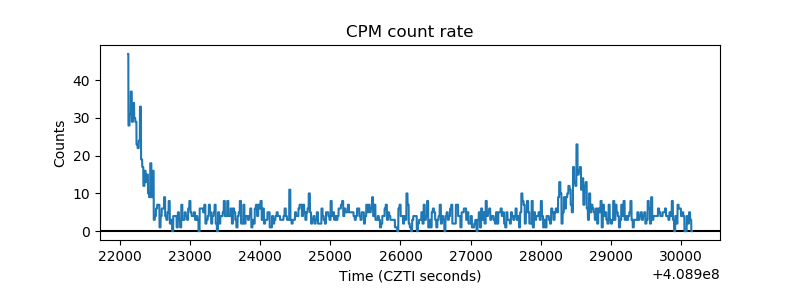 |
| CZT Counter | 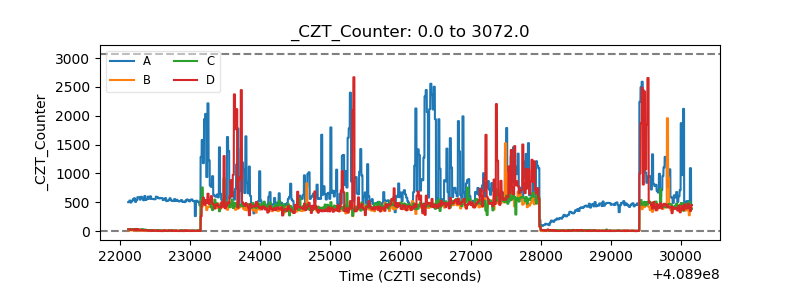 |
| +2.5 Volts monitor | 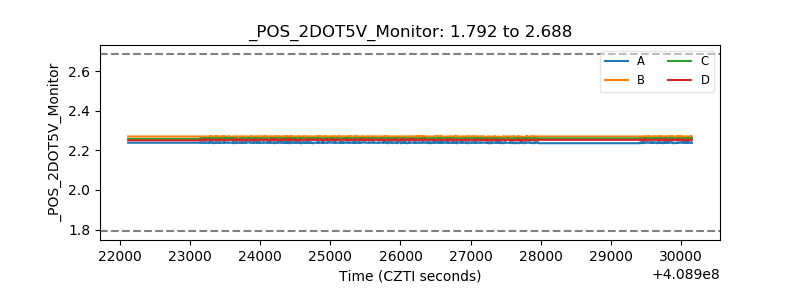 |
| +5 Volts monitor | 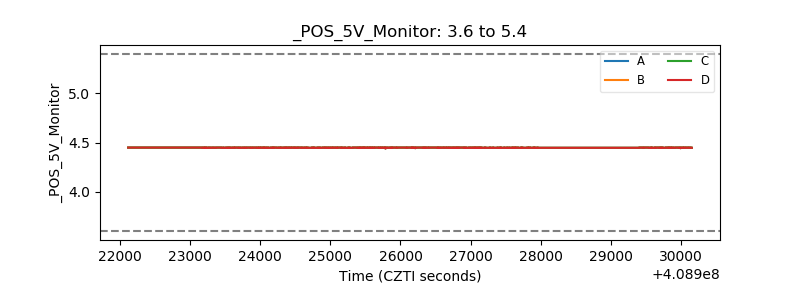 |
| _ROLL_ROT | 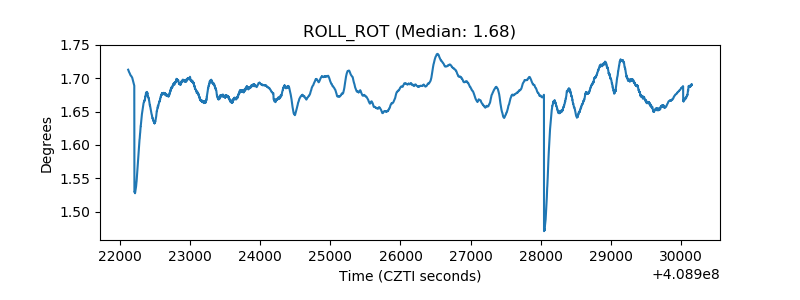 |
| _Roll_DEC | 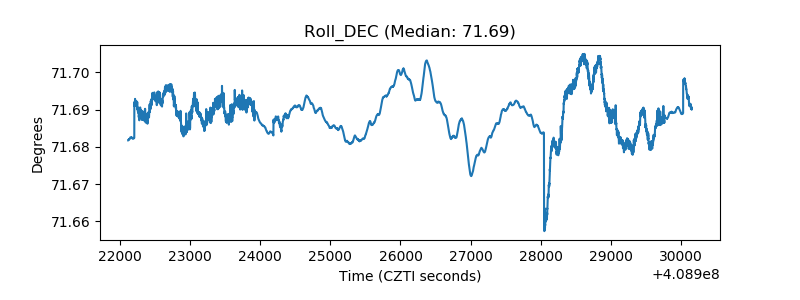 |
| _Roll_RA | 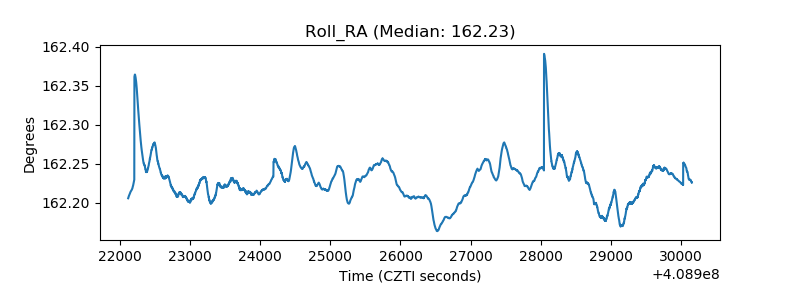 |
| Veto Counter | 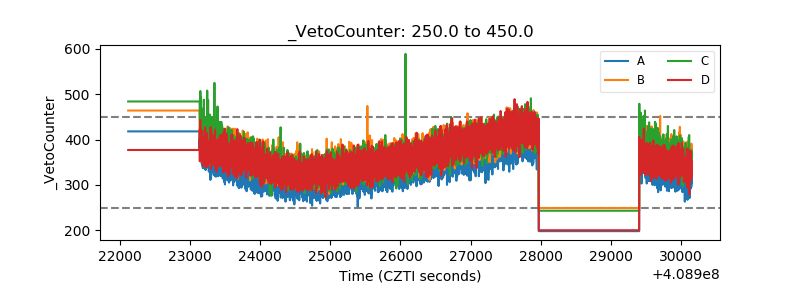 |