| Param | Original file | Final file |
|---|---|---|
| Filename | modeM0/AS1A12_042T01_9000005428_39032cztM0_level2.fits | modeM0/AS1A12_042T01_9000005428_39032cztM0_level2_quad_clean.evt |
| Size (bytes) | 434,269,440 | 109,661,760 |
| Size | 414.2 MB | 104.6 MB |
| Events in quadrant A | 5,439,178 | 711,934 |
| Events in quadrant B | 2,970,263 | 756,777 |
| Events in quadrant C | 3,527,128 | 722,797 |
| Events in quadrant D | 3,622,853 | 665,936 |
| Mode M0 | |||
|---|---|---|---|
| Quadrant | BADHDUFLAG | Total packets | Discarded packets |
| A | 0 | 20894 | 3 |
| B | 0 | 13607 | 2 |
| C | 0 | 15105 | 2 |
| D | 0 | 15593 | 2 |
| Mode SS | |||
|---|---|---|---|
| Quadrant | BADHDUFLAG | Total packets | Discarded packets |
| A | 0 | 138 | 0 |
| B | 0 | 138 | 0 |
| C | 0 | 138 | 0 |
| D | 0 | 138 | 0 |
| Mode M9 | |||
|---|---|---|---|
| Quadrant | BADHDUFLAG | Total packets | Discarded packets |
| A | 0 | 27 | 0 |
| B | 0 | 27 | 0 |
| C | 0 | 27 | 0 |
| D | 0 | 27 | 0 |
| Quadrant | Total seconds | Saturated seconds | Saturation percentage |
|---|---|---|---|
| A | 6634 | 355 | 5.351221% |
| B | 6634 | 28 | 0.422068% |
| C | 6634 | 85 | 1.281278% |
| D | 6634 | 135 | 2.034971% |
Noise dominated data is calculated using 1-second bins in cleaned event files. If a bin has >2000 counts, and if more than 50% of those come from <1% of pixels, then it is considered to be noise-dominated and hence unusable.
| Quadrant | # 1 sec bins | Bins with >0 counts | Bins with >2000 counts | High rate bins dominated by noise | Noise dominated (total time) | Noise dominated (detector-on time) | Marked lightcurve |
|---|---|---|---|---|---|---|---|
| A | 9350 | 6636 | 260 | 260 | 2.78% | 3.92% | 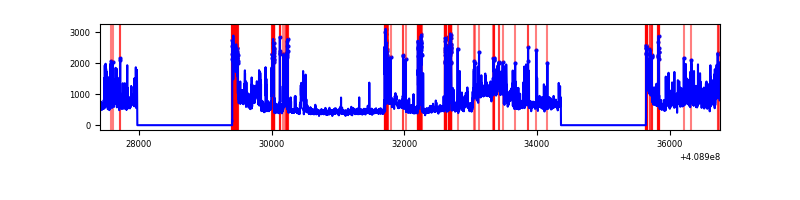 |
| B | 9350 | 6636 | 8 | 8 | 0.09% | 0.12% | 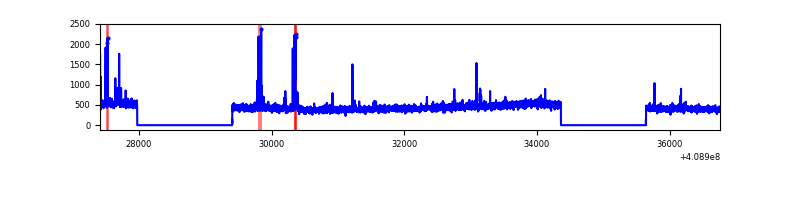 |
| C | 9350 | 6636 | 62 | 62 | 0.66% | 0.93% | 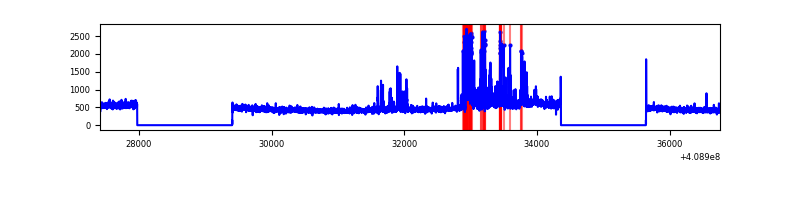 |
| D | 9350 | 6636 | 108 | 108 | 1.16% | 1.63% | 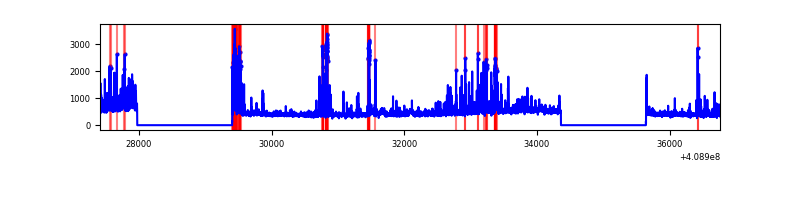 |
Top three noisy pixels from each quadrant. If the there are fewer than three noisy pixels in the level2.evt file, extra rows are filled as -1
| Pixel properties | Quadrant properties | ||||||
|---|---|---|---|---|---|---|---|
| Quadrant | DetID | PixID | Counts | Sigma | Mean | Median | Sigma |
| A | 15 | 222 | 1807621 | 12549.09 | 713 | 699 | 144.0 |
| A | 10 | 83 | 466053 | 3231.89 | 713 | 699 | 144.0 |
| A | 13 | 248 | 212037 | 1467.74 | 713 | 699 | 144.0 |
| B | 5 | 172 | 50207 | 352.23 | 727 | 706 | 140.5 |
| B | 5 | 184 | 41663 | 291.43 | 727 | 706 | 140.5 |
| B | 12 | 111 | 17874 | 122.16 | 727 | 706 | 140.5 |
| C | 15 | 208 | 373460 | 2253.49 | 712 | 717 | 165.4 |
| C | 15 | 214 | 277004 | 1670.35 | 712 | 717 | 165.4 |
| C | 3 | 233 | 83993 | 503.46 | 712 | 717 | 165.4 |
| D | 12 | 227 | 294401 | 1732.88 | 705 | 686 | 169.5 |
| D | 2 | 249 | 226668 | 1333.27 | 705 | 686 | 169.5 |
| D | 12 | 233 | 130993 | 768.8 | 705 | 686 | 169.5 |
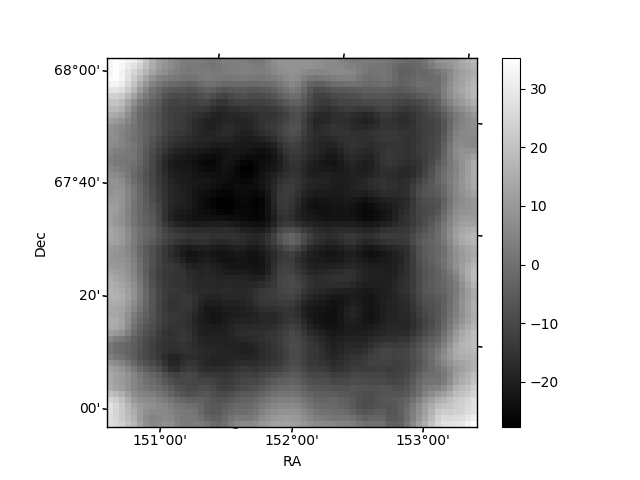
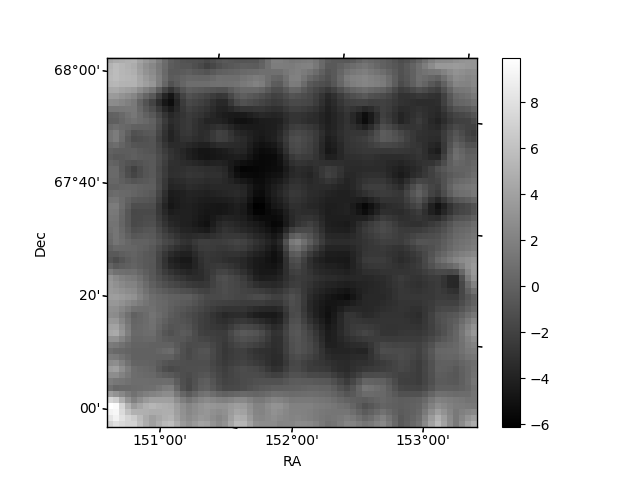
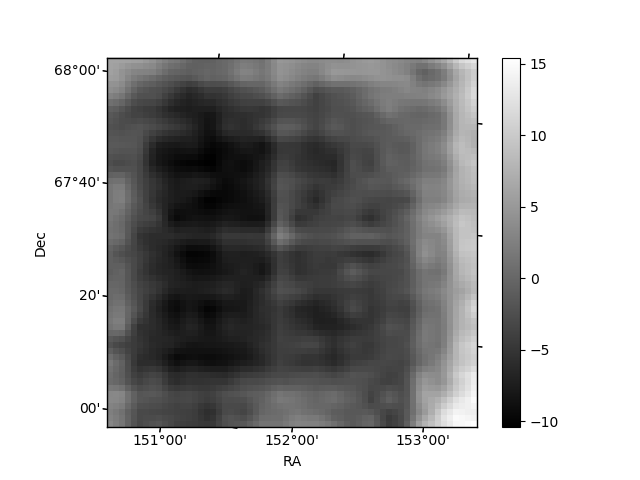
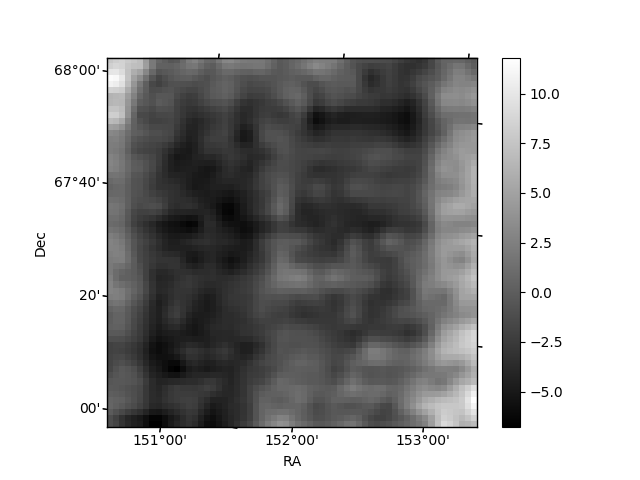
Histogram calculated using DETX and DETY for each event in the final _common_clean file
| Quadrant A | 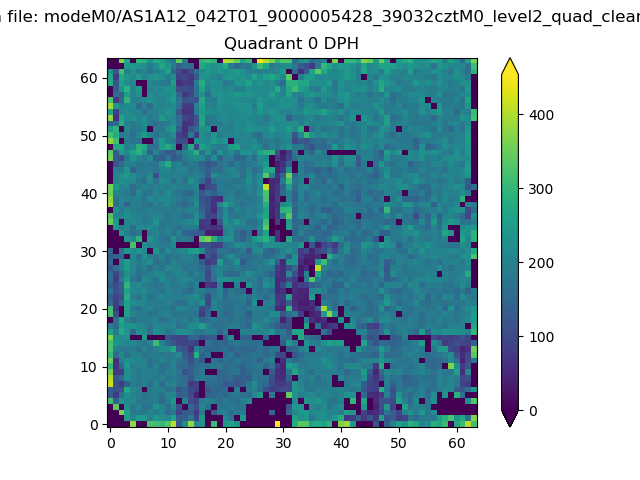 |
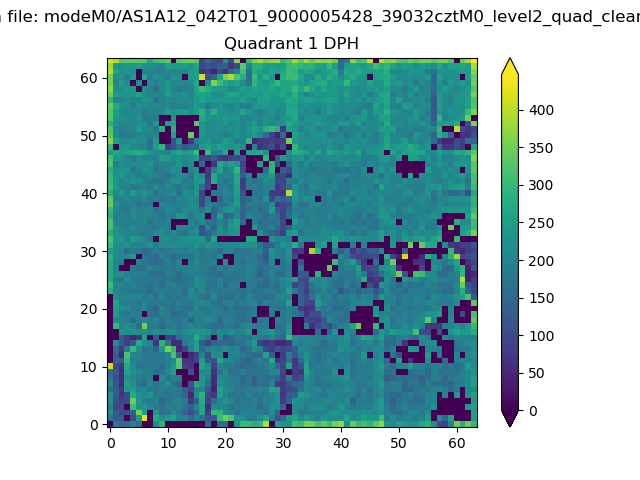 |
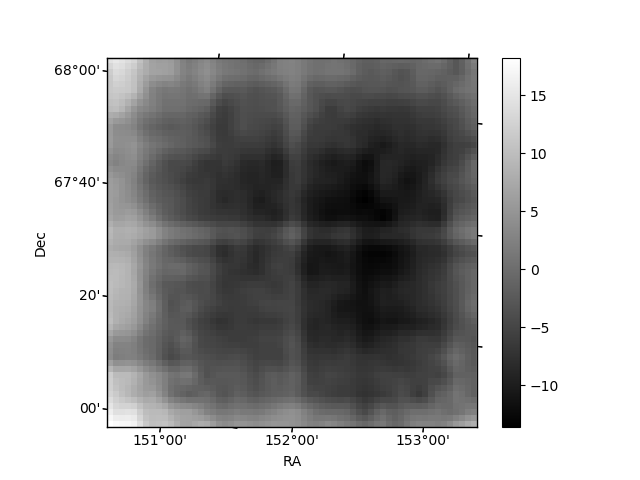
Quadrant B |
|---|---|---|---|
| Quadrant D | 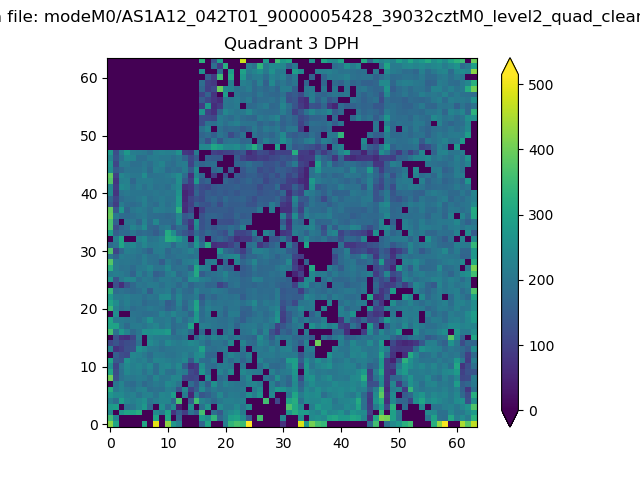 |
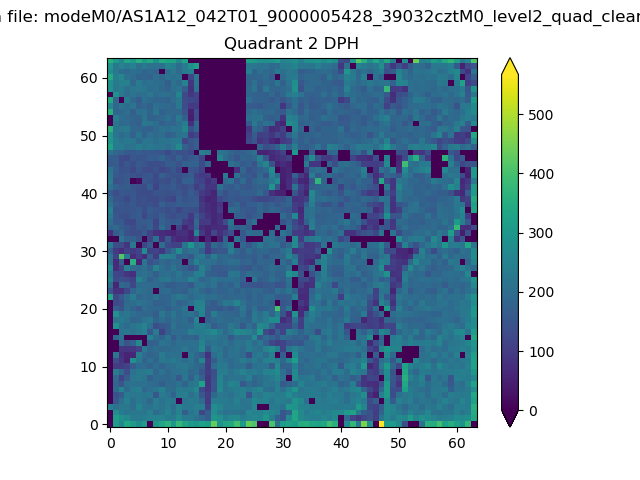 |
Quadrant C |
| Plot type | Count rate plots | Images |
|---|---|---|
| Comparison with Poisson distribution Blue bars denote a histogram of data divided into 1 sec bins. Red curve is a Poisson curve with rate = median count rate of data. |
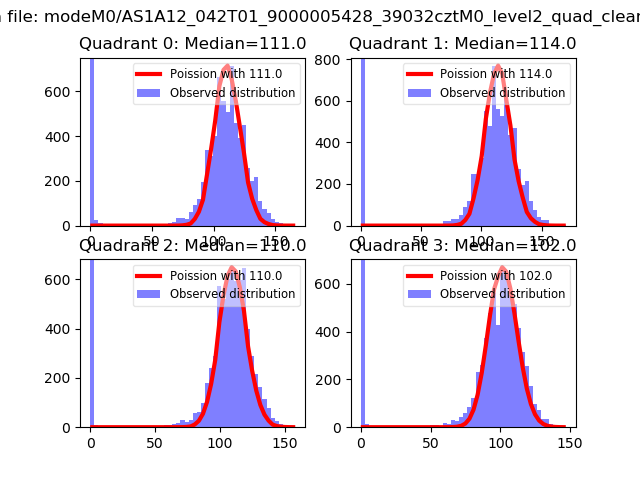 |
 |
| Quadrant-wise count rates Data is divided into 100 sec bins |
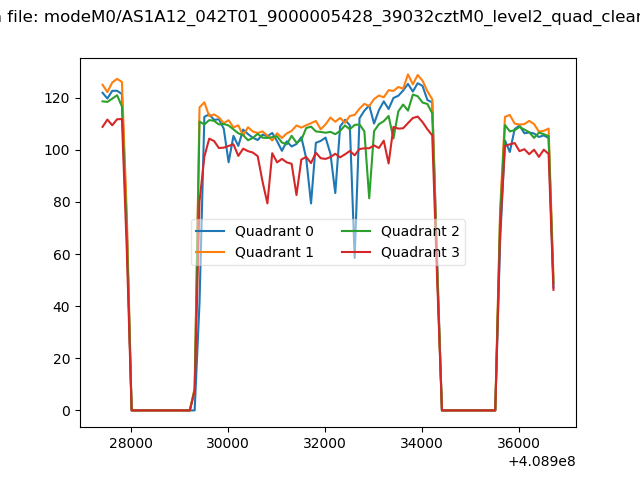 |
|
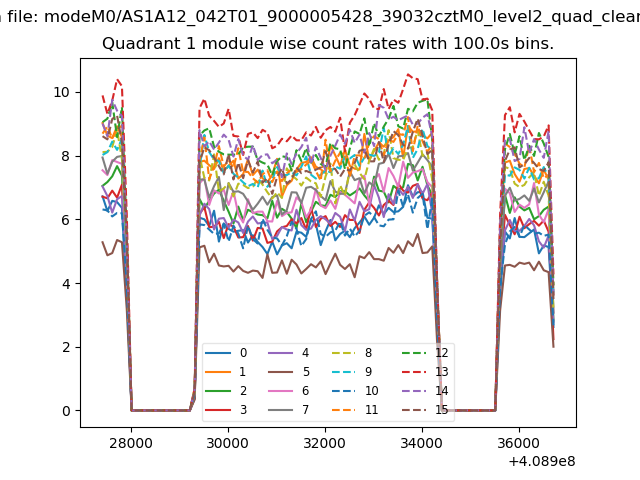
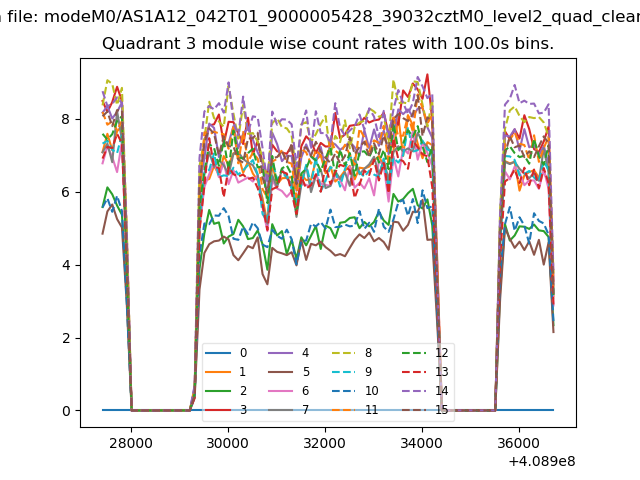
| Module-wise count rates for Quadrant A Data is divided into 100 sec bins |
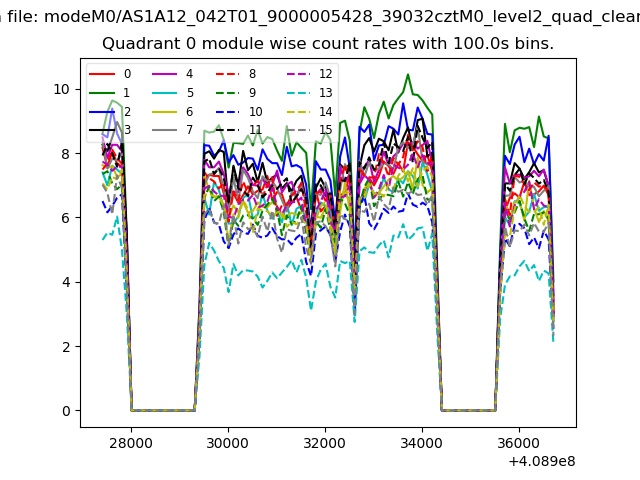 |
 |
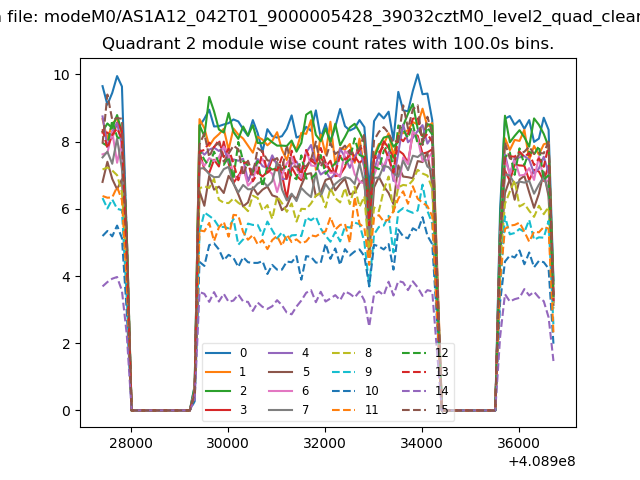
| Module-wise count rates for Quadrant B Data is divided into 100 sec bins |
 |
 |
| Module-wise count rates for Quadrant C Data is divided into 100 sec bins |
 |
 |
| Module-wise count rates for Quadrant D Data is divided into 100 sec bins |
 |
 |
| Parameter | Plot |
|---|---|
| CZT HV Monitor | 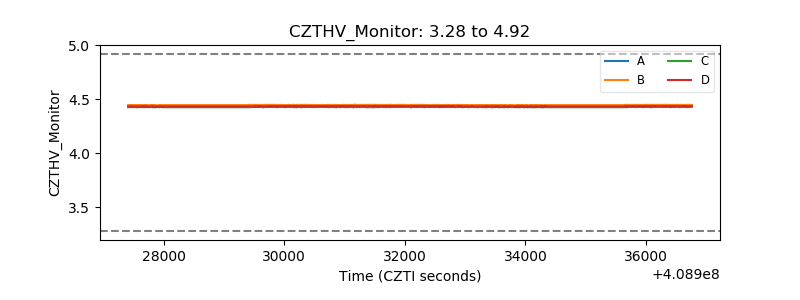 |
| D_VDD | 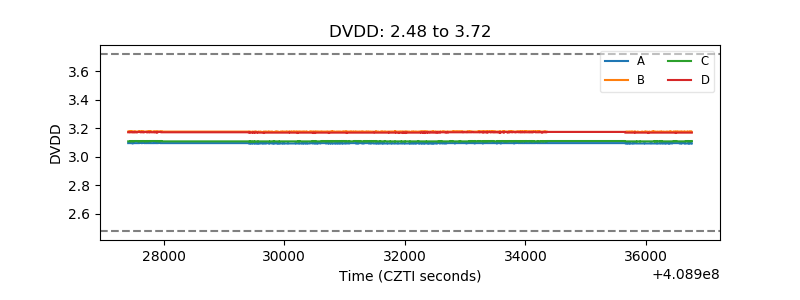 |
| Temperature 1 | 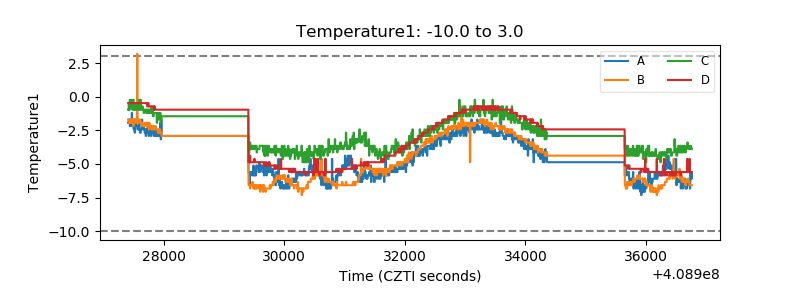 |
| Veto HV Monitor | 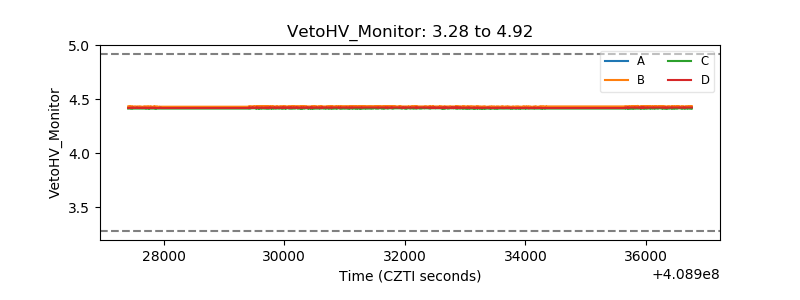 |
| Veto LLD | 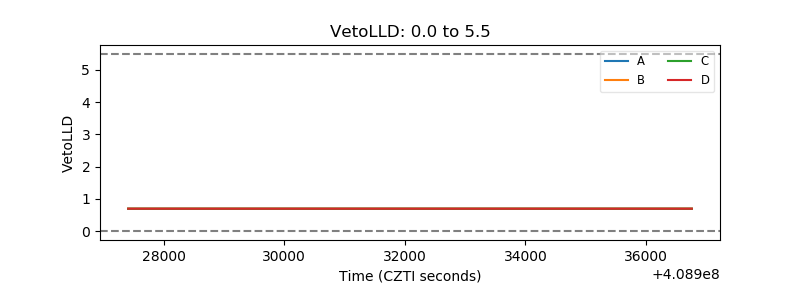 |
| Alpha Counter | 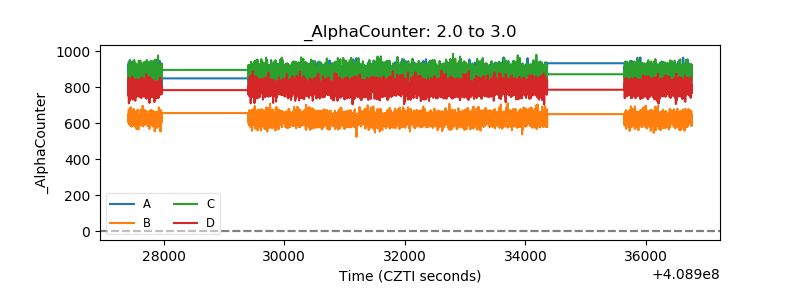 |
| _CPM_Rate | 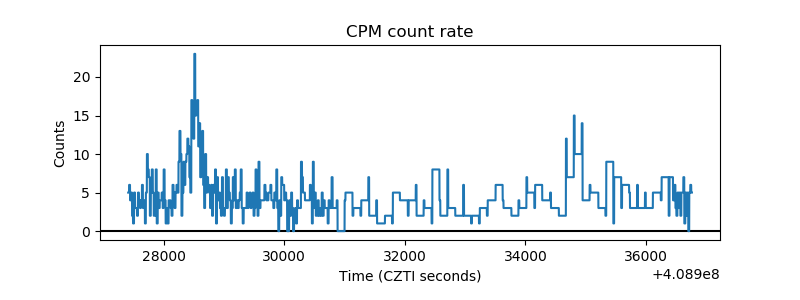 |
| CZT Counter | 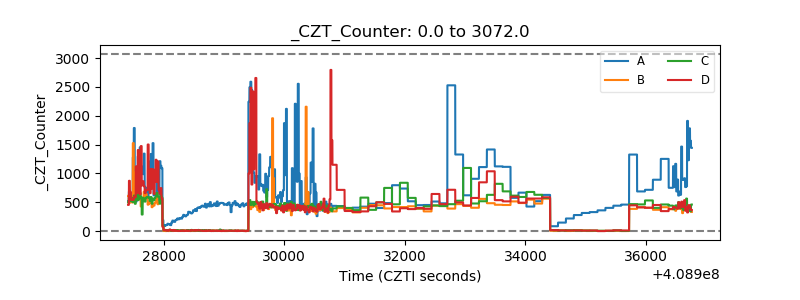 |
| +2.5 Volts monitor | 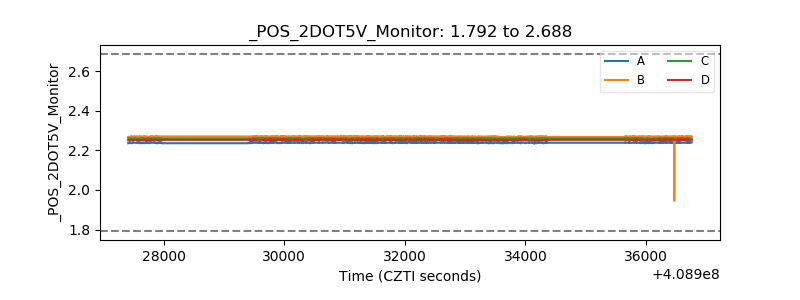 |
| +5 Volts monitor | 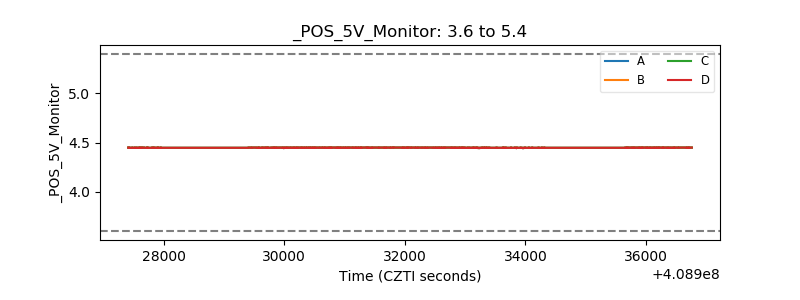 |
| _ROLL_ROT | 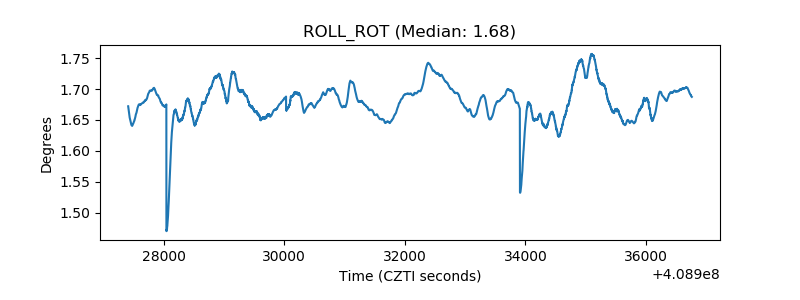 |
| _Roll_DEC | 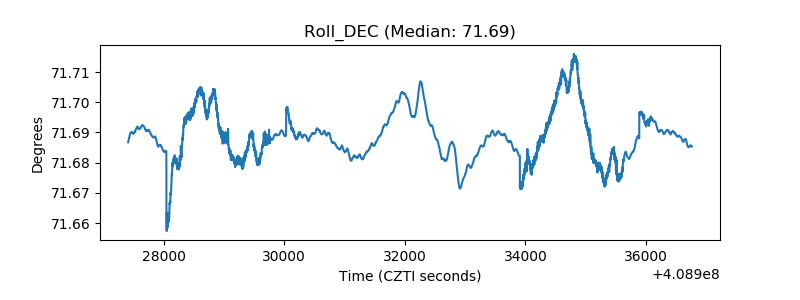 |
| _Roll_RA | 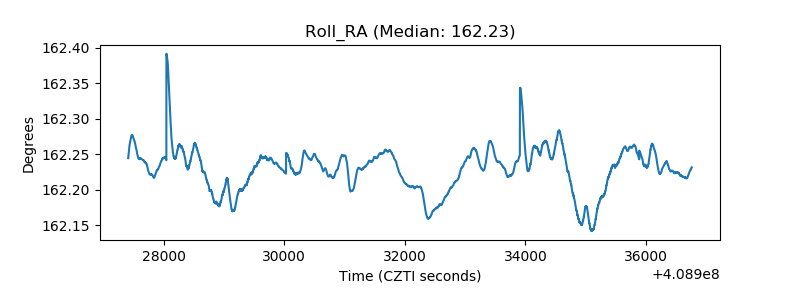 |
| Veto Counter | 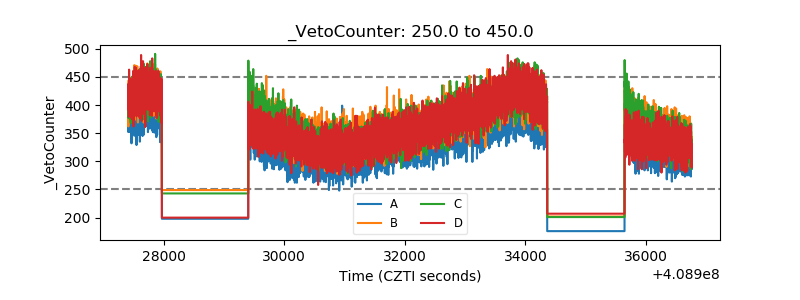 |