| Param | Original file | Final file |
|---|---|---|
| Filename | modeM0/AS1A12_042T01_9000005428_39035cztM0_level2.fits | modeM0/AS1A12_042T01_9000005428_39035cztM0_level2_quad_clean.evt |
| Size (bytes) | 1,000,298,880 | 223,119,360 |
| Size | 954.0 MB | 212.8 MB |
| Events in quadrant A | 15,727,553 | 1,421,514 |
| Events in quadrant B | 6,275,107 | 1,541,235 |
| Events in quadrant C | 6,752,955 | 1,475,194 |
| Events in quadrant D | 7,200,879 | 1,361,167 |
| Mode M0 | |||
|---|---|---|---|
| Quadrant | BADHDUFLAG | Total packets | Discarded packets |
| A | 0 | 56504 | 2 |
| B | 0 | 28487 | 2 |
| C | 0 | 29079 | 2 |
| D | 0 | 31513 | 2 |
| Mode SS | |||
|---|---|---|---|
| Quadrant | BADHDUFLAG | Total packets | Discarded packets |
| A | 0 | 278 | 0 |
| B | 0 | 278 | 0 |
| C | 0 | 278 | 0 |
| D | 0 | 278 | 0 |
| Mode M9 | |||
|---|---|---|---|
| Quadrant | BADHDUFLAG | Total packets | Discarded packets |
| A | 0 | 31 | 0 |
| B | 0 | 31 | 0 |
| C | 0 | 31 | 0 |
| D | 0 | 32 | 0 |
| Quadrant | Total seconds | Saturated seconds | Saturation percentage |
|---|---|---|---|
| A | 13855 | 1295 | 9.346806% |
| B | 13855 | 51 | 0.368098% |
| C | 13855 | 24 | 0.173223% |
| D | 13855 | 150 | 1.082642% |
Noise dominated data is calculated using 1-second bins in cleaned event files. If a bin has >2000 counts, and if more than 50% of those come from <1% of pixels, then it is considered to be noise-dominated and hence unusable.
| Quadrant | # 1 sec bins | Bins with >0 counts | Bins with >2000 counts | High rate bins dominated by noise | Noise dominated (total time) | Noise dominated (detector-on time) | Marked lightcurve |
|---|---|---|---|---|---|---|---|
| A | 16541 | 13857 | 1042 | 1042 | 6.30% | 7.52% | 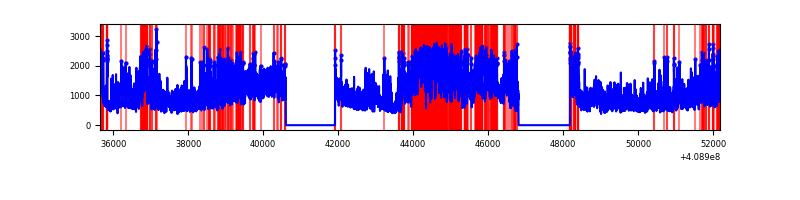 |
| B | 16541 | 13857 | 30 | 30 | 0.18% | 0.22% | 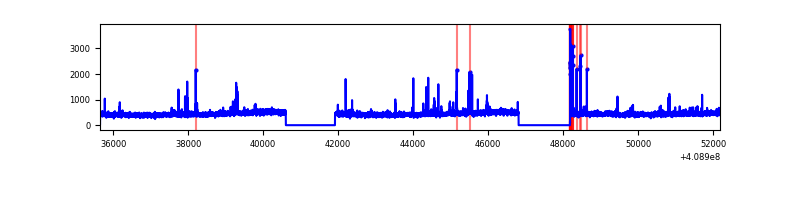 |
| C | 16541 | 13857 | 20 | 20 | 0.12% | 0.14% | 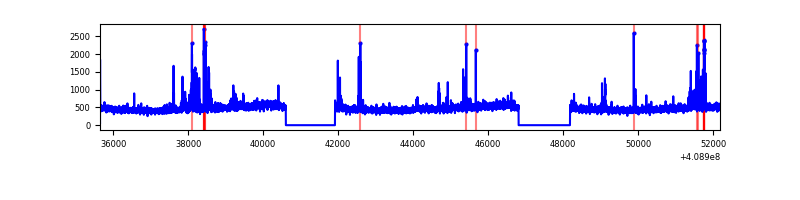 |
| D | 16541 | 13857 | 107 | 107 | 0.65% | 0.77% | 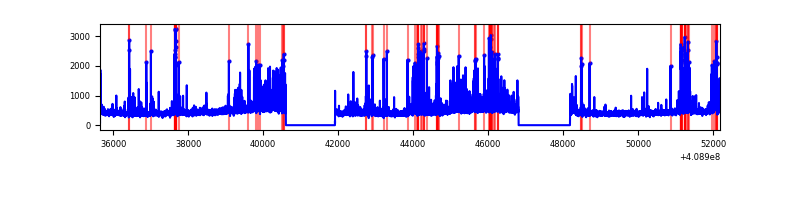 |
Top three noisy pixels from each quadrant. If the there are fewer than three noisy pixels in the level2.evt file, extra rows are filled as -1
| Pixel properties | Quadrant properties | ||||||
|---|---|---|---|---|---|---|---|
| Quadrant | DetID | PixID | Counts | Sigma | Mean | Median | Sigma |
| A | 15 | 222 | 8604849 | 28817.37 | 1487 | 1456 | 298.5 |
| A | 10 | 83 | 889401 | 2974.2 | 1487 | 1456 | 298.5 |
| A | 6 | 10 | 300322 | 1001.06 | 1487 | 1456 | 298.5 |
| B | 5 | 184 | 197203 | 677.92 | 1505 | 1461 | 288.7 |
| B | 0 | 230 | 46010 | 154.29 | 1505 | 1461 | 288.7 |
| B | 5 | 172 | 44013 | 147.37 | 1505 | 1461 | 288.7 |
| C | 15 | 214 | 569024 | 1669.91 | 1478 | 1487 | 339.9 |
| C | 15 | 208 | 363472 | 1065.1 | 1478 | 1487 | 339.9 |
| C | 3 | 233 | 20311 | 55.39 | 1478 | 1487 | 339.9 |
| D | 12 | 227 | 473000 | 1317.08 | 1478 | 1433 | 358.0 |
| D | 2 | 249 | 375646 | 1045.17 | 1478 | 1433 | 358.0 |
| D | 12 | 233 | 233948 | 649.41 | 1478 | 1433 | 358.0 |
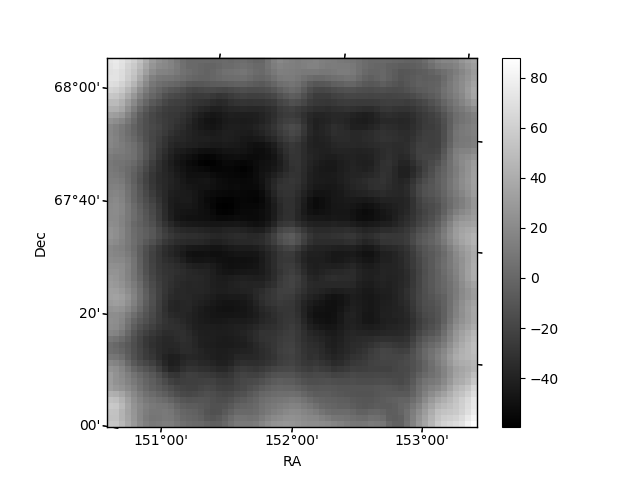
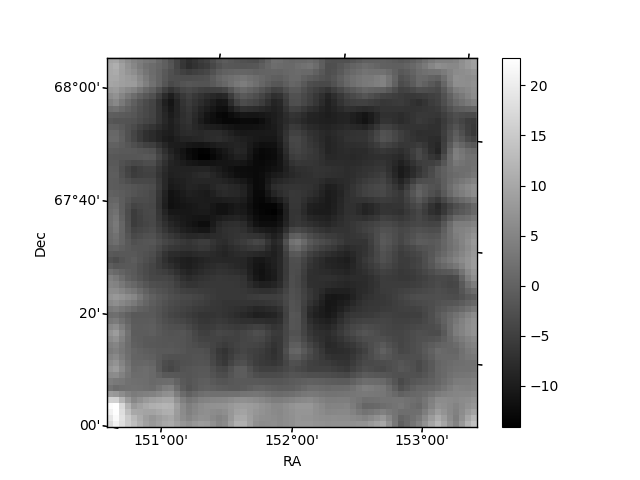
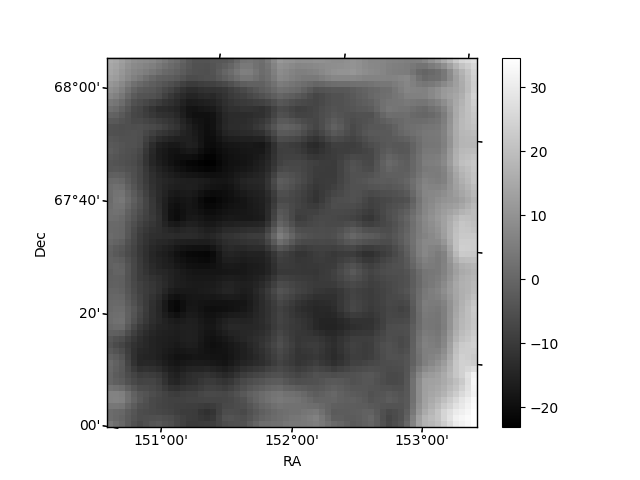
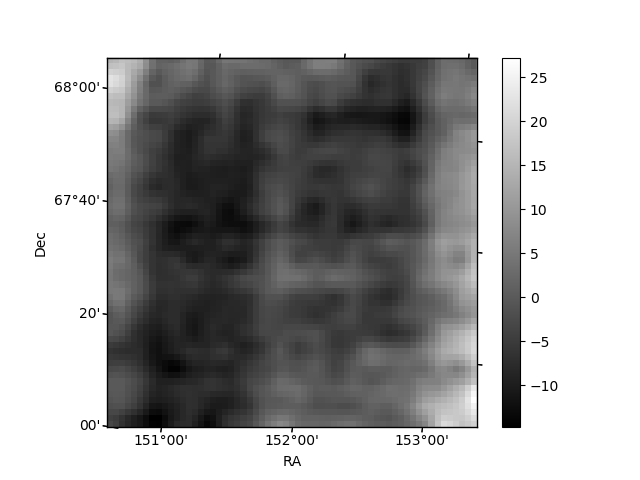
Histogram calculated using DETX and DETY for each event in the final _common_clean file
| Quadrant A | 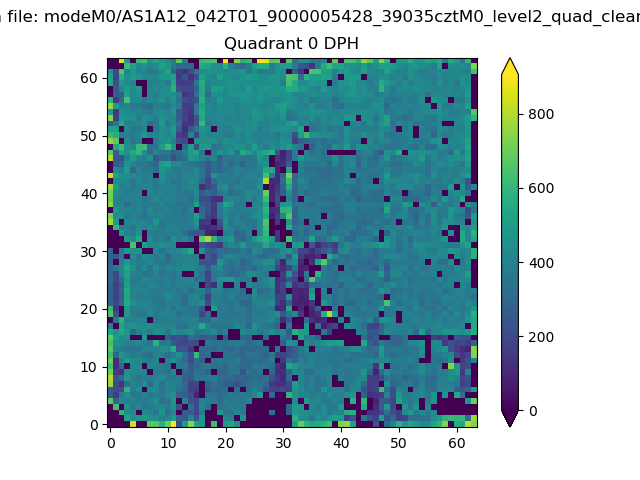 |
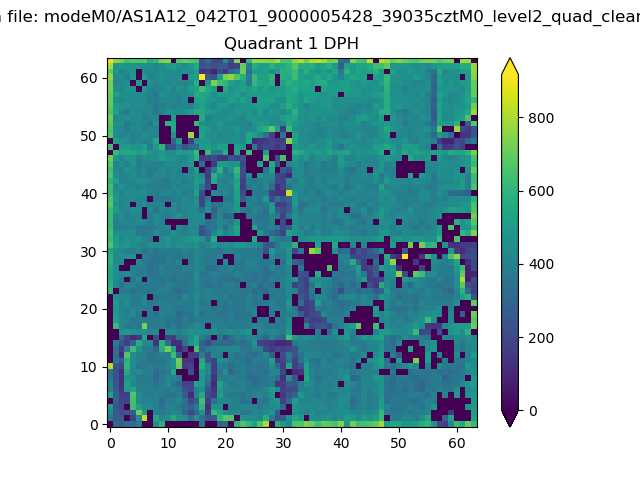 |
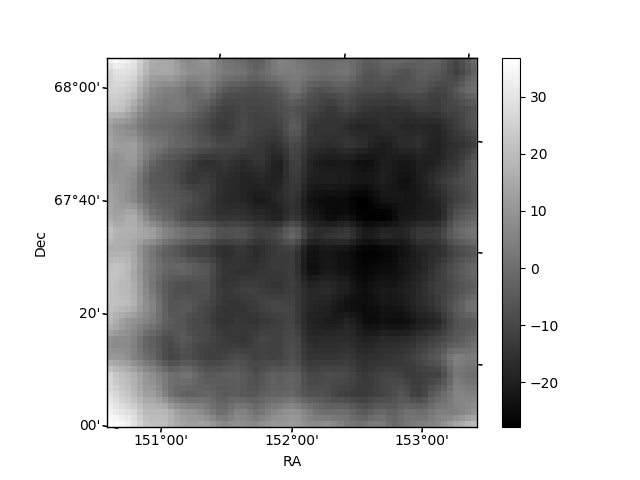
Quadrant B |
|---|---|---|---|
| Quadrant D | 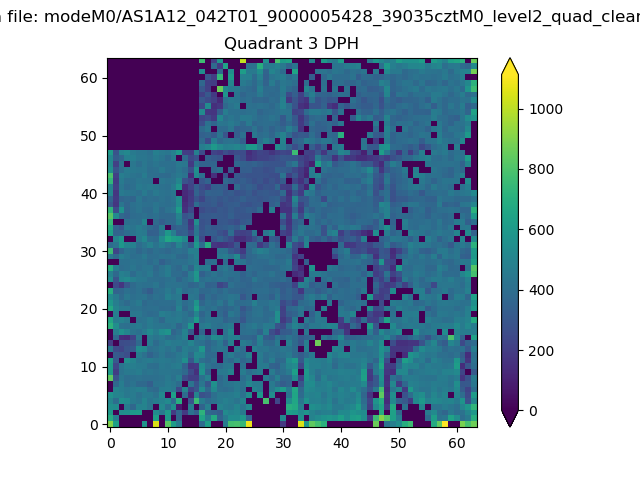 |
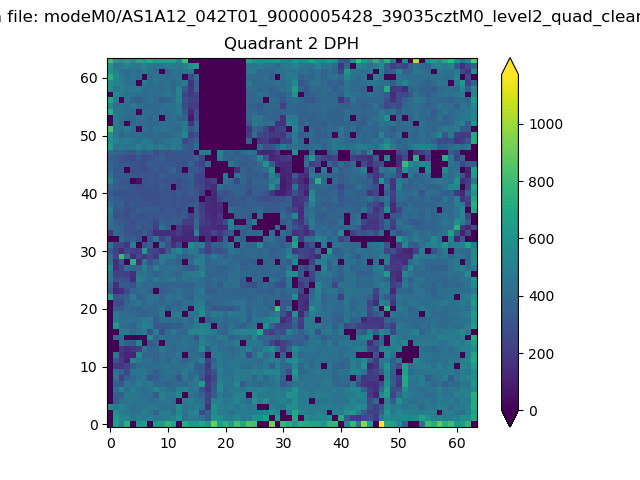 |
Quadrant C |
| Plot type | Count rate plots | Images |
|---|---|---|
| Comparison with Poisson distribution Blue bars denote a histogram of data divided into 1 sec bins. Red curve is a Poisson curve with rate = median count rate of data. |
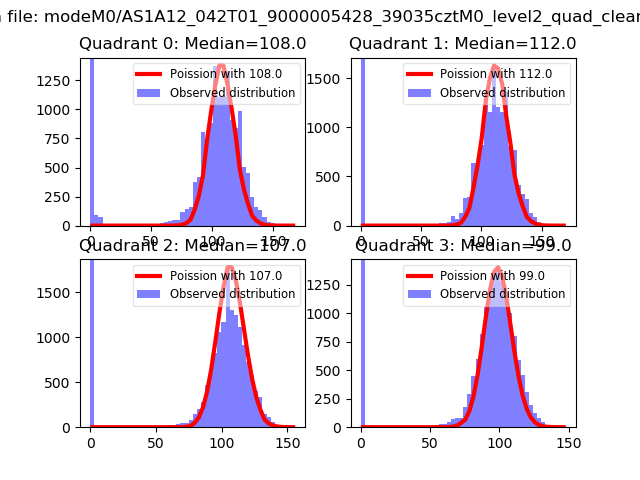 |
 |
| Quadrant-wise count rates Data is divided into 100 sec bins |
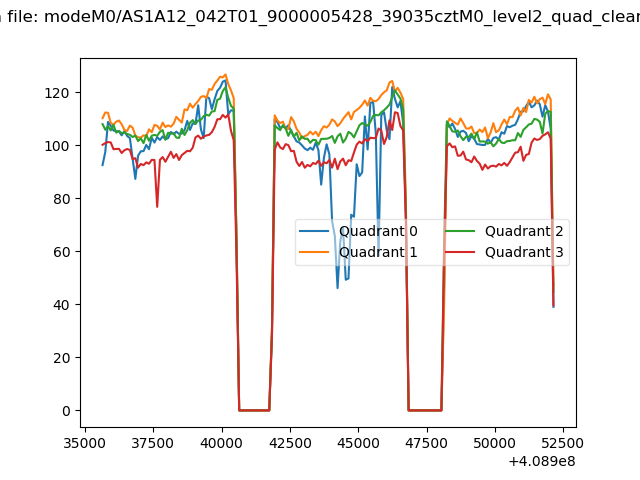 |
|
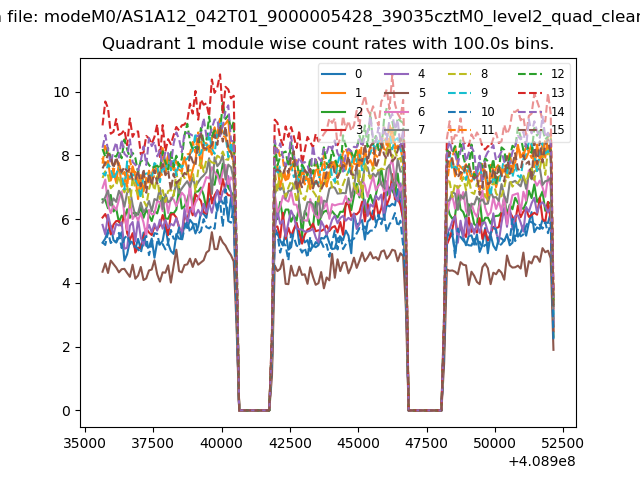
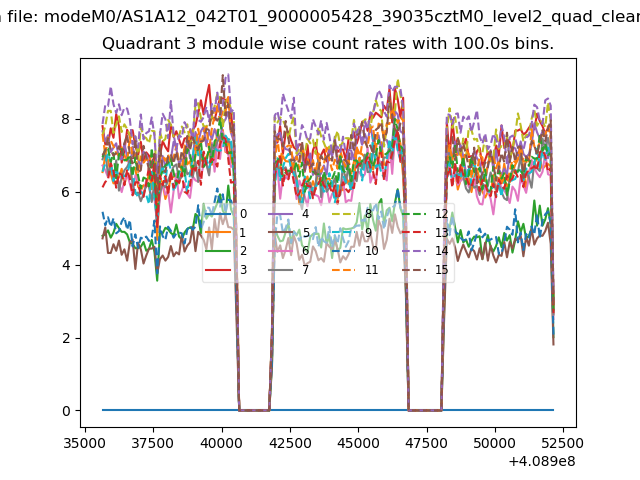
| Module-wise count rates for Quadrant A Data is divided into 100 sec bins |
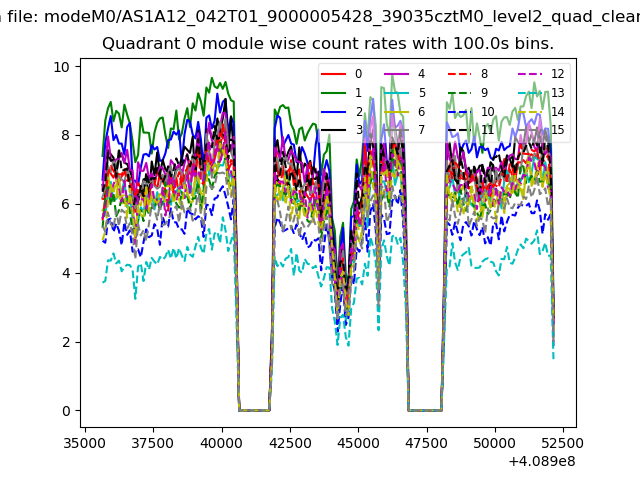 |
 |
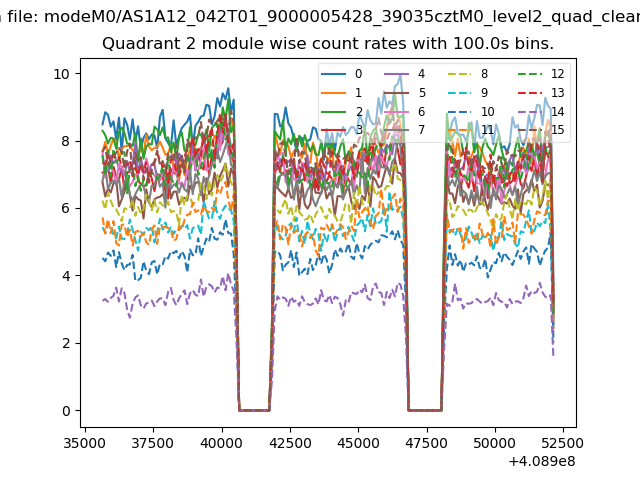
| Module-wise count rates for Quadrant B Data is divided into 100 sec bins |
 |
 |
| Module-wise count rates for Quadrant C Data is divided into 100 sec bins |
 |
 |
| Module-wise count rates for Quadrant D Data is divided into 100 sec bins |
 |
 |
| Parameter | Plot |
|---|---|
| CZT HV Monitor | 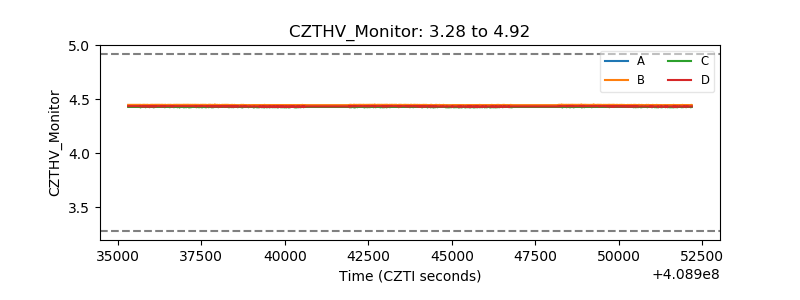 |
| D_VDD | 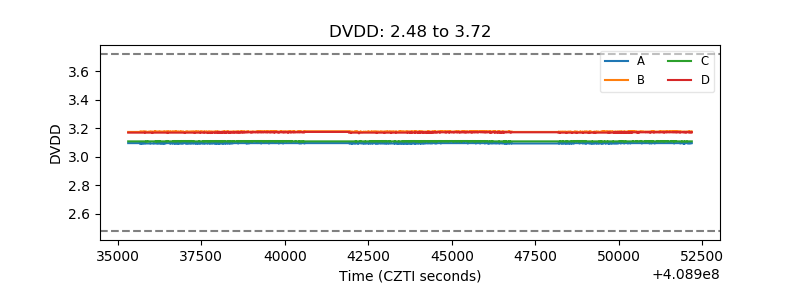 |
| Temperature 1 | 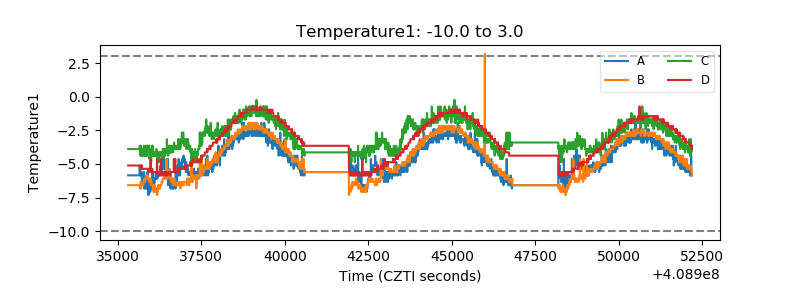 |
| Veto HV Monitor | 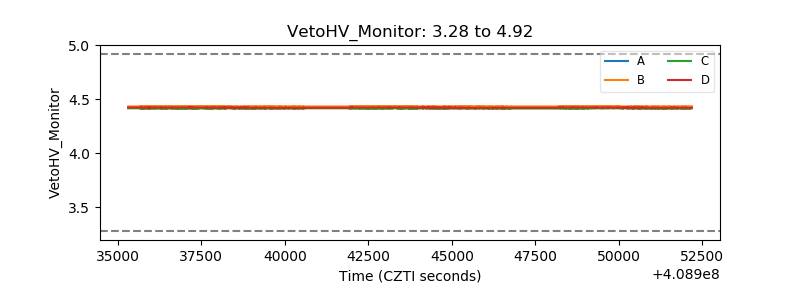 |
| Veto LLD | 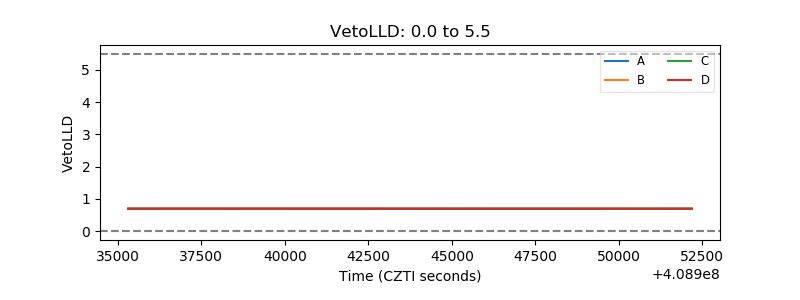 |
| Alpha Counter | 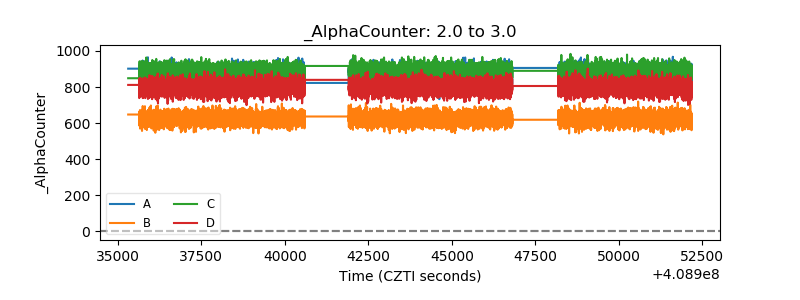 |
| _CPM_Rate | 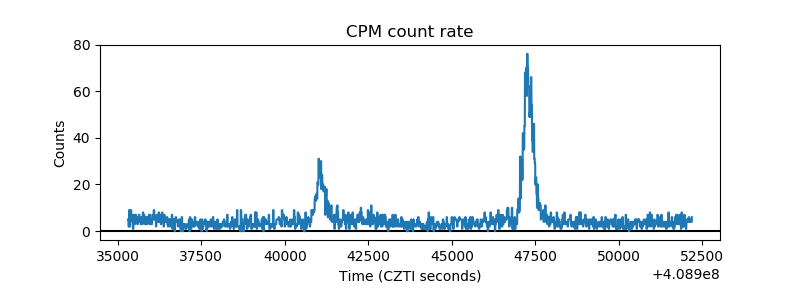 |
| CZT Counter | 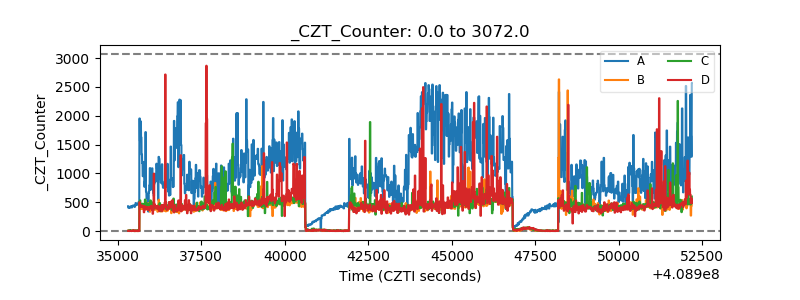 |
| +2.5 Volts monitor | 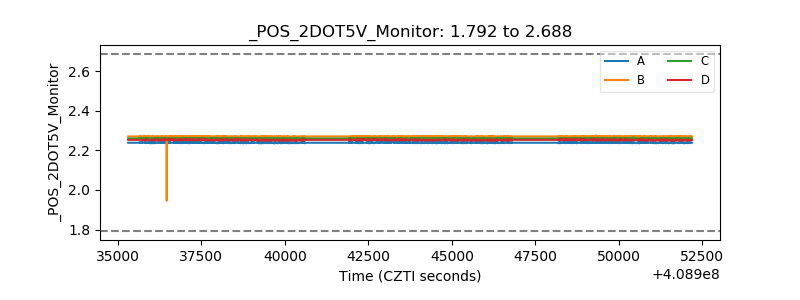 |
| +5 Volts monitor | 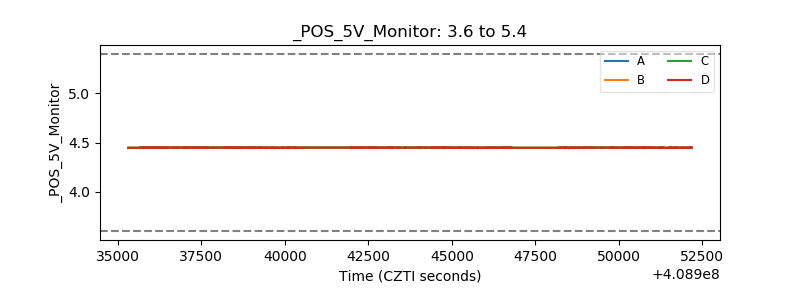 |
| _ROLL_ROT | 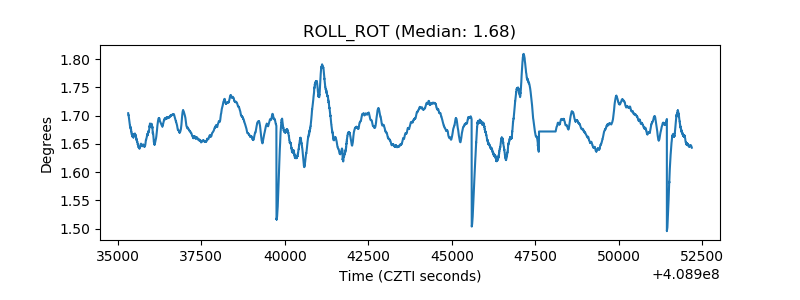 |
| _Roll_DEC | 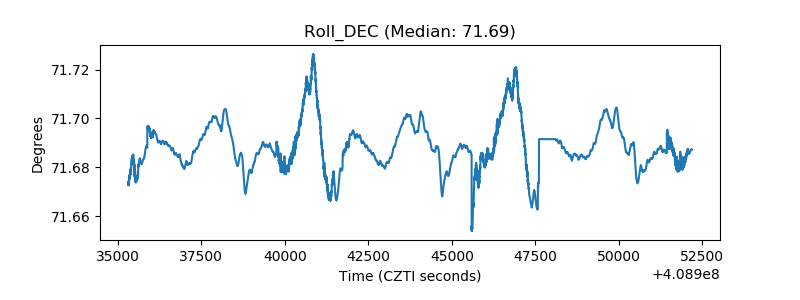 |
| _Roll_RA | 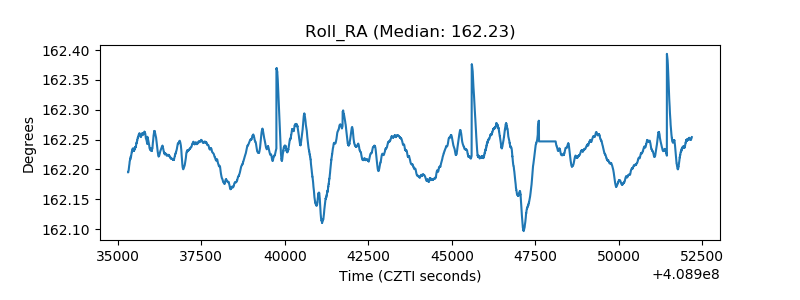 |
| Veto Counter | 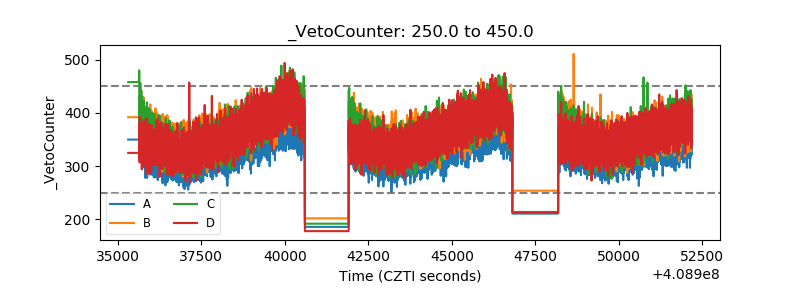 |