| Param | Original file | Final file |
|---|---|---|
| Filename | modeM0/AS1C07_001T02_9000005426_39018cztM0_level2.fits | modeM0/AS1C07_001T02_9000005426_39018cztM0_level2_quad_clean.evt |
| Size (bytes) | 371,407,680 | 105,624,000 |
| Size | 354.2 MB | 100.7 MB |
| Events in quadrant A | 4,098,350 | 699,176 |
| Events in quadrant B | 2,903,080 | 718,968 |
| Events in quadrant C | 3,006,574 | 694,741 |
| Events in quadrant D | 3,242,824 | 639,830 |
| Mode M0 | |||
|---|---|---|---|
| Quadrant | BADHDUFLAG | Total packets | Discarded packets |
| A | 0 | 16363 | 3 |
| B | 0 | 13141 | 2 |
| C | 0 | 13039 | 2 |
| D | 0 | 14472 | 2 |
| Mode M9 | |||
|---|---|---|---|
| Quadrant | BADHDUFLAG | Total packets | Discarded packets |
| A | 0 | 27 | 0 |
| B | 0 | 27 | 0 |
| C | 0 | 27 | 0 |
| D | 0 | 27 | 0 |
| Mode SS | |||
|---|---|---|---|
| Quadrant | BADHDUFLAG | Total packets | Discarded packets |
| A | 0 | 130 | 0 |
| B | 0 | 130 | 0 |
| C | 0 | 130 | 0 |
| D | 0 | 130 | 0 |
| Quadrant | Total seconds | Saturated seconds | Saturation percentage |
|---|---|---|---|
| A | 6390 | 135 | 2.112676% |
| B | 6390 | 20 | 0.312989% |
| C | 6390 | 3 | 0.046948% |
| D | 6390 | 58 | 0.907668% |
Noise dominated data is calculated using 1-second bins in cleaned event files. If a bin has >2000 counts, and if more than 50% of those come from <1% of pixels, then it is considered to be noise-dominated and hence unusable.
| Quadrant | # 1 sec bins | Bins with >0 counts | Bins with >2000 counts | High rate bins dominated by noise | Noise dominated (total time) | Noise dominated (detector-on time) | Marked lightcurve |
|---|---|---|---|---|---|---|---|
| A | 9046 | 6392 | 95 | 95 | 1.05% | 1.49% | 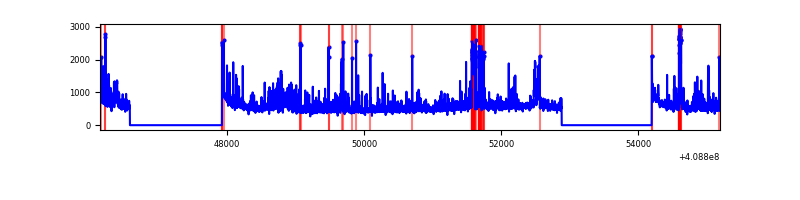 |
| B | 9046 | 6391 | 6 | 6 | 0.07% | 0.09% | 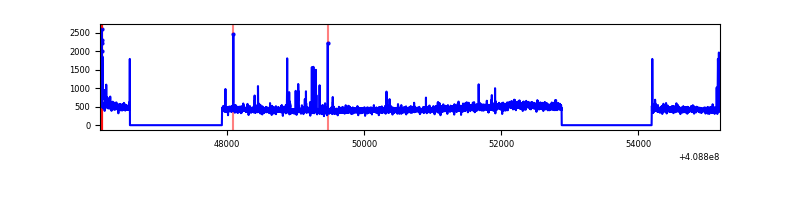 |
| C | 9046 | 6392 | 0 | 0 | 0.00% | 0.00% | 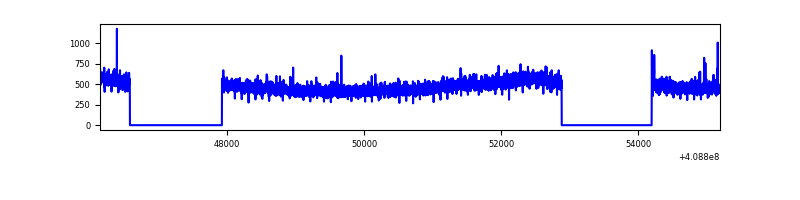 |
| D | 9045 | 6391 | 42 | 42 | 0.46% | 0.66% | 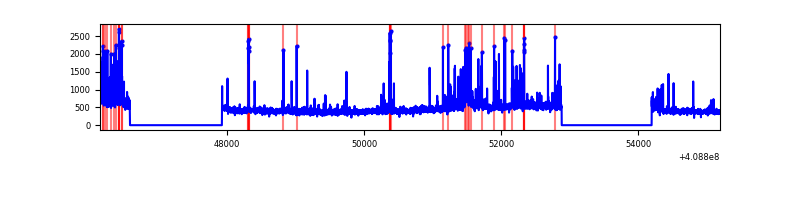 |
Top three noisy pixels from each quadrant. If the there are fewer than three noisy pixels in the level2.evt file, extra rows are filled as -1
| Pixel properties | Quadrant properties | ||||||
|---|---|---|---|---|---|---|---|
| Quadrant | DetID | PixID | Counts | Sigma | Mean | Median | Sigma |
| A | 6 | 10 | 575324 | 4005.7 | 701 | 684 | 143.5 |
| A | 10 | 83 | 467245 | 3252.3 | 701 | 684 | 143.5 |
| A | 12 | 16 | 196015 | 1361.61 | 701 | 684 | 143.5 |
| B | 5 | 172 | 71773 | 524.65 | 701 | 680 | 135.5 |
| B | 0 | 230 | 36162 | 261.85 | 701 | 680 | 135.5 |
| B | 15 | 85 | 33888 | 245.07 | 701 | 680 | 135.5 |
| C | 15 | 214 | 269316 | 1655.14 | 691 | 692 | 162.3 |
| C | 0 | 239 | 19477 | 115.74 | 691 | 692 | 162.3 |
| C | 1 | 128 | 9464 | 54.05 | 691 | 692 | 162.3 |
| D | 13 | 171 | 151048 | 891.39 | 689 | 669 | 168.7 |
| D | 2 | 249 | 144434 | 852.18 | 689 | 669 | 168.7 |
| D | 12 | 233 | 119530 | 704.56 | 689 | 669 | 168.7 |
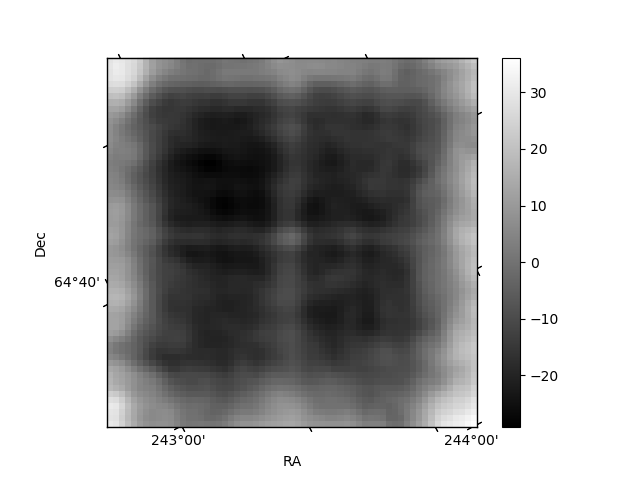
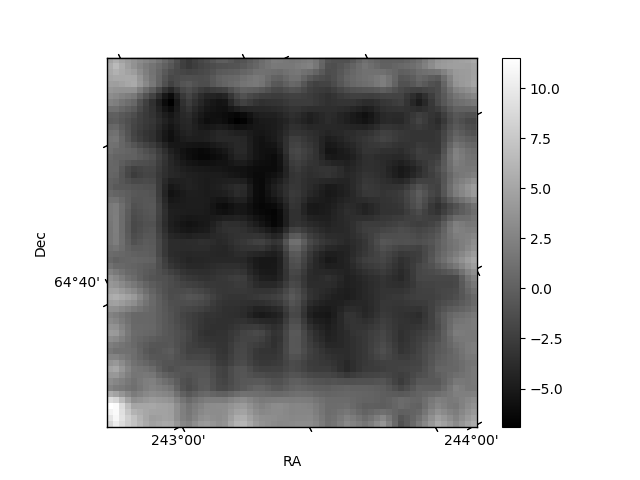
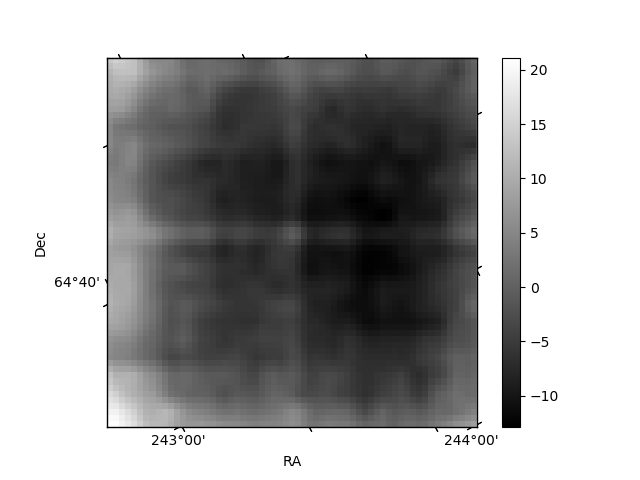
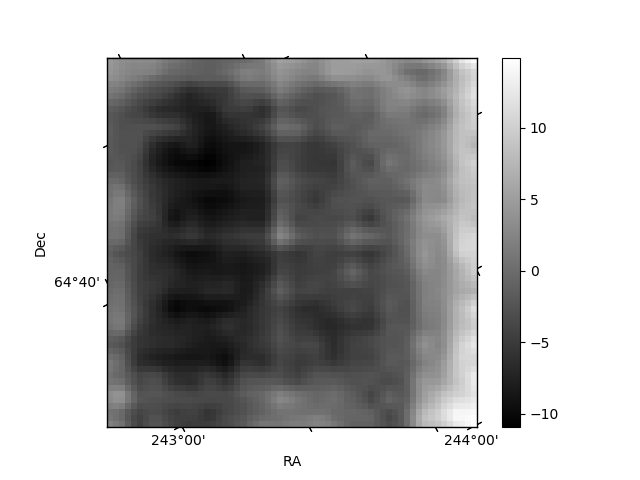
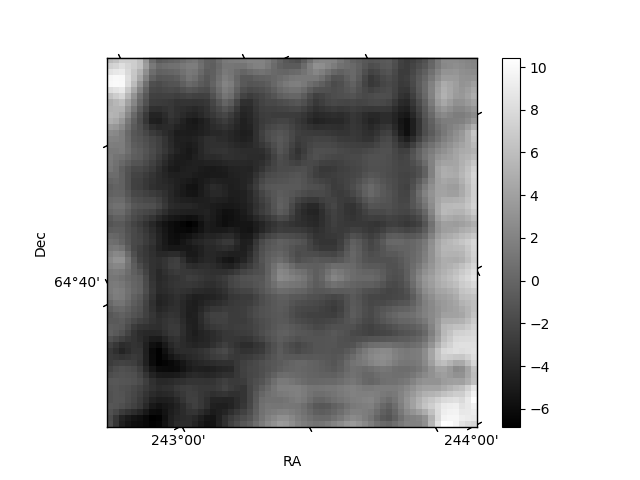
Histogram calculated using DETX and DETY for each event in the final _common_clean file
| Quadrant A | 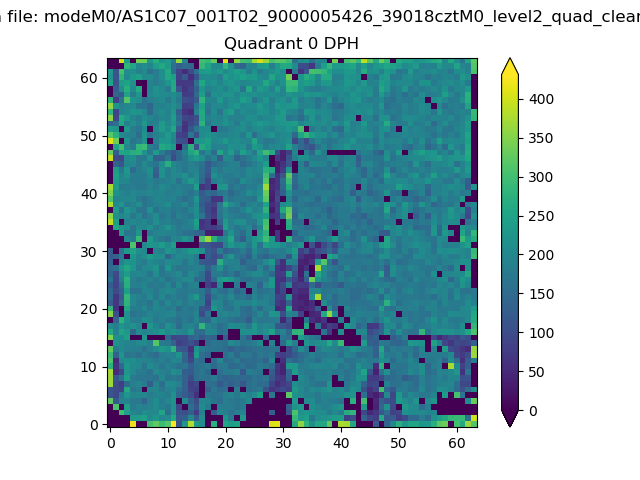 |
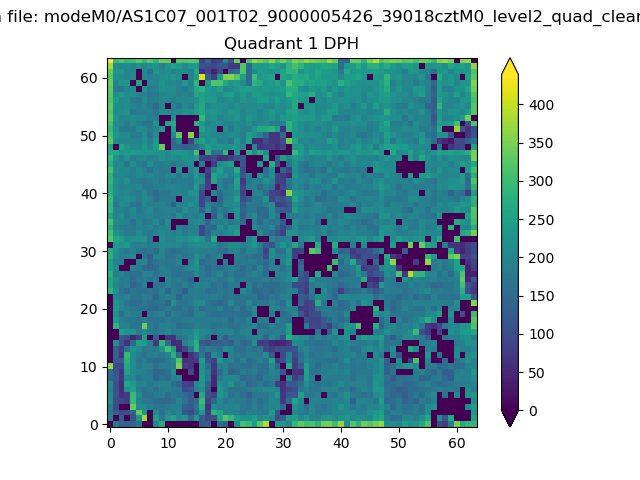 |
Quadrant B |
|---|---|---|---|
| Quadrant D | 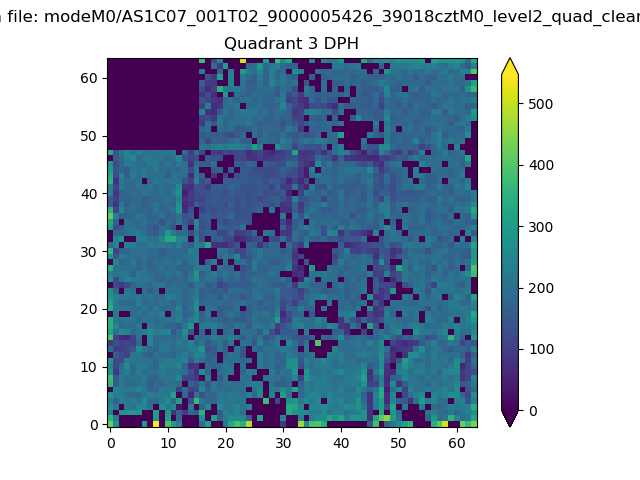 |
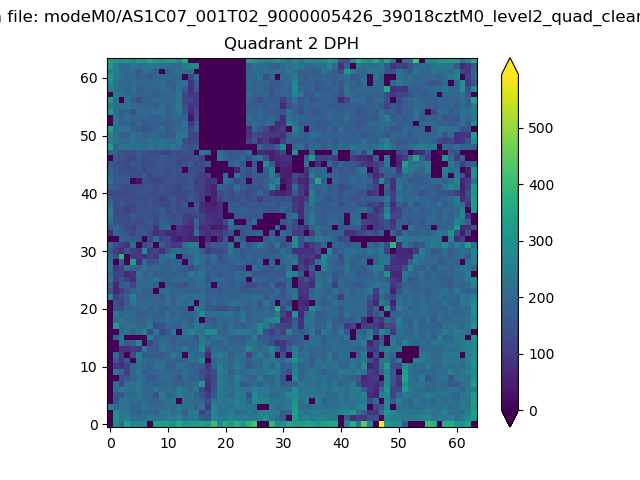 |
Quadrant C |
| Plot type | Count rate plots | Images |
|---|---|---|
| Comparison with Poisson distribution Blue bars denote a histogram of data divided into 1 sec bins. Red curve is a Poisson curve with rate = median count rate of data. |
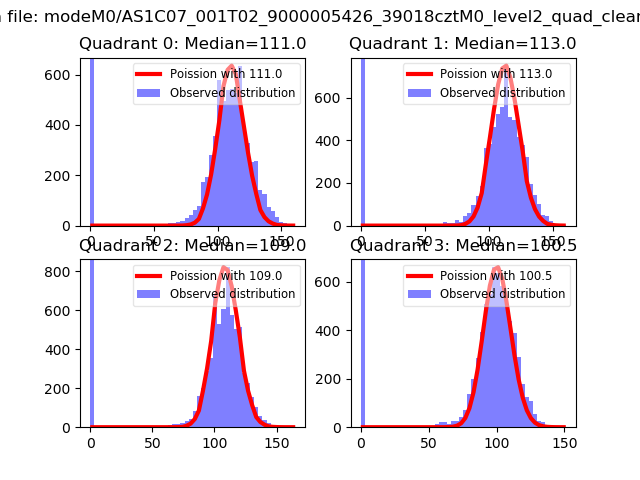 |
 |
| Quadrant-wise count rates Data is divided into 100 sec bins |
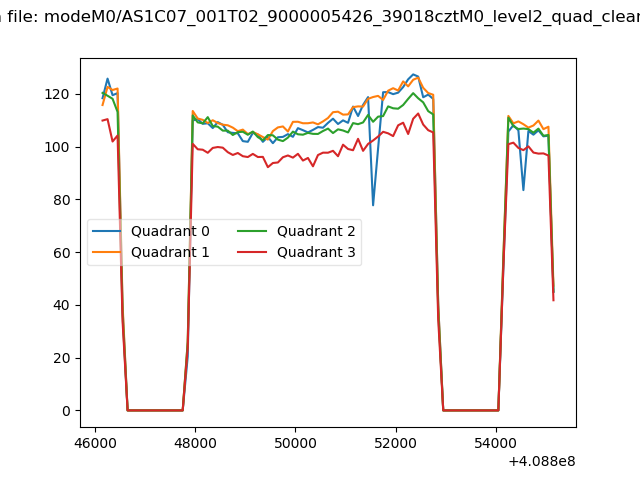 |
|
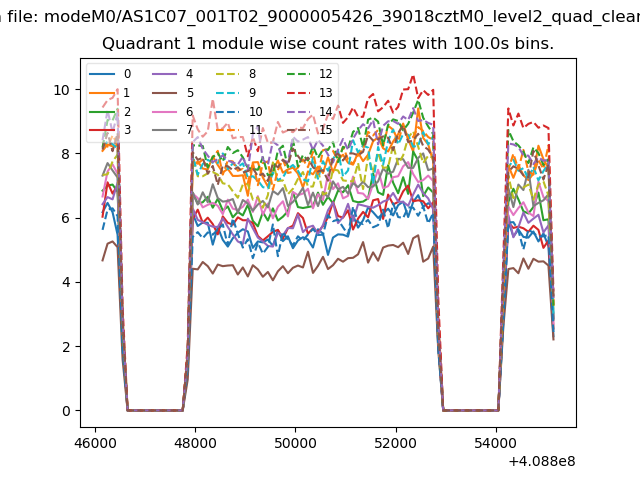
| Module-wise count rates for Quadrant A Data is divided into 100 sec bins |
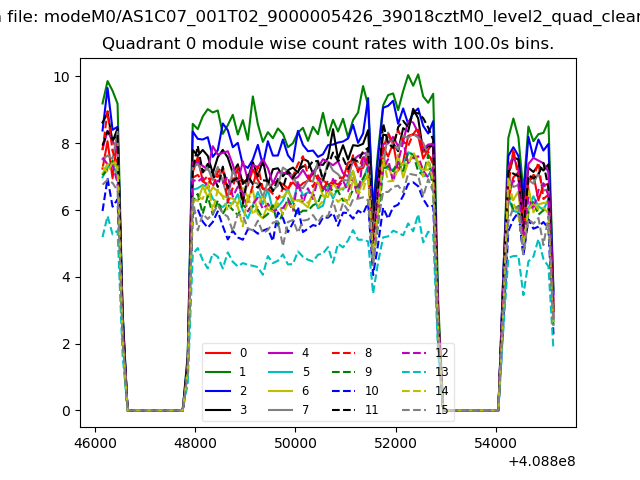 |
 |
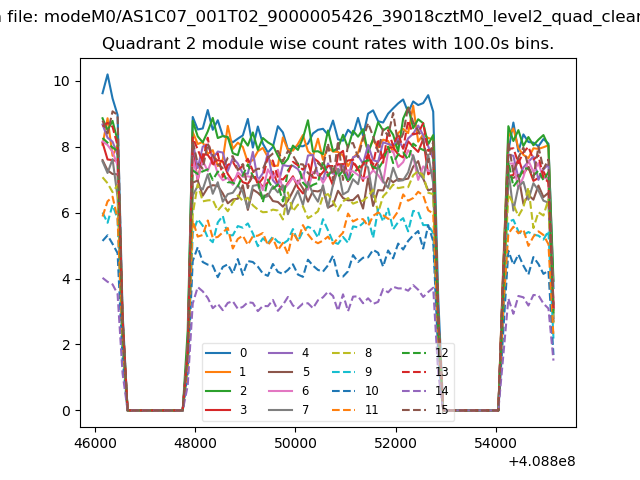
| Module-wise count rates for Quadrant B Data is divided into 100 sec bins |
 |
 |
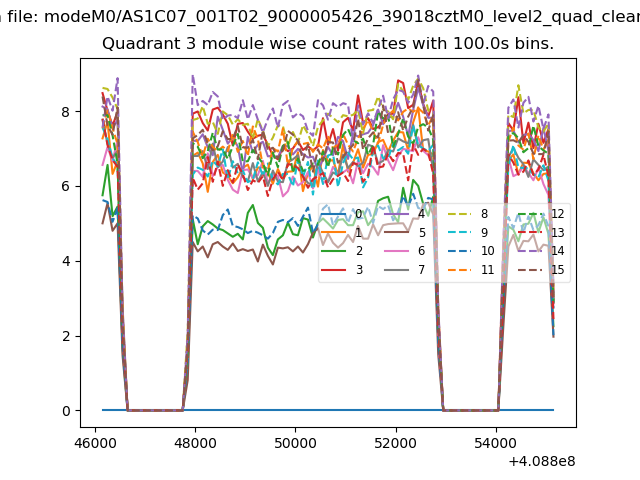
| Module-wise count rates for Quadrant C Data is divided into 100 sec bins |
 |
 |
| Module-wise count rates for Quadrant D Data is divided into 100 sec bins |
 |
 |
| Parameter | Plot |
|---|---|
| CZT HV Monitor | 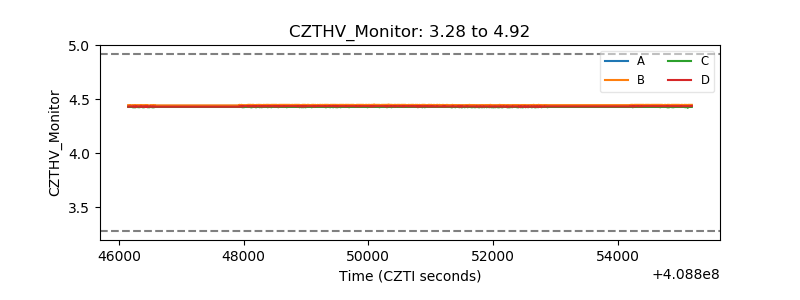 |
| D_VDD | 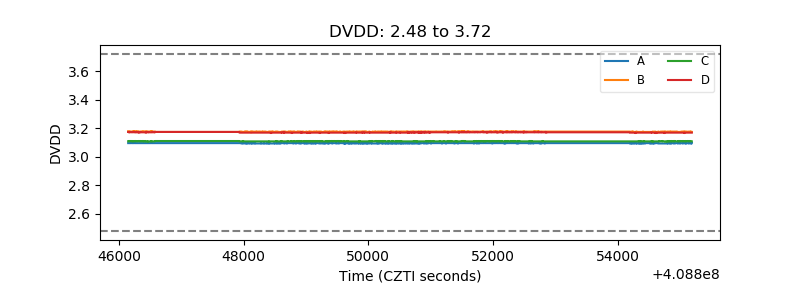 |
| Temperature 1 | 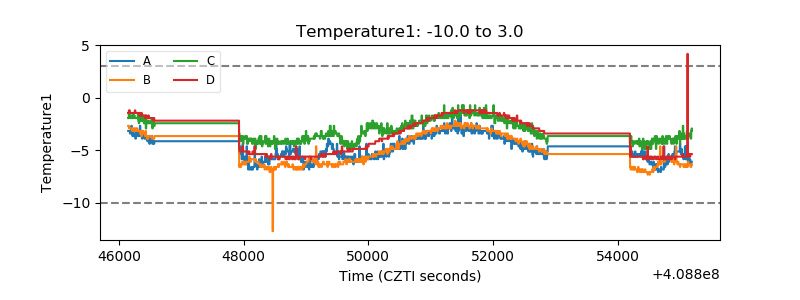 |
| Veto HV Monitor | 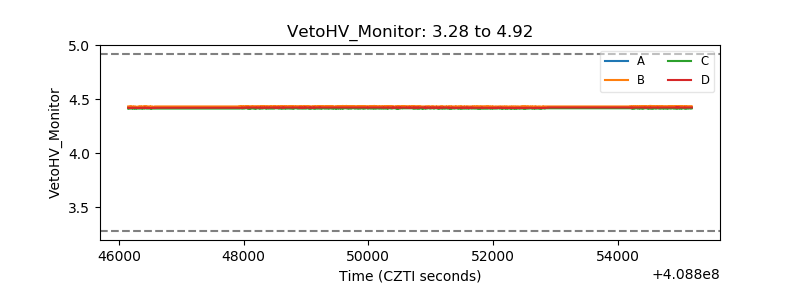 |
| Veto LLD | 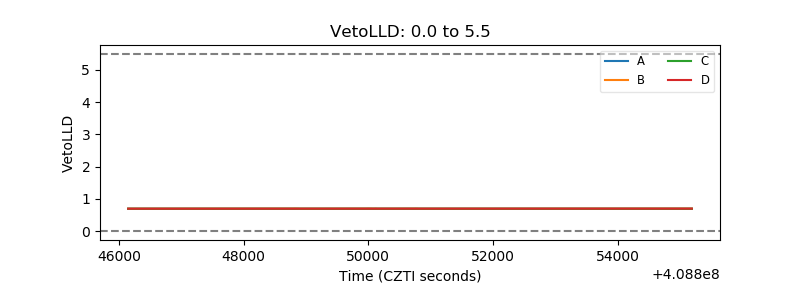 |
| Alpha Counter | 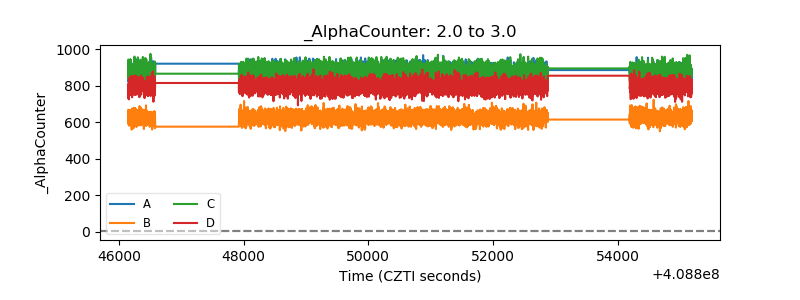 |
| _CPM_Rate | 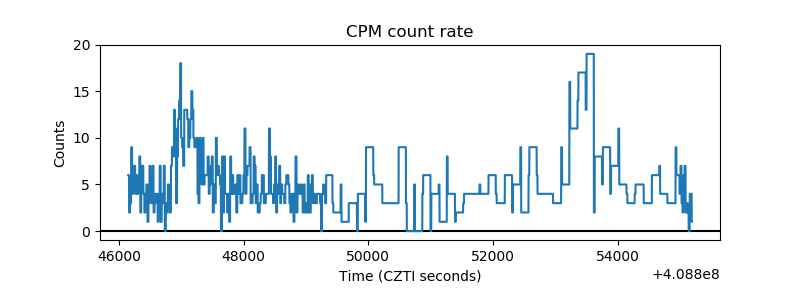 |
| CZT Counter | 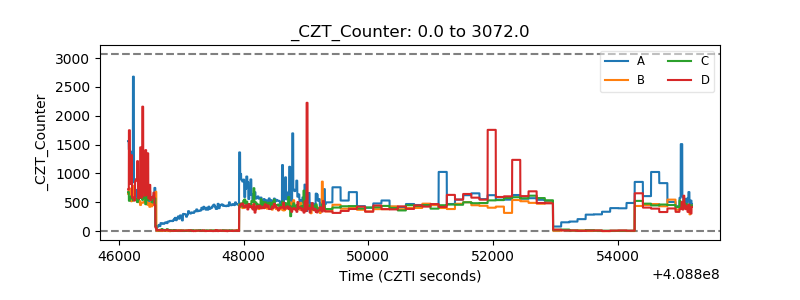 |
| +2.5 Volts monitor |  |
| +5 Volts monitor | 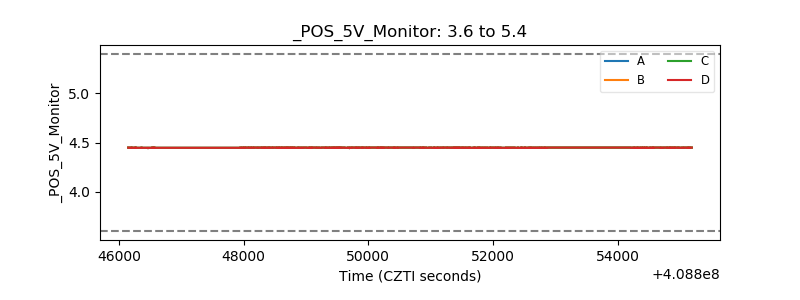 |
| _ROLL_ROT | 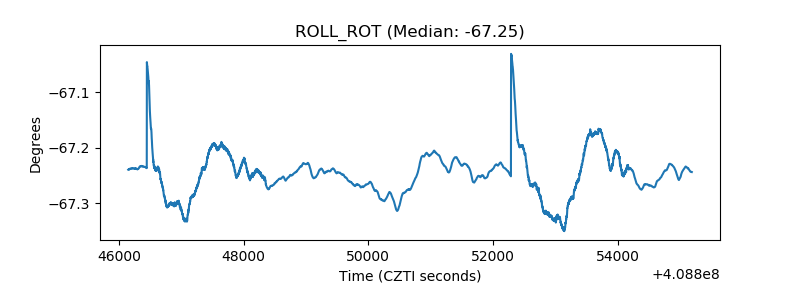 |
| _Roll_DEC | 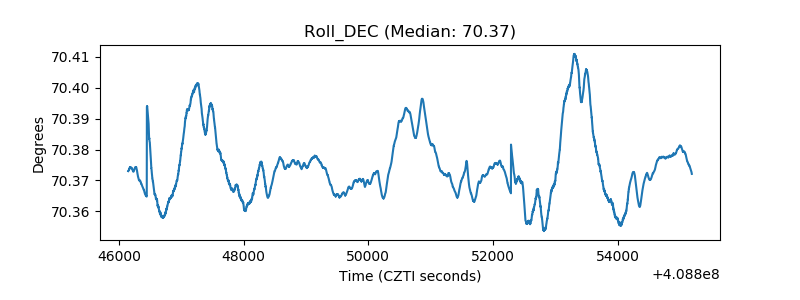 |
| _Roll_RA | 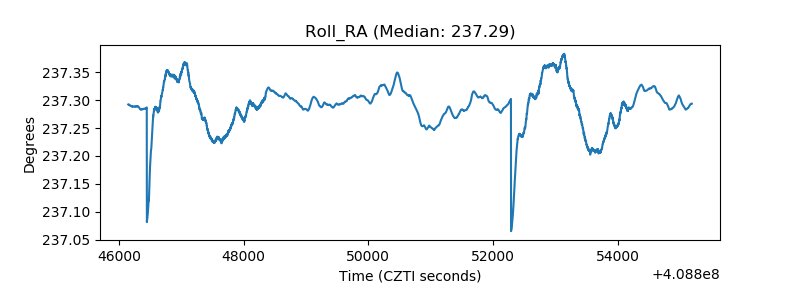 |
| Veto Counter | 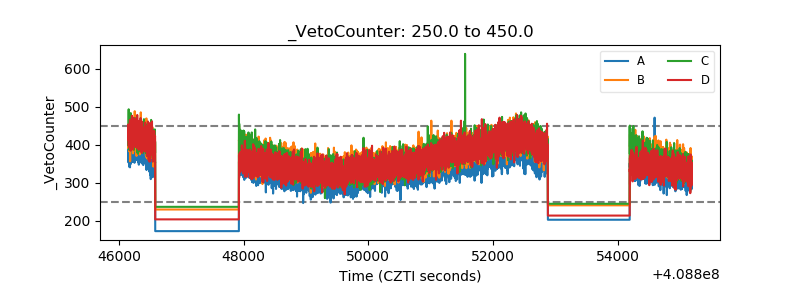 |