| Param | Original file | Final file |
|---|---|---|
| Filename | modeM0/AS1C07_001T02_9000005426_39020cztM0_level2.fits | modeM0/AS1C07_001T02_9000005426_39020cztM0_level2_quad_clean.evt |
| Size (bytes) | 692,735,040 | 183,695,040 |
| Size | 660.6 MB | 175.2 MB |
| Events in quadrant A | 7,062,959 | 1,233,395 |
| Events in quadrant B | 5,283,926 | 1,266,589 |
| Events in quadrant C | 5,279,285 | 1,212,935 |
| Events in quadrant D | 7,144,662 | 1,070,792 |
| Mode M0 | |||
|---|---|---|---|
| Quadrant | BADHDUFLAG | Total packets | Discarded packets |
| A | 0 | 28279 | 4 |
| B | 0 | 23640 | 3 |
| C | 0 | 22835 | 3 |
| D | 0 | 29353 | 3 |
| Mode M9 | |||
|---|---|---|---|
| Quadrant | BADHDUFLAG | Total packets | Discarded packets |
| A | 0 | 41 | 0 |
| B | 0 | 41 | 0 |
| C | 0 | 41 | 0 |
| D | 0 | 41 | 0 |
| Mode SS | |||
|---|---|---|---|
| Quadrant | BADHDUFLAG | Total packets | Discarded packets |
| A | 0 | 232 | 0 |
| B | 0 | 232 | 0 |
| C | 0 | 232 | 0 |
| D | 0 | 232 | 0 |
| Quadrant | Total seconds | Saturated seconds | Saturation percentage |
|---|---|---|---|
| A | 11240 | 159 | 1.414591% |
| B | 11240 | 81 | 0.720641% |
| C | 11240 | 9 | 0.080071% |
| D | 11240 | 590 | 5.249110% |
Noise dominated data is calculated using 1-second bins in cleaned event files. If a bin has >2000 counts, and if more than 50% of those come from <1% of pixels, then it is considered to be noise-dominated and hence unusable.
| Quadrant | # 1 sec bins | Bins with >0 counts | Bins with >2000 counts | High rate bins dominated by noise | Noise dominated (total time) | Noise dominated (detector-on time) | Marked lightcurve |
|---|---|---|---|---|---|---|---|
| A | 15358 | 11243 | 112 | 112 | 0.73% | 1.00% | 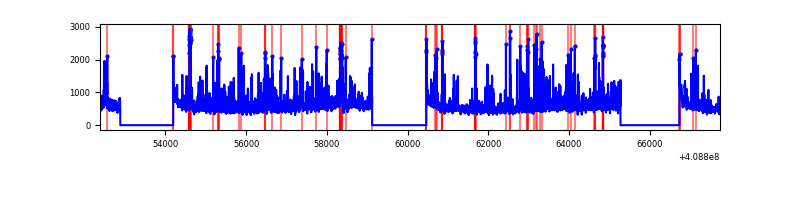 |
| B | 15358 | 11243 | 51 | 51 | 0.33% | 0.45% | 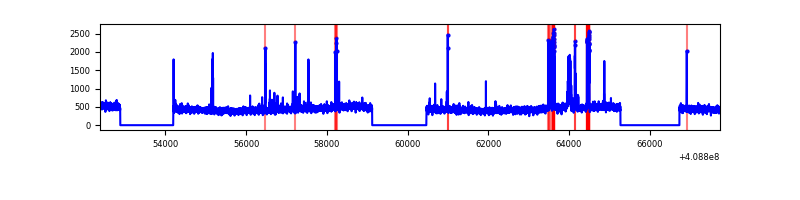 |
| C | 15358 | 11242 | 1 | 1 | 0.01% | 0.01% | 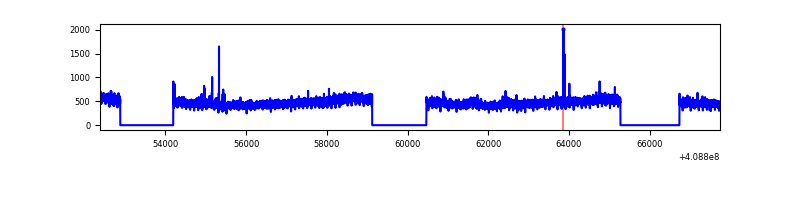 |
| D | 15358 | 11243 | 580 | 580 | 3.78% | 5.16% | 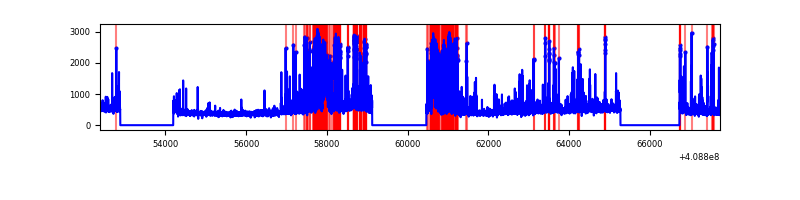 |
Top three noisy pixels from each quadrant. If the there are fewer than three noisy pixels in the level2.evt file, extra rows are filled as -1
| Pixel properties | Quadrant properties | ||||||
|---|---|---|---|---|---|---|---|
| Quadrant | DetID | PixID | Counts | Sigma | Mean | Median | Sigma |
| A | 6 | 10 | 873668 | 3480.76 | 1238 | 1211 | 250.7 |
| A | 10 | 83 | 770529 | 3069.27 | 1238 | 1211 | 250.7 |
| A | 9 | 143 | 222719 | 883.73 | 1238 | 1211 | 250.7 |
| B | 5 | 172 | 388128 | 1630.25 | 1233 | 1195 | 237.3 |
| B | 0 | 230 | 40208 | 164.37 | 1233 | 1195 | 237.3 |
| B | 12 | 111 | 30830 | 124.86 | 1233 | 1195 | 237.3 |
| C | 15 | 214 | 470270 | 1677.01 | 1211 | 1219 | 279.7 |
| C | 9 | 54 | 34535 | 119.12 | 1211 | 1219 | 279.7 |
| C | 1 | 128 | 20361 | 68.44 | 1211 | 1219 | 279.7 |
| D | 12 | 227 | 1653502 | 5720.31 | 1186 | 1152 | 288.9 |
| D | 2 | 249 | 498153 | 1720.58 | 1186 | 1152 | 288.9 |
| D | 12 | 235 | 118203 | 405.22 | 1186 | 1152 | 288.9 |
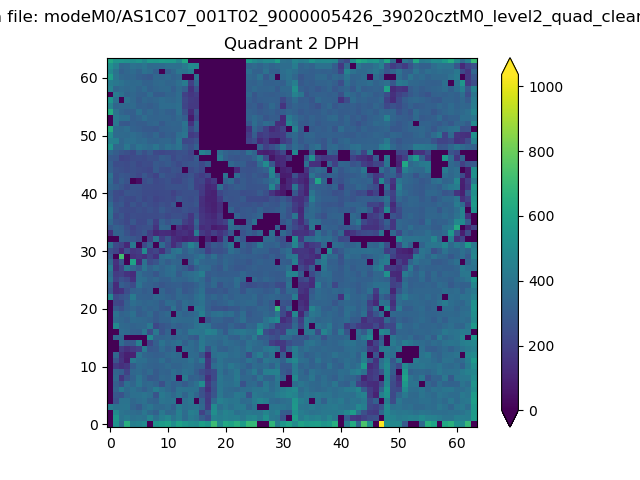
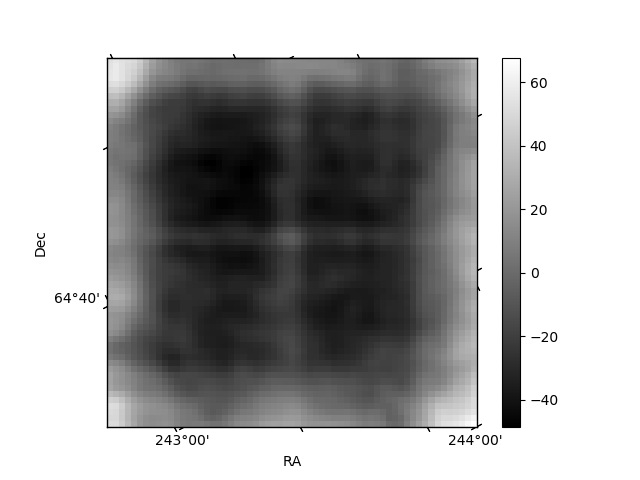
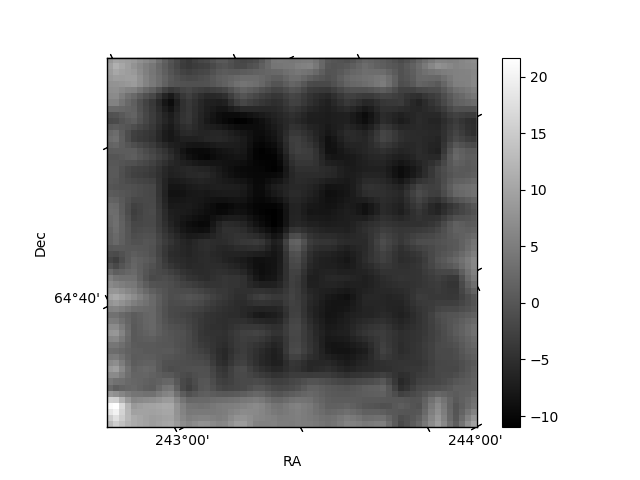
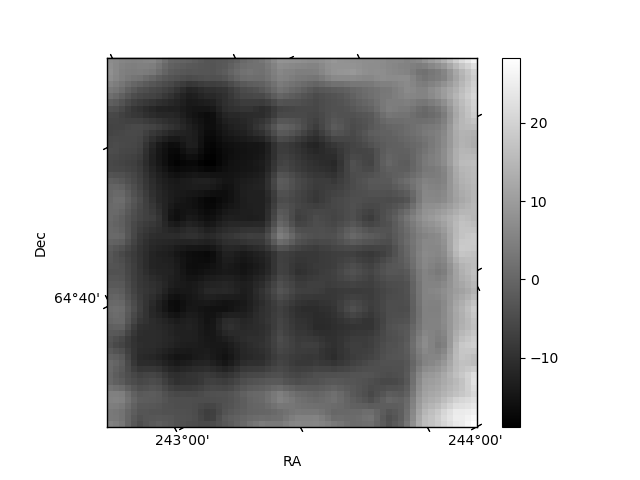
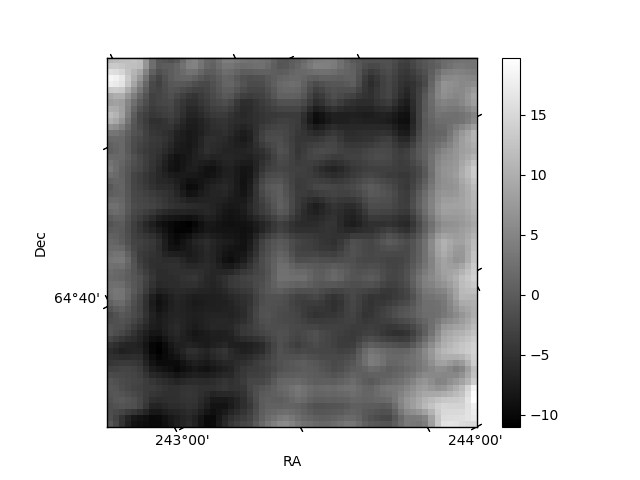
Histogram calculated using DETX and DETY for each event in the final _common_clean file
| Quadrant A | 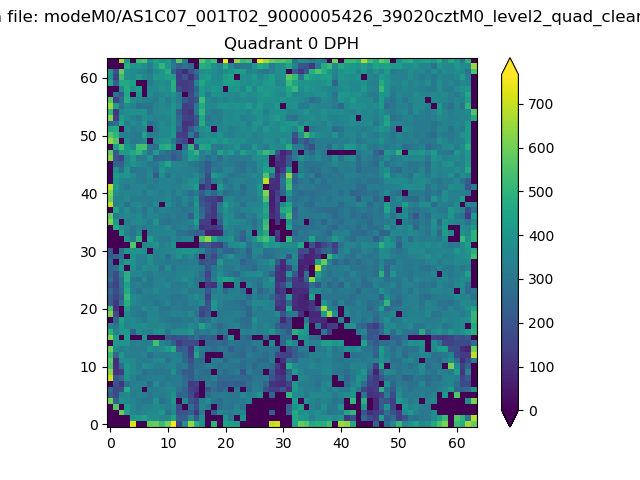 |
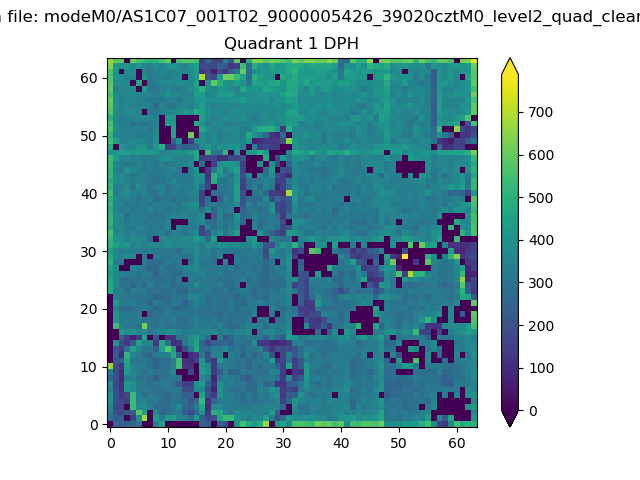 |
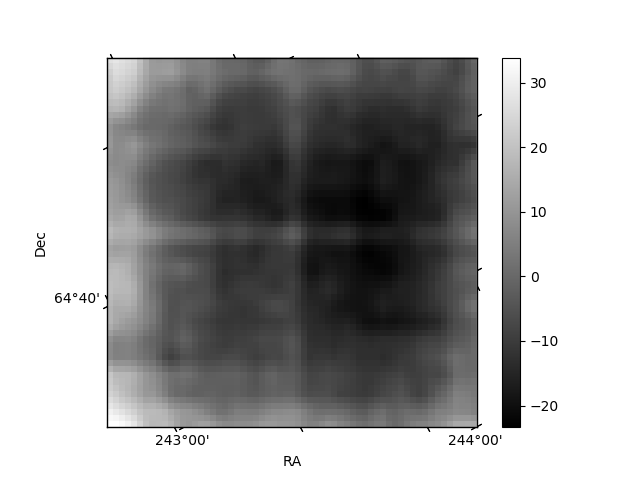
Quadrant B |
|---|---|---|---|
| Quadrant D | 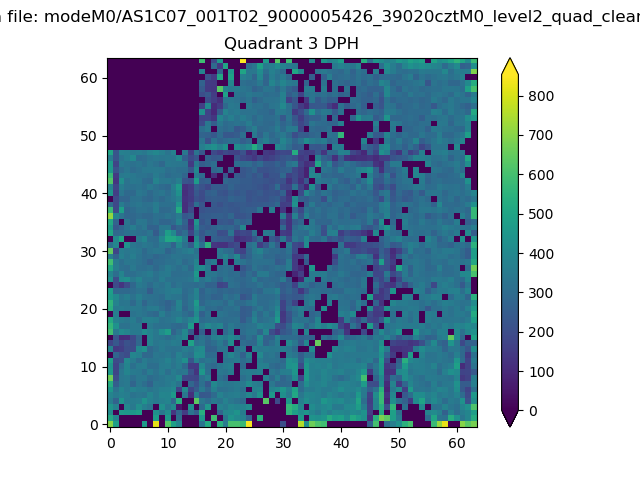 |
 |
Quadrant C |
| Plot type | Count rate plots | Images |
|---|---|---|
| Comparison with Poisson distribution Blue bars denote a histogram of data divided into 1 sec bins. Red curve is a Poisson curve with rate = median count rate of data. |
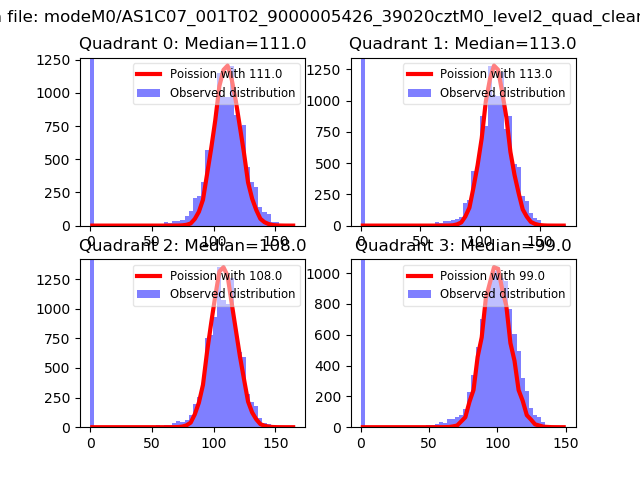 |
 |
| Quadrant-wise count rates Data is divided into 100 sec bins |
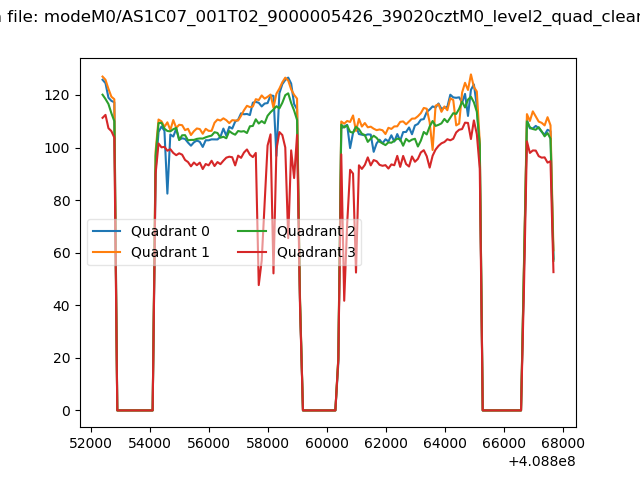 |
|
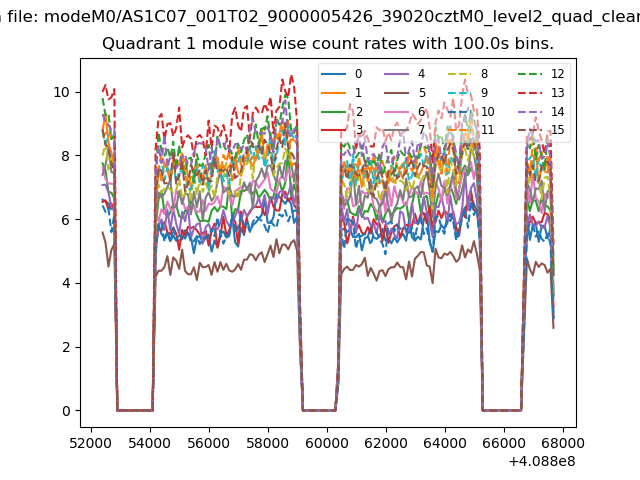
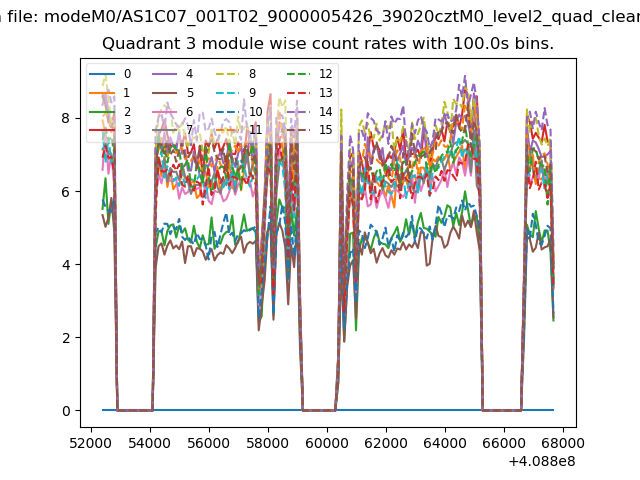
| Module-wise count rates for Quadrant A Data is divided into 100 sec bins |
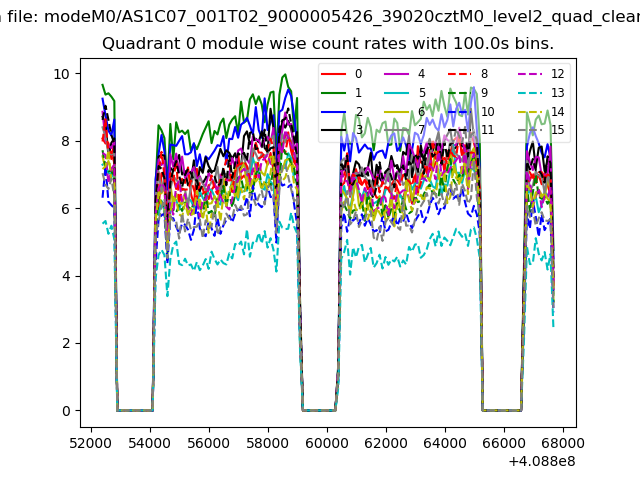 |
 |
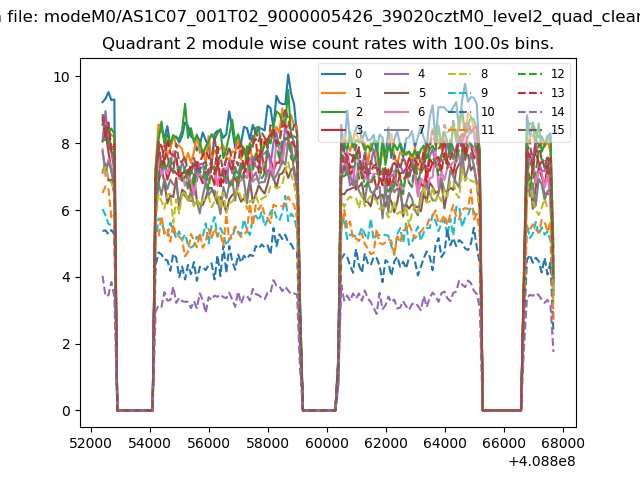
| Module-wise count rates for Quadrant B Data is divided into 100 sec bins |
 |
 |
| Module-wise count rates for Quadrant C Data is divided into 100 sec bins |
 |
 |
| Module-wise count rates for Quadrant D Data is divided into 100 sec bins |
 |
 |
| Parameter | Plot |
|---|---|
| CZT HV Monitor | 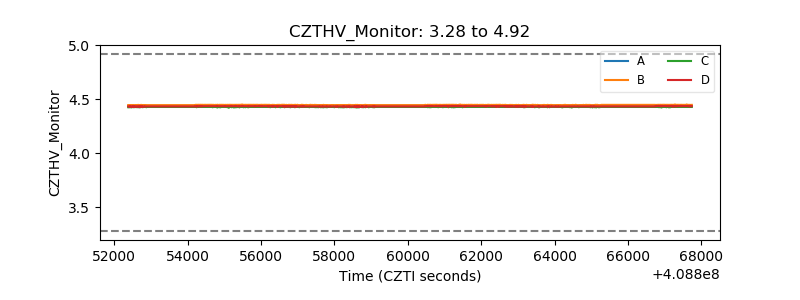 |
| D_VDD | 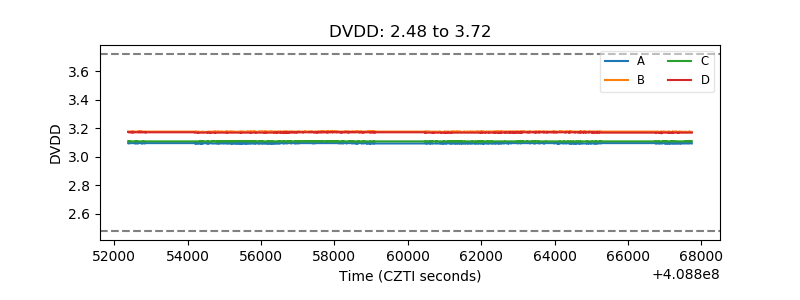 |
| Temperature 1 | 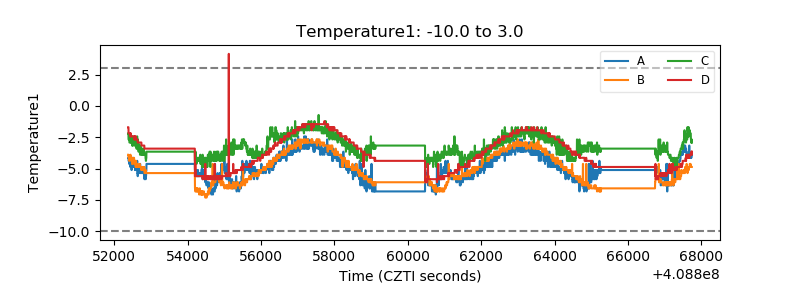 |
| Veto HV Monitor | 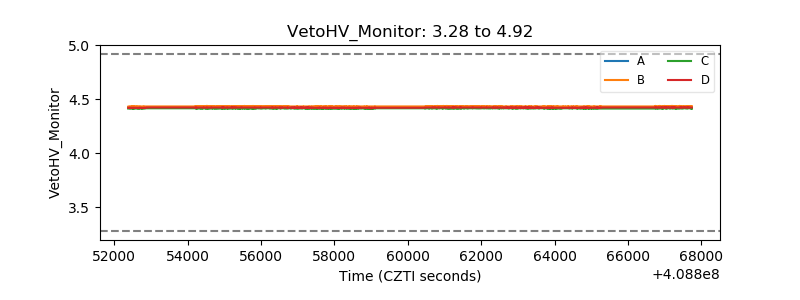 |
| Veto LLD | 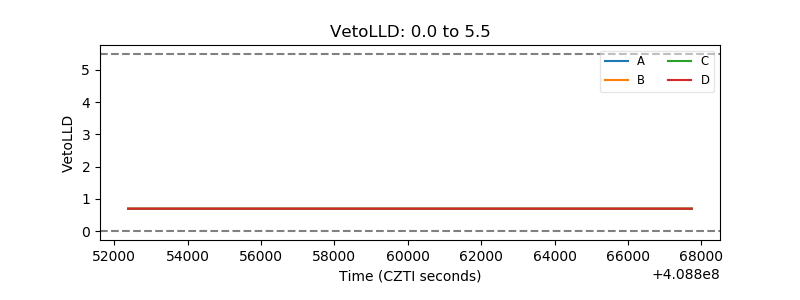 |
| Alpha Counter | 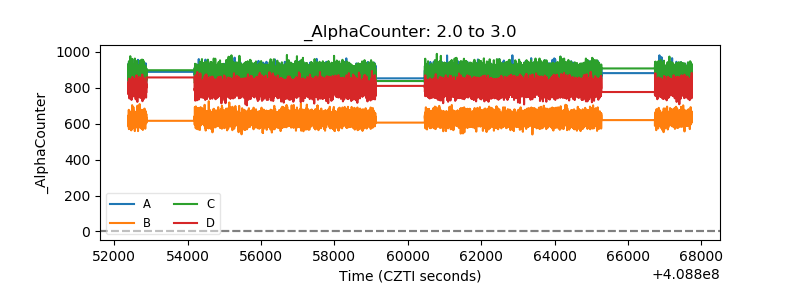 |
| _CPM_Rate | 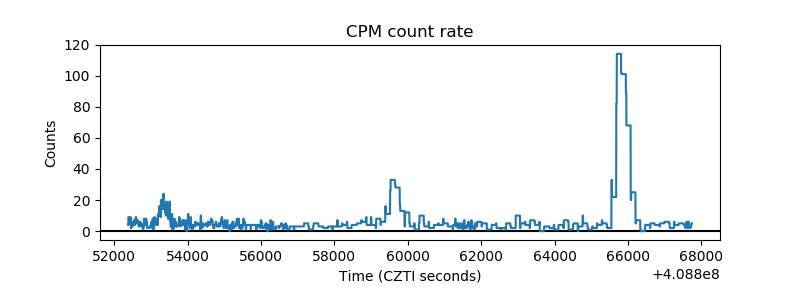 |
| CZT Counter | 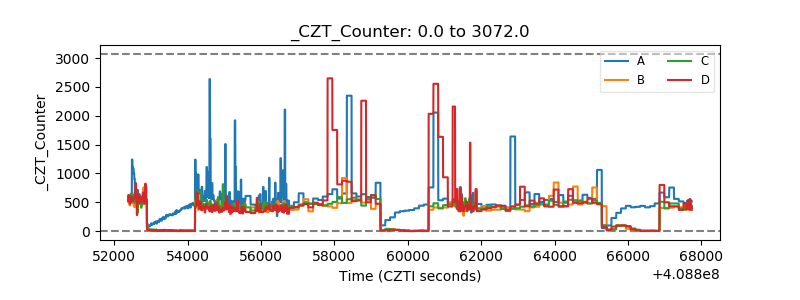 |
| +2.5 Volts monitor | 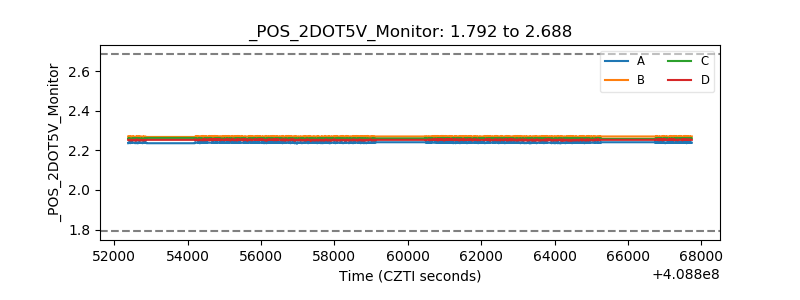 |
| +5 Volts monitor | 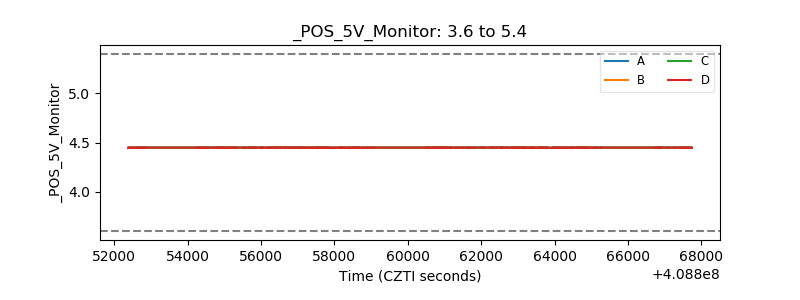 |
| _ROLL_ROT | 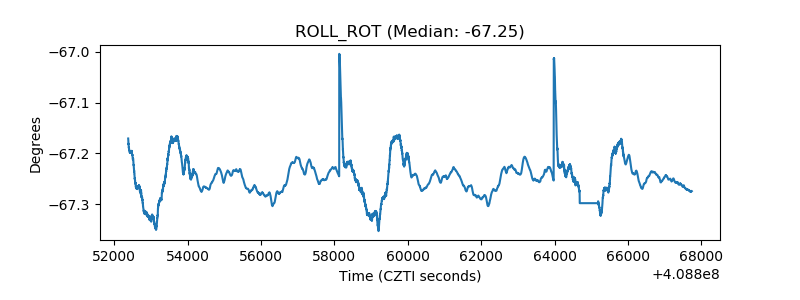 |
| _Roll_DEC | 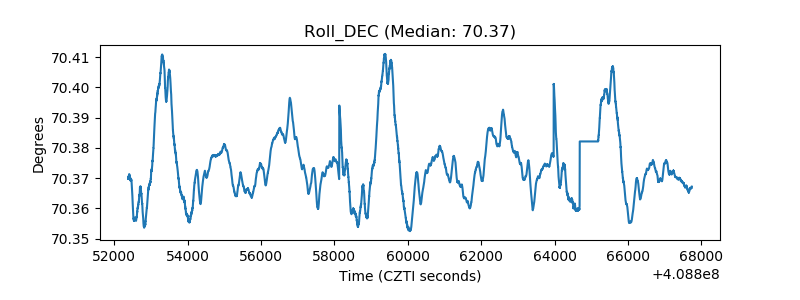 |
| _Roll_RA | 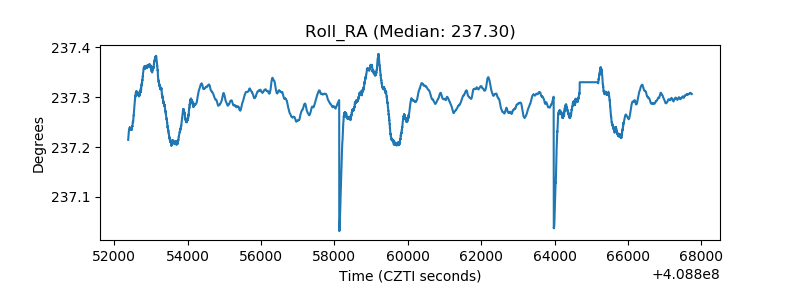 |
| Veto Counter | 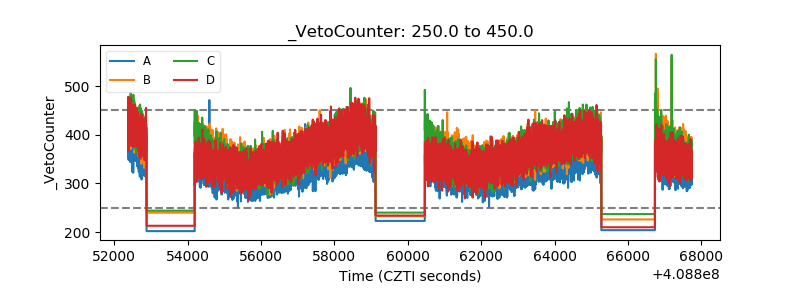 |