| Param | Original file | Final file |
|---|---|---|
| Filename | modeM0/AS1C07_001T02_9000005426_39021cztM0_level2.fits | modeM0/AS1C07_001T02_9000005426_39021cztM0_level2_quad_clean.evt |
| Size (bytes) | 328,080,960 | 94,043,520 |
| Size | 312.9 MB | 89.7 MB |
| Events in quadrant A | 3,271,476 | 630,904 |
| Events in quadrant B | 2,640,644 | 641,259 |
| Events in quadrant C | 2,634,510 | 612,226 |
| Events in quadrant D | 3,154,485 | 565,322 |
| Mode M0 | |||
|---|---|---|---|
| Quadrant | BADHDUFLAG | Total packets | Discarded packets |
| A | 0 | 13319 | 3 |
| B | 0 | 11901 | 2 |
| C | 0 | 11443 | 2 |
| D | 0 | 13163 | 2 |
| Mode M9 | |||
|---|---|---|---|
| Quadrant | BADHDUFLAG | Total packets | Discarded packets |
| A | 0 | 15 | 0 |
| B | 0 | 15 | 0 |
| C | 0 | 15 | 0 |
| D | 0 | 16 | 0 |
| Mode SS | |||
|---|---|---|---|
| Quadrant | BADHDUFLAG | Total packets | Discarded packets |
| A | 0 | 116 | 0 |
| B | 0 | 116 | 0 |
| C | 0 | 116 | 0 |
| D | 0 | 116 | 0 |
| Quadrant | Total seconds | Saturated seconds | Saturation percentage |
|---|---|---|---|
| A | 5689 | 27 | 0.474600% |
| B | 5689 | 72 | 1.265600% |
| C | 5689 | 3 | 0.052733% |
| D | 5689 | 63 | 1.107400% |
Noise dominated data is calculated using 1-second bins in cleaned event files. If a bin has >2000 counts, and if more than 50% of those come from <1% of pixels, then it is considered to be noise-dominated and hence unusable.
| Quadrant | # 1 sec bins | Bins with >0 counts | Bins with >2000 counts | High rate bins dominated by noise | Noise dominated (total time) | Noise dominated (detector-on time) | Marked lightcurve |
|---|---|---|---|---|---|---|---|
| A | 7240 | 5689 | 12 | 12 | 0.17% | 0.21% | 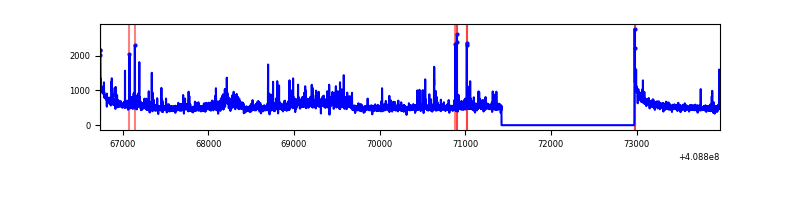 |
| B | 7240 | 5688 | 51 | 51 | 0.70% | 0.90% | 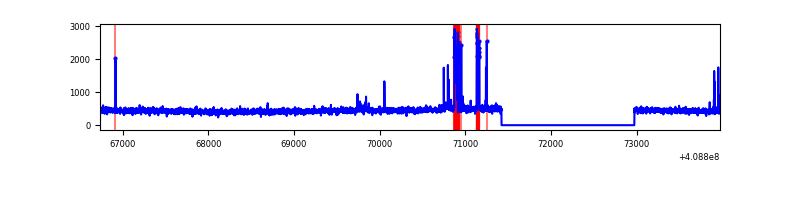 |
| C | 7240 | 5688 | 0 | 0 | 0.00% | 0.00% | 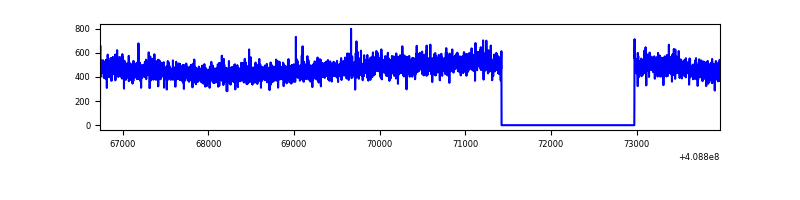 |
| D | 7240 | 5688 | 69 | 69 | 0.95% | 1.21% | 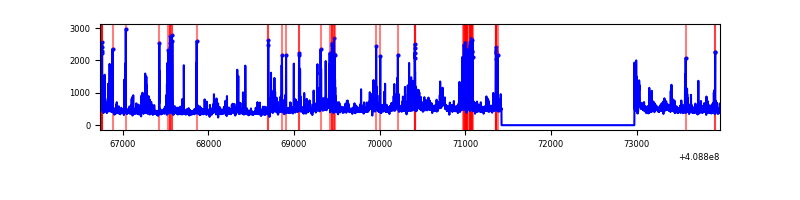 |
Top three noisy pixels from each quadrant. If the there are fewer than three noisy pixels in the level2.evt file, extra rows are filled as -1
| Pixel properties | Quadrant properties | ||||||
|---|---|---|---|---|---|---|---|
| Quadrant | DetID | PixID | Counts | Sigma | Mean | Median | Sigma |
| A | 10 | 83 | 435889 | 3438.43 | 626 | 614 | 126.6 |
| A | 6 | 10 | 246320 | 1940.94 | 626 | 614 | 126.6 |
| A | 12 | 16 | 64087 | 501.4 | 626 | 614 | 126.6 |
| B | 5 | 172 | 192861 | 1608.59 | 616 | 600 | 119.5 |
| B | 0 | 230 | 24781 | 202.32 | 616 | 600 | 119.5 |
| B | 12 | 111 | 14988 | 120.38 | 616 | 600 | 119.5 |
| C | 15 | 214 | 241748 | 1715.02 | 606 | 610 | 140.6 |
| C | 1 | 128 | 19764 | 136.23 | 606 | 610 | 140.6 |
| C | 13 | 61 | 4182 | 25.4 | 606 | 610 | 140.6 |
| D | 12 | 227 | 403143 | 2730.23 | 605 | 588 | 147.4 |
| D | 12 | 235 | 155798 | 1052.67 | 605 | 588 | 147.4 |
| D | 2 | 250 | 78007 | 525.07 | 605 | 588 | 147.4 |
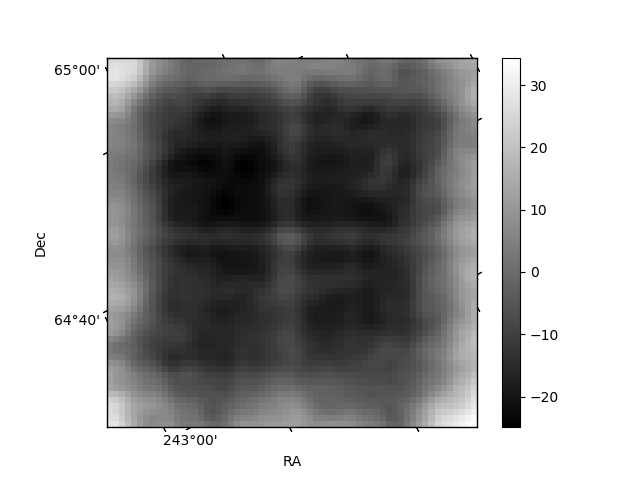
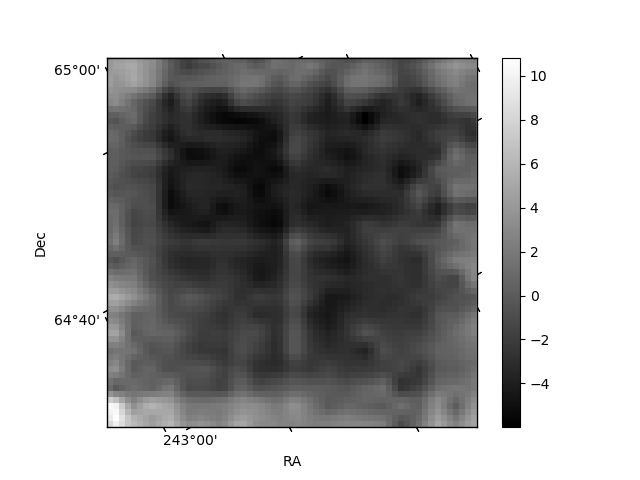
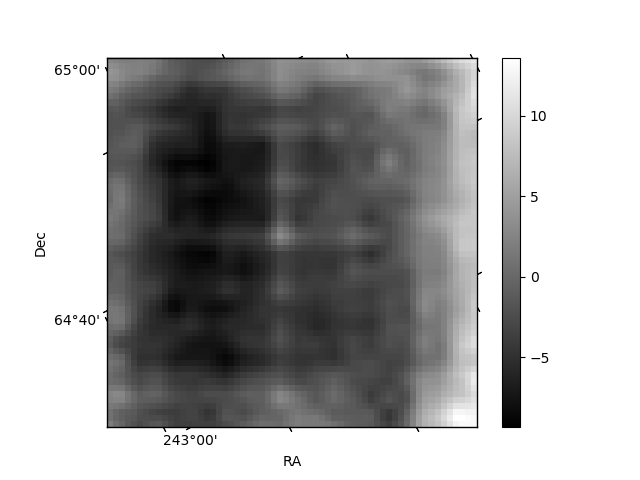
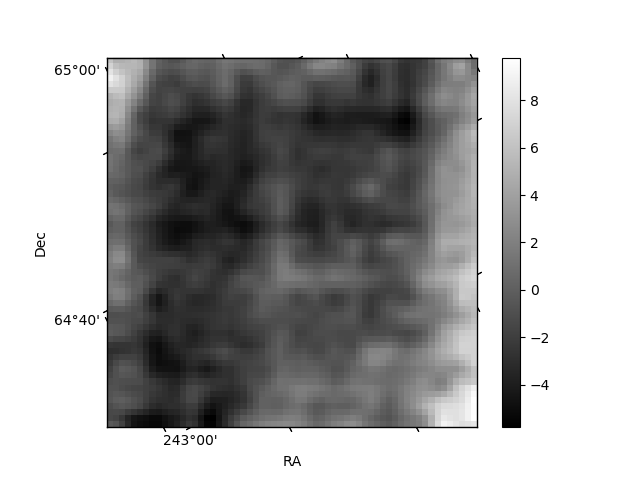
Histogram calculated using DETX and DETY for each event in the final _common_clean file
| Quadrant A | 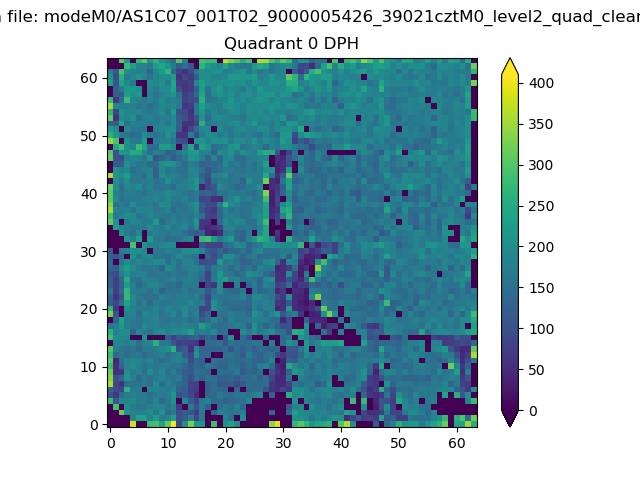 |
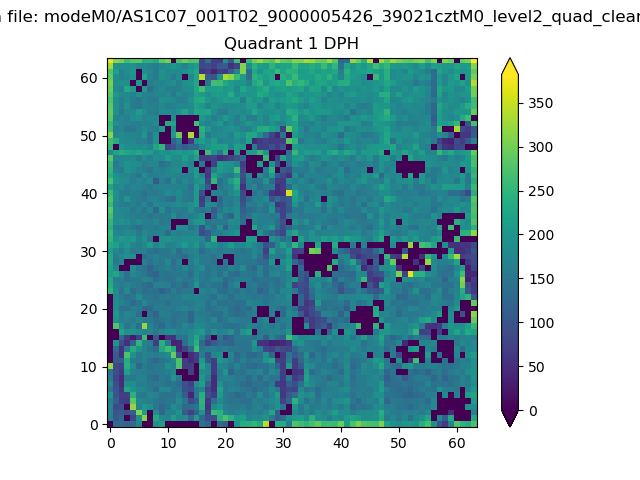 |
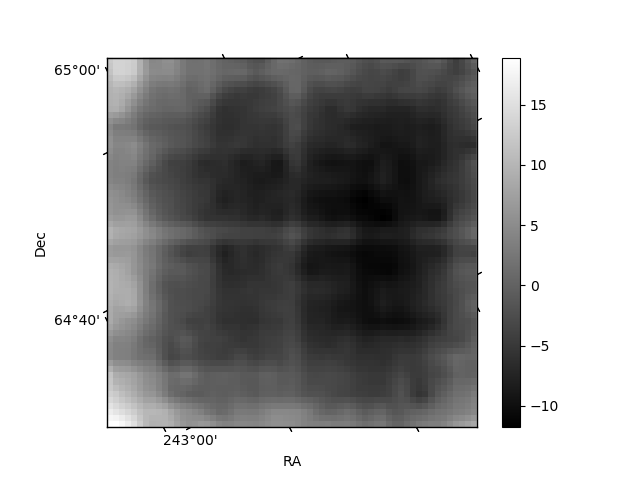
Quadrant B |
|---|---|---|---|
| Quadrant D | 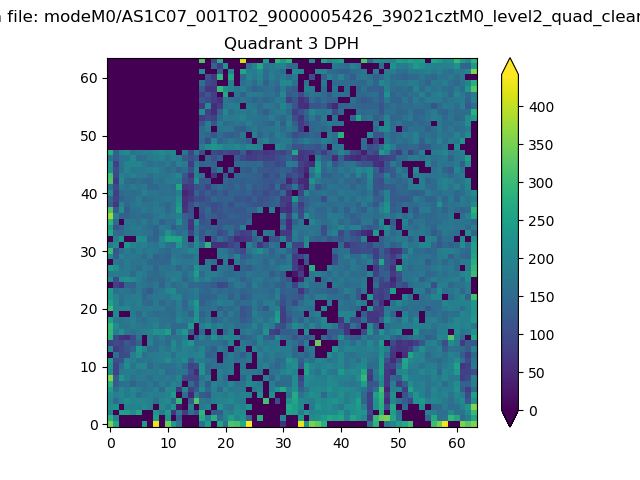 |
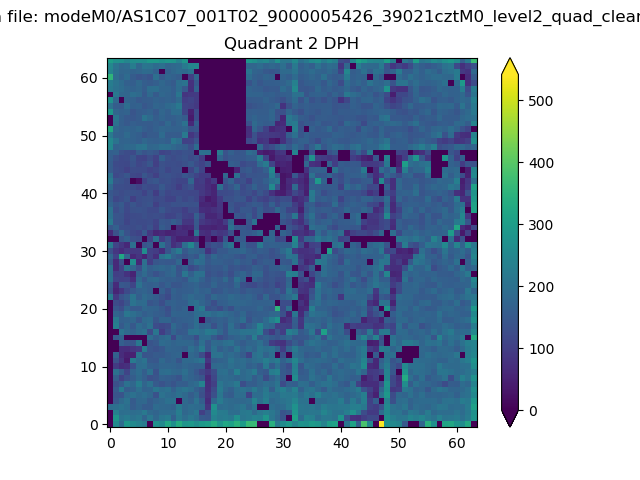 |
Quadrant C |
| Plot type | Count rate plots | Images |
|---|---|---|
| Comparison with Poisson distribution Blue bars denote a histogram of data divided into 1 sec bins. Red curve is a Poisson curve with rate = median count rate of data. |
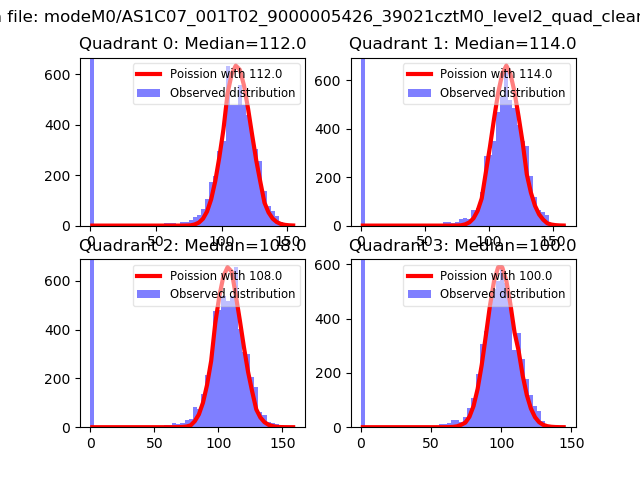 |
 |
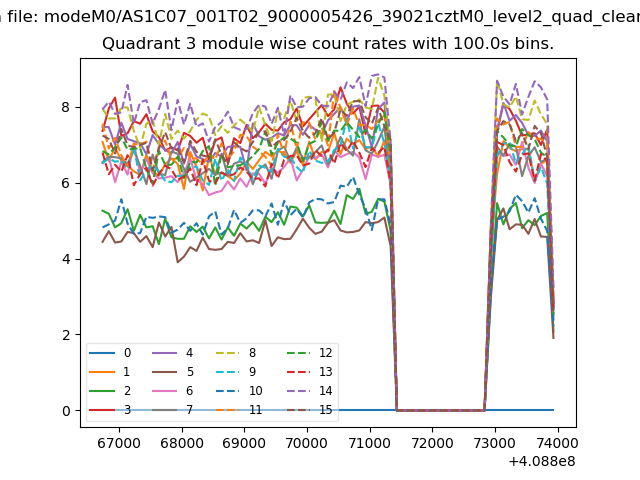
| Quadrant-wise count rates Data is divided into 100 sec bins |
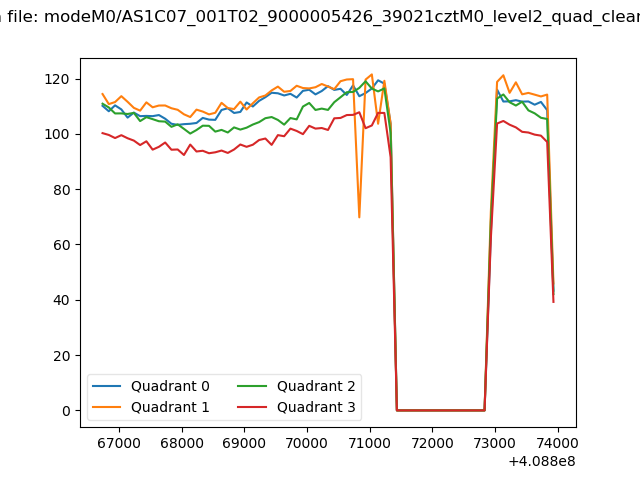 |
|
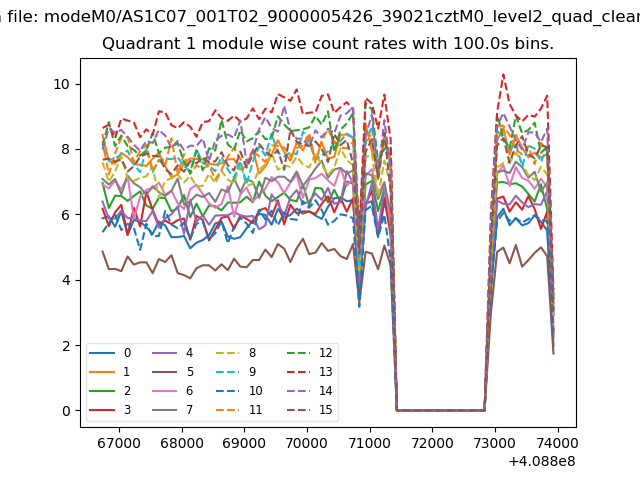
| Module-wise count rates for Quadrant A Data is divided into 100 sec bins |
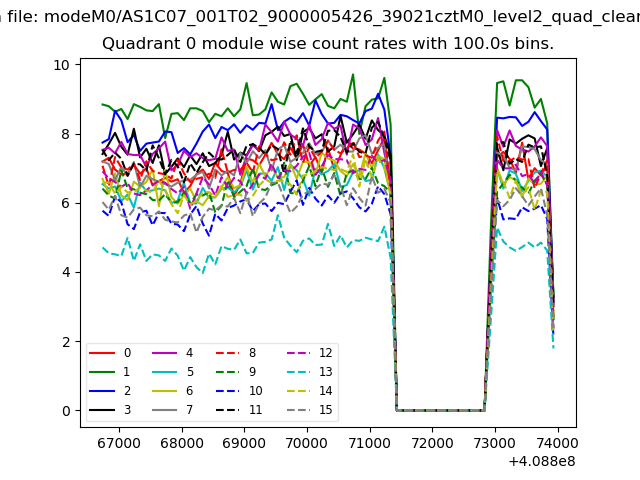 |
 |
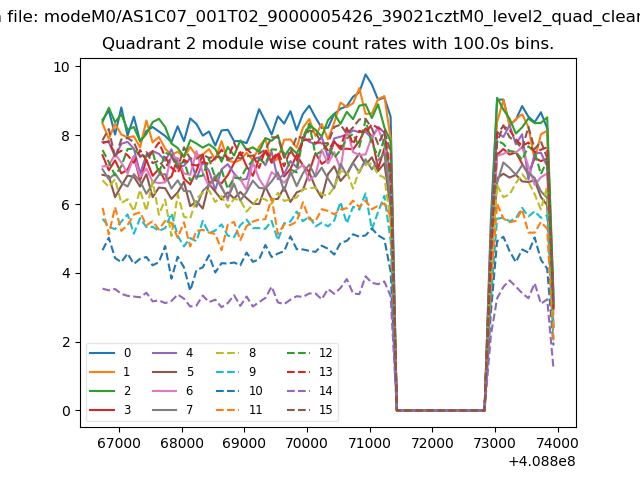
| Module-wise count rates for Quadrant B Data is divided into 100 sec bins |
 |
 |
| Module-wise count rates for Quadrant C Data is divided into 100 sec bins |
 |
 |
| Module-wise count rates for Quadrant D Data is divided into 100 sec bins |
 |
 |
| Parameter | Plot |
|---|---|
| CZT HV Monitor | 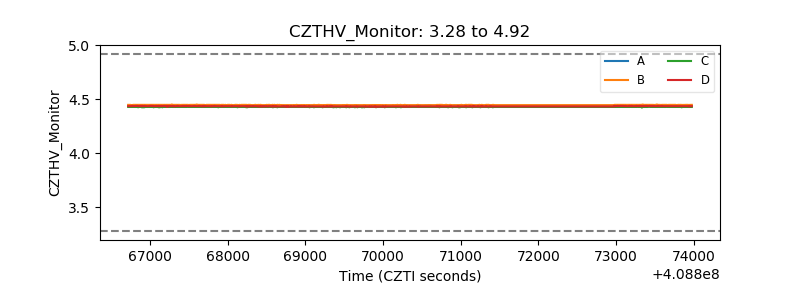 |
| D_VDD | 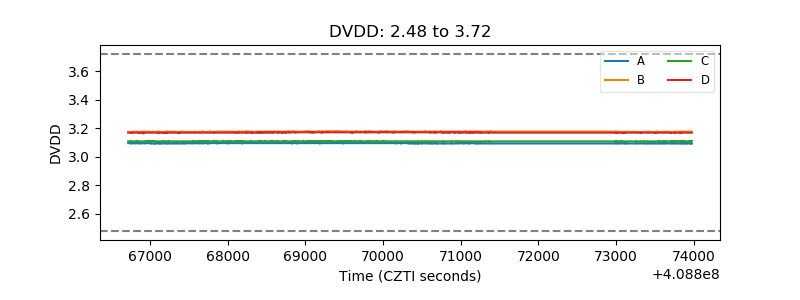 |
| Temperature 1 | 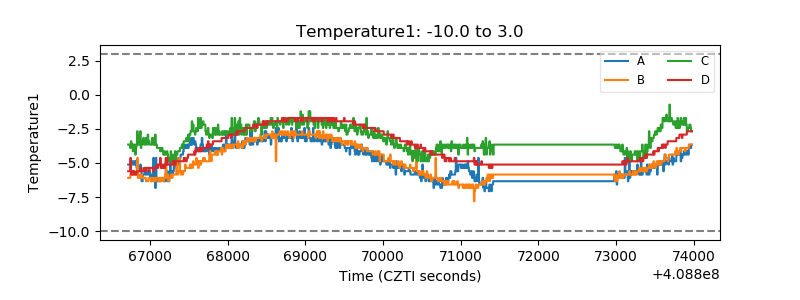 |
| Veto HV Monitor | 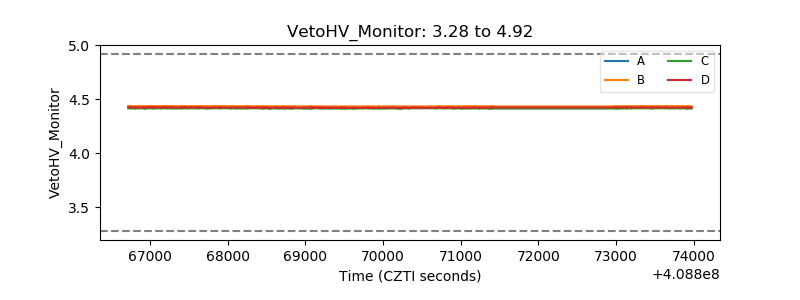 |
| Veto LLD | 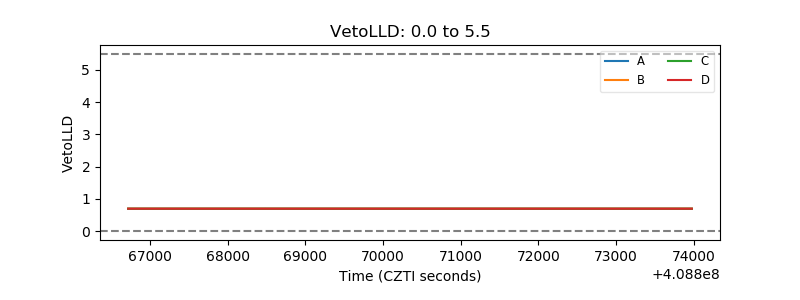 |
| Alpha Counter | 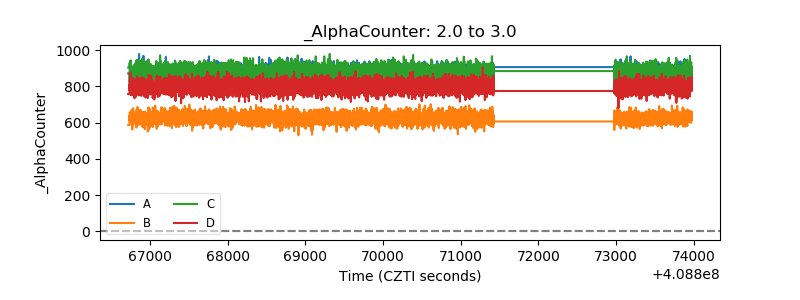 |
| _CPM_Rate | 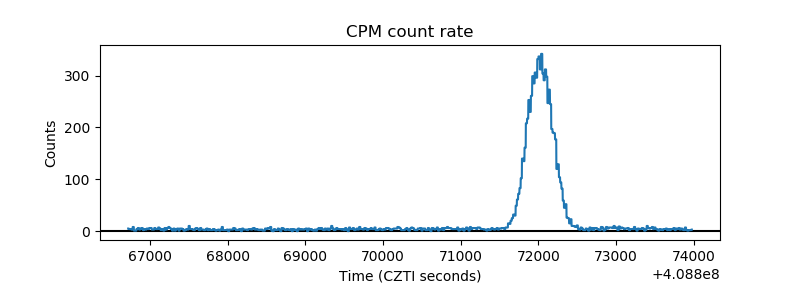 |
| CZT Counter | 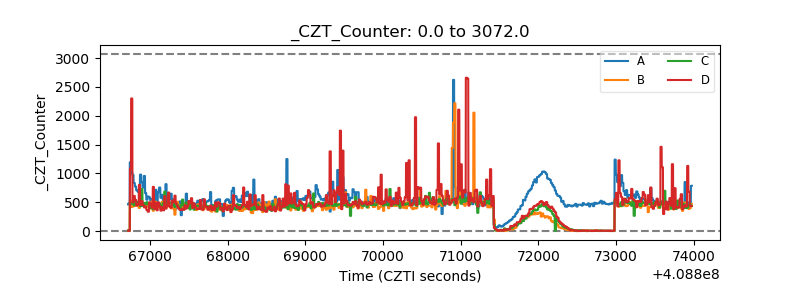 |
| +2.5 Volts monitor | 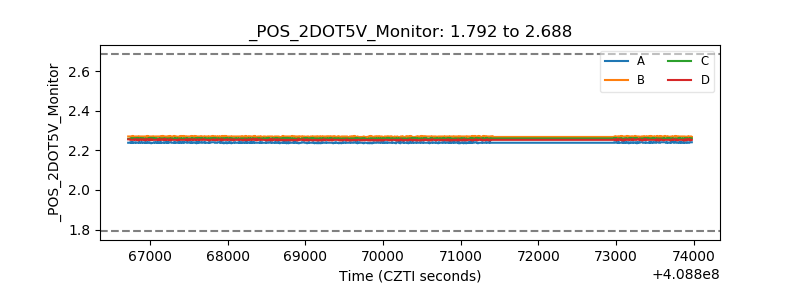 |
| +5 Volts monitor | 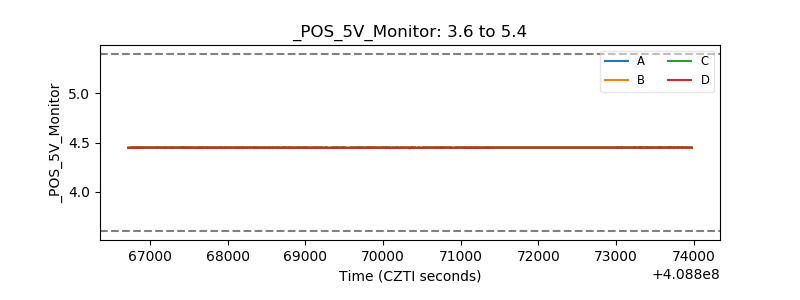 |
| _ROLL_ROT | 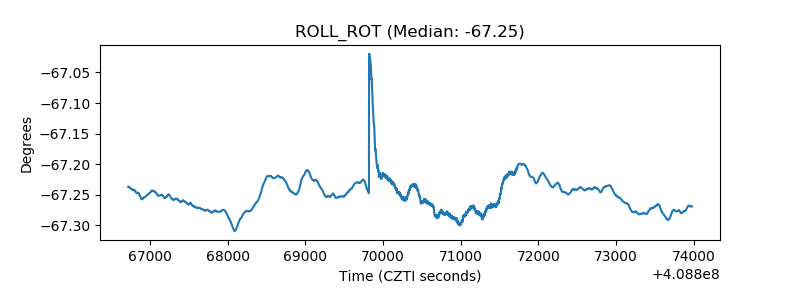 |
| _Roll_DEC | 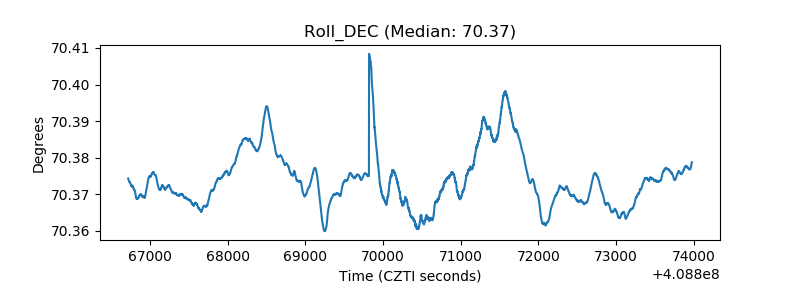 |
| _Roll_RA | 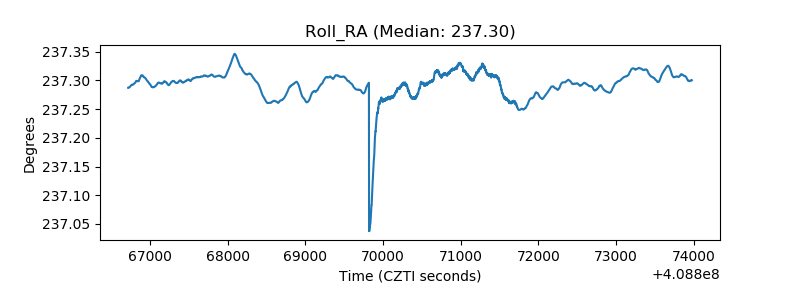 |
| Veto Counter | 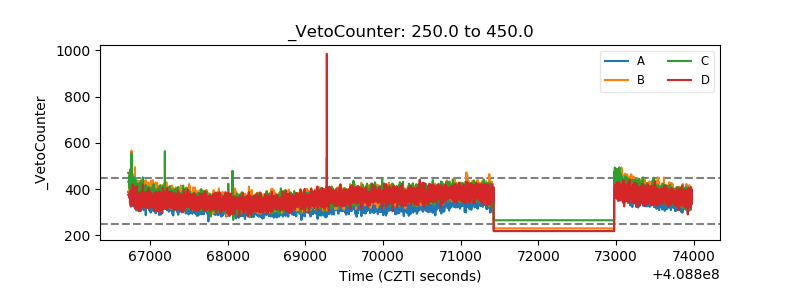 |