| Param | Original file | Final file |
|---|---|---|
| Filename | modeM0/AS1C07_001T02_9000005426_39024cztM0_level2.fits | modeM0/AS1C07_001T02_9000005426_39024cztM0_level2_quad_clean.evt |
| Size (bytes) | 305,930,880 | 93,349,440 |
| Size | 291.8 MB | 89.0 MB |
| Events in quadrant A | 2,892,901 | 636,272 |
| Events in quadrant B | 2,425,304 | 644,422 |
| Events in quadrant C | 2,552,438 | 608,987 |
| Events in quadrant D | 3,038,223 | 564,332 |
| Mode M0 | |||
|---|---|---|---|
| Quadrant | BADHDUFLAG | Total packets | Discarded packets |
| A | 0 | 11870 | 2 |
| B | 0 | 10830 | 1 |
| C | 0 | 10743 | 1 |
| D | 0 | 12541 | 1 |
| Mode M9 | |||
|---|---|---|---|
| Quadrant | BADHDUFLAG | Total packets | Discarded packets |
| A | 0 | 21 | 0 |
| B | 0 | 21 | 0 |
| C | 0 | 21 | 0 |
| D | 0 | 22 | 0 |
| Mode SS | |||
|---|---|---|---|
| Quadrant | BADHDUFLAG | Total packets | Discarded packets |
| A | 0 | 106 | 0 |
| B | 0 | 106 | 0 |
| C | 0 | 106 | 0 |
| D | 0 | 106 | 0 |
| Quadrant | Total seconds | Saturated seconds | Saturation percentage |
|---|---|---|---|
| A | 5332 | 35 | 0.656414% |
| B | 5332 | 9 | 0.168792% |
| C | 5332 | 3 | 0.056264% |
| D | 5332 | 78 | 1.462866% |
Noise dominated data is calculated using 1-second bins in cleaned event files. If a bin has >2000 counts, and if more than 50% of those come from <1% of pixels, then it is considered to be noise-dominated and hence unusable.
| Quadrant | # 1 sec bins | Bins with >0 counts | Bins with >2000 counts | High rate bins dominated by noise | Noise dominated (total time) | Noise dominated (detector-on time) | Marked lightcurve |
|---|---|---|---|---|---|---|---|
| A | 7155 | 5332 | 26 | 26 | 0.36% | 0.49% | 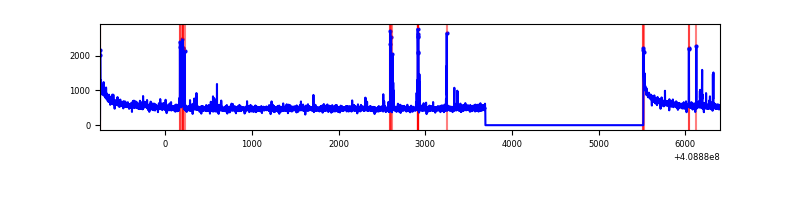 |
| B | 7154 | 5331 | 5 | 5 | 0.07% | 0.09% | 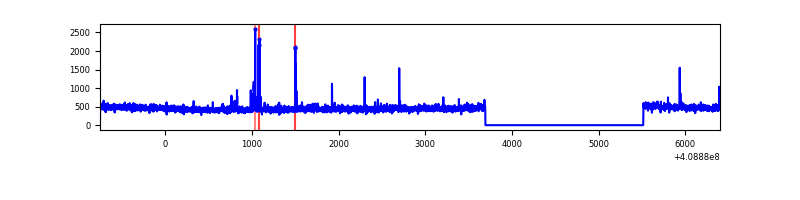 |
| C | 7154 | 5331 | 0 | 0 | 0.00% | 0.00% | 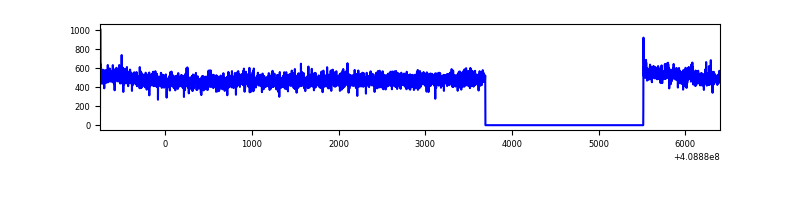 |
| D | 7154 | 5331 | 79 | 79 | 1.10% | 1.48% | 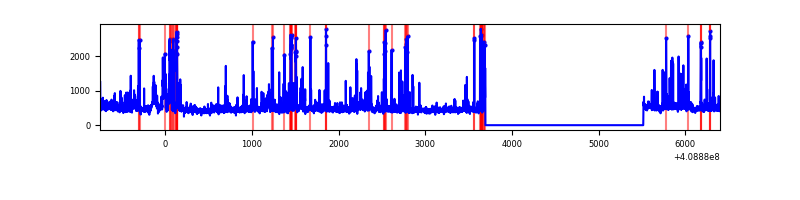 |
Top three noisy pixels from each quadrant. If the there are fewer than three noisy pixels in the level2.evt file, extra rows are filled as -1
| Pixel properties | Quadrant properties | ||||||
|---|---|---|---|---|---|---|---|
| Quadrant | DetID | PixID | Counts | Sigma | Mean | Median | Sigma |
| A | 10 | 83 | 415150 | 3413.56 | 605 | 593 | 121.4 |
| A | 9 | 143 | 53876 | 438.75 | 605 | 593 | 121.4 |
| A | 6 | 10 | 44927 | 365.06 | 605 | 593 | 121.4 |
| B | 5 | 172 | 31381 | 268.99 | 597 | 580 | 114.5 |
| B | 15 | 85 | 28871 | 247.07 | 597 | 580 | 114.5 |
| B | 0 | 230 | 22137 | 188.26 | 597 | 580 | 114.5 |
| C | 15 | 214 | 226843 | 1665.91 | 587 | 590 | 135.8 |
| C | 1 | 128 | 21611 | 154.78 | 587 | 590 | 135.8 |
| C | 3 | 233 | 7500 | 50.88 | 587 | 590 | 135.8 |
| D | 12 | 227 | 297312 | 2094.8 | 589 | 572 | 141.7 |
| D | 13 | 171 | 169915 | 1195.45 | 589 | 572 | 141.7 |
| D | 12 | 235 | 91245 | 640.09 | 589 | 572 | 141.7 |
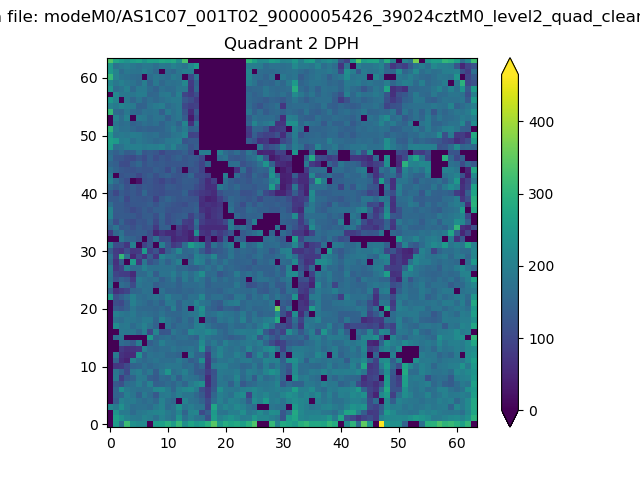
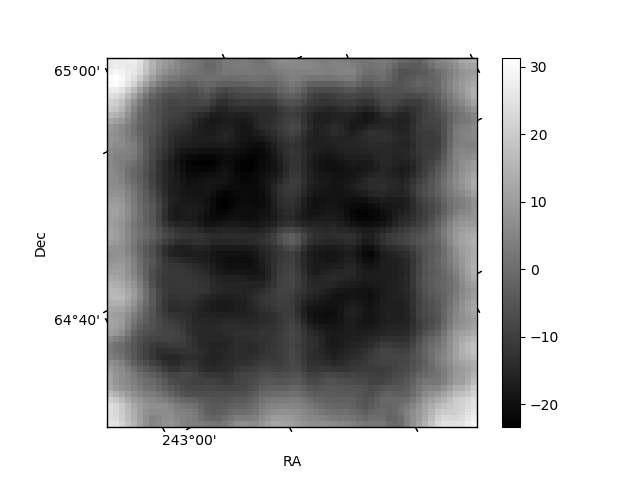
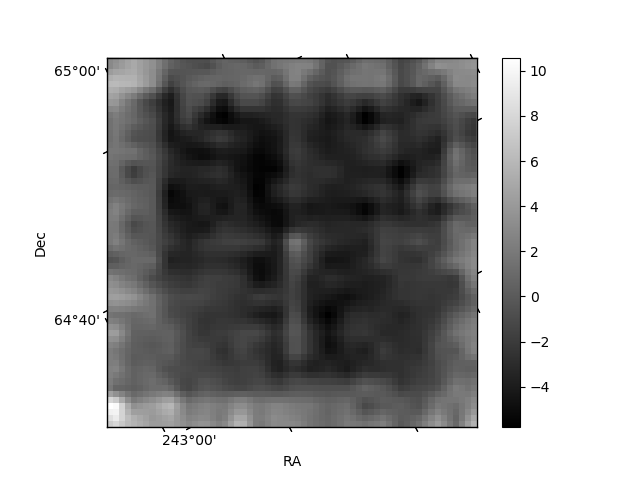
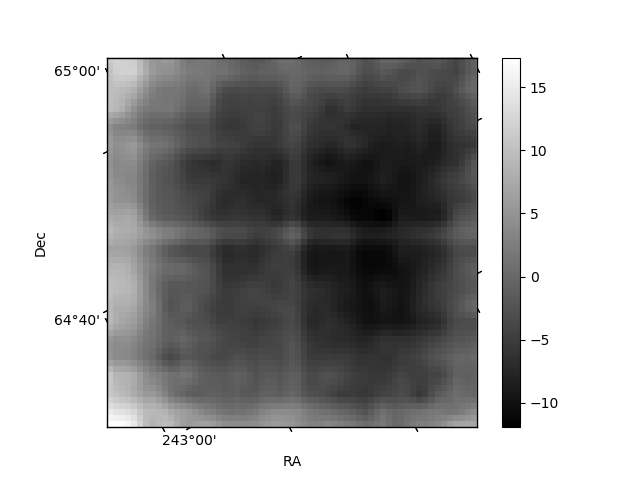
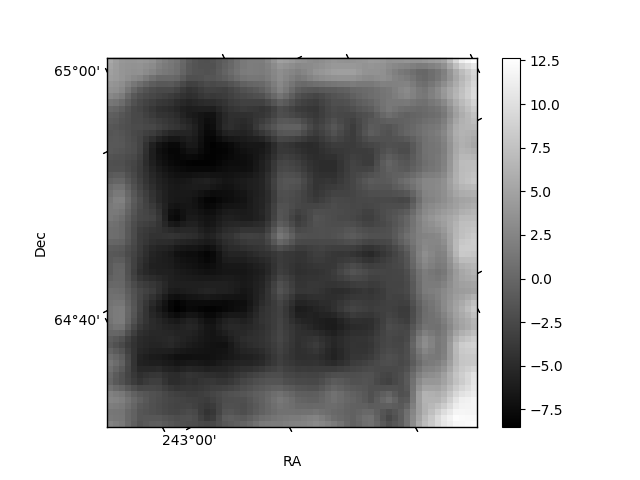
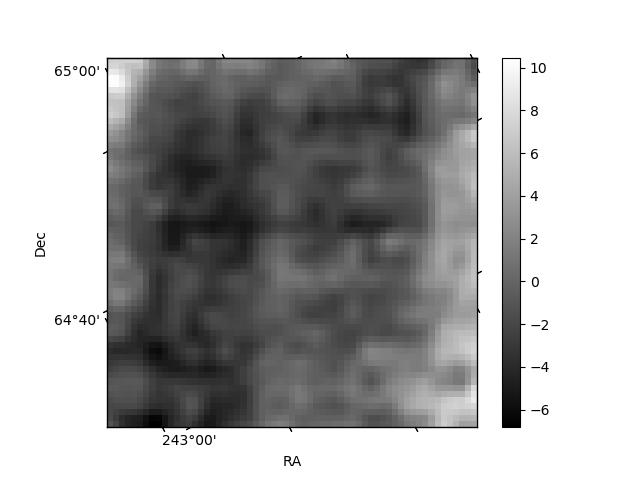
Histogram calculated using DETX and DETY for each event in the final _common_clean file
| Quadrant A | 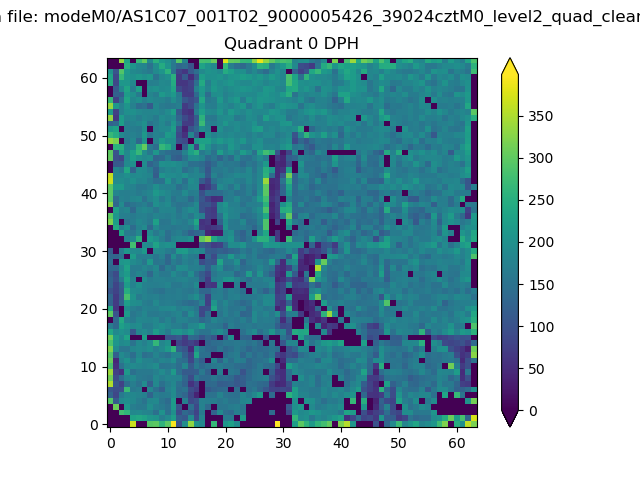 |
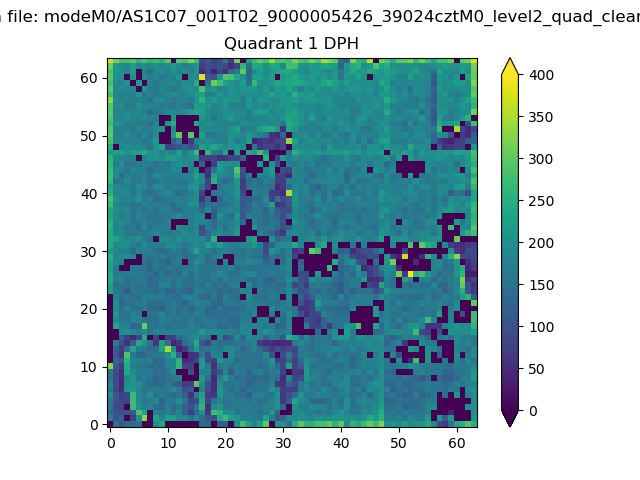 |
Quadrant B |
|---|---|---|---|
| Quadrant D | 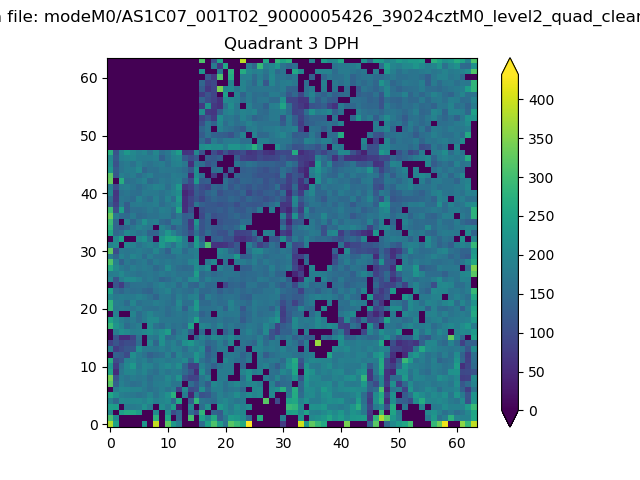 |
 |
Quadrant C |
| Plot type | Count rate plots | Images |
|---|---|---|
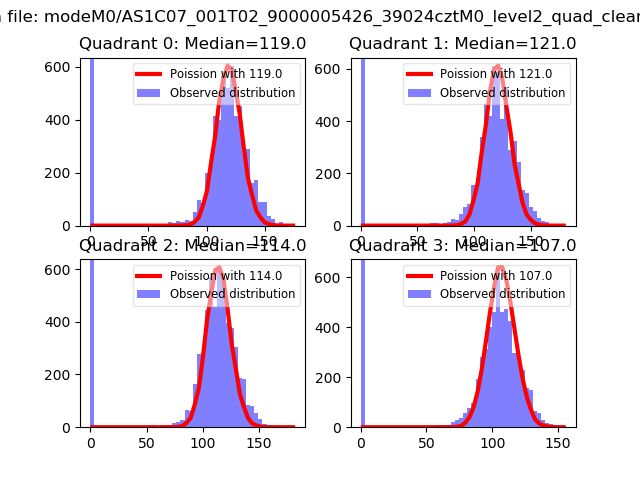
| Comparison with Poisson distribution Blue bars denote a histogram of data divided into 1 sec bins. Red curve is a Poisson curve with rate = median count rate of data. |
 |
 |
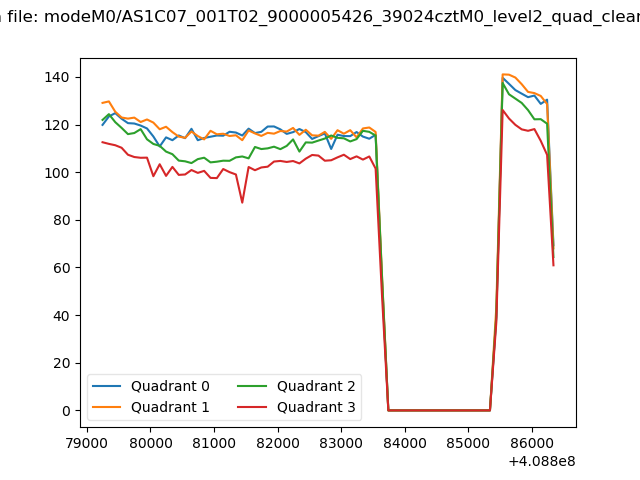
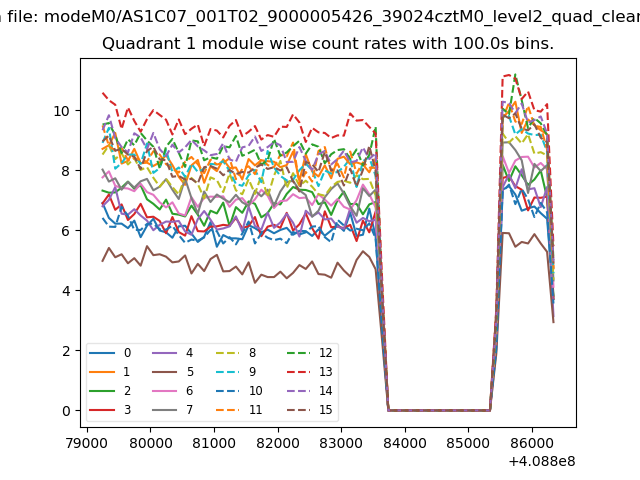
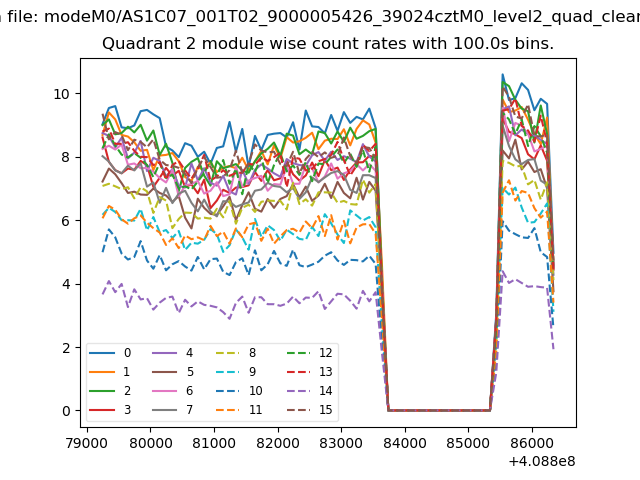
| Quadrant-wise count rates Data is divided into 100 sec bins |
 |
|
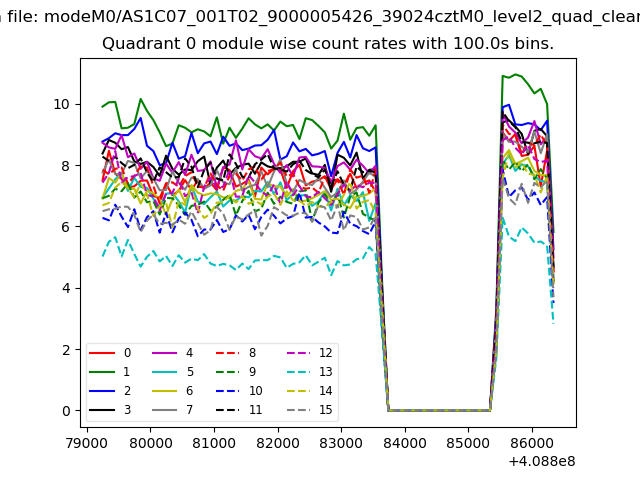
| Module-wise count rates for Quadrant A Data is divided into 100 sec bins |
 |
 |
| Module-wise count rates for Quadrant B Data is divided into 100 sec bins |
 |
 |
| Module-wise count rates for Quadrant C Data is divided into 100 sec bins |
 |
 |
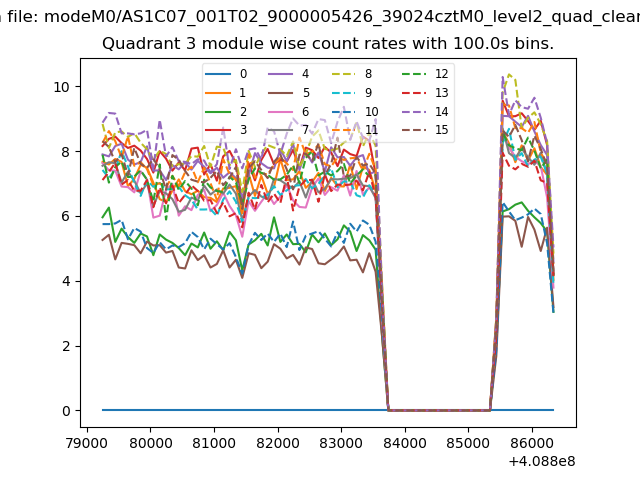
| Module-wise count rates for Quadrant D Data is divided into 100 sec bins |
 |
 |
| Parameter | Plot |
|---|---|
| CZT HV Monitor | 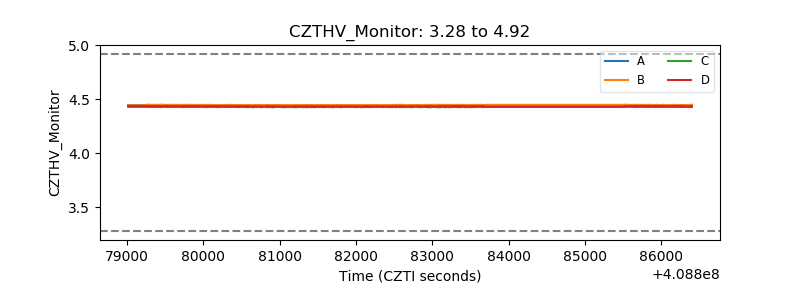 |
| D_VDD | 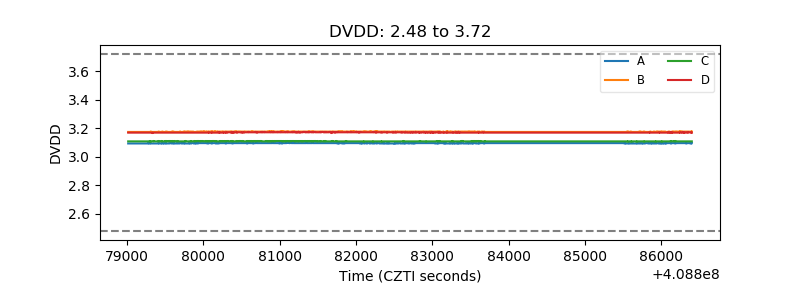 |
| Temperature 1 | 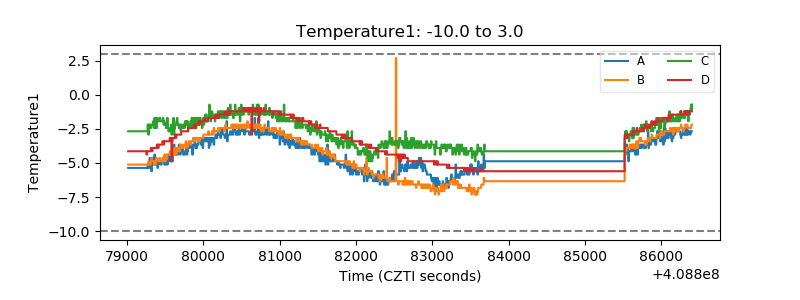 |
| Veto HV Monitor | 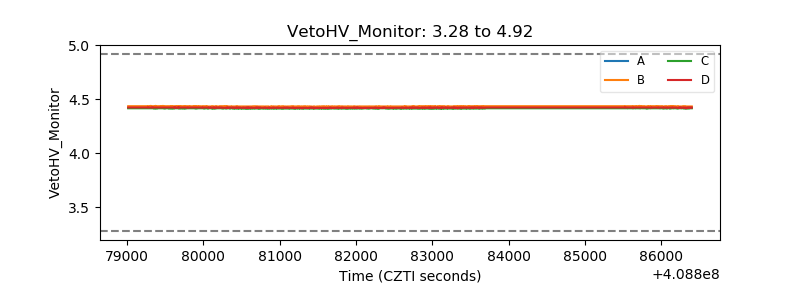 |
| Veto LLD | 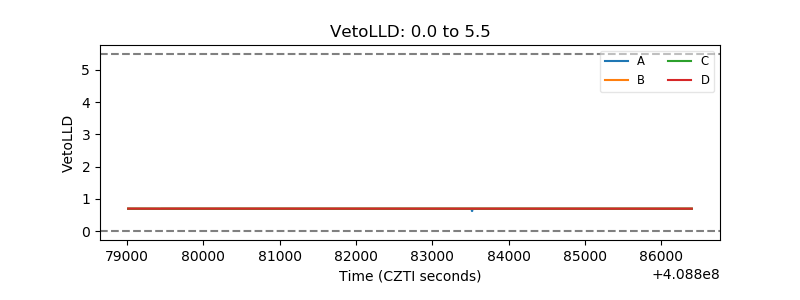 |
| Alpha Counter | 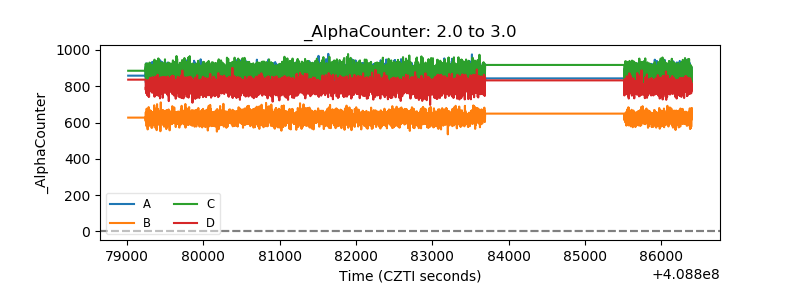 |
| _CPM_Rate | 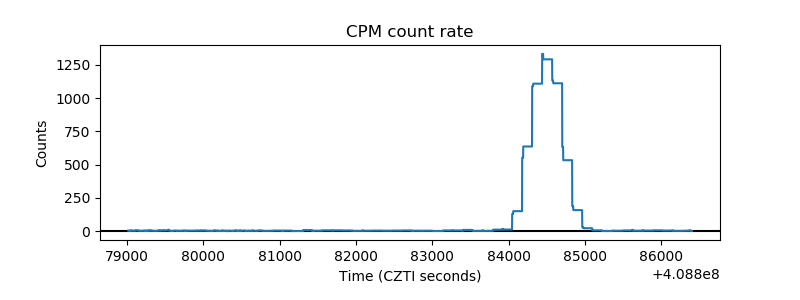 |
| CZT Counter | 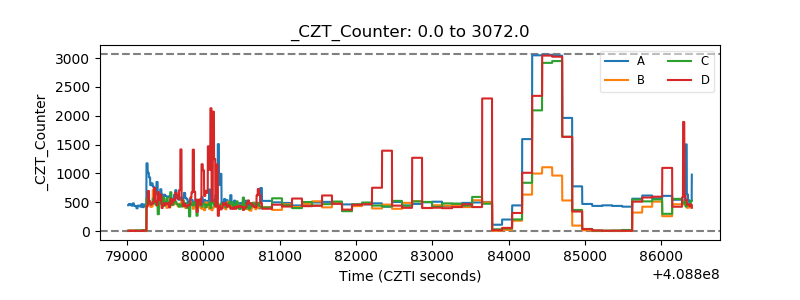 |
| +2.5 Volts monitor |  |
| +5 Volts monitor | 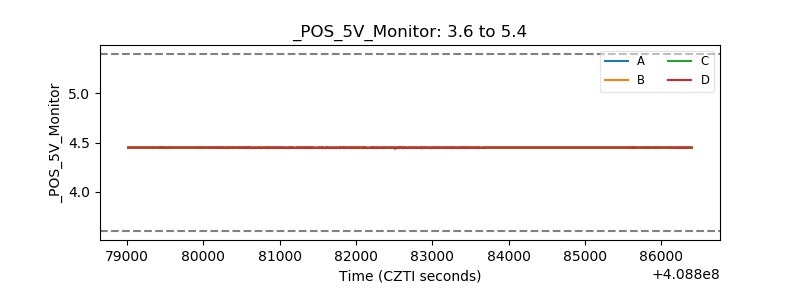 |
| _ROLL_ROT | 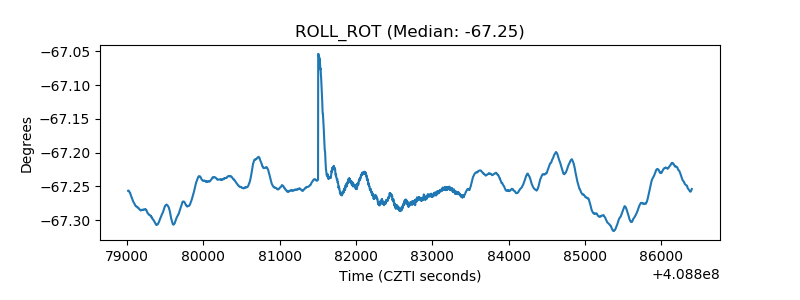 |
| _Roll_DEC | 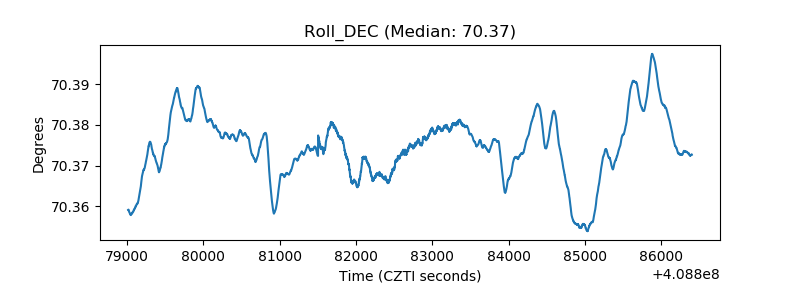 |
| _Roll_RA | 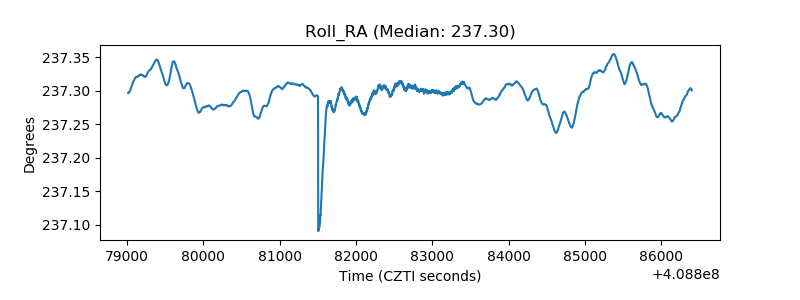 |
| Veto Counter | 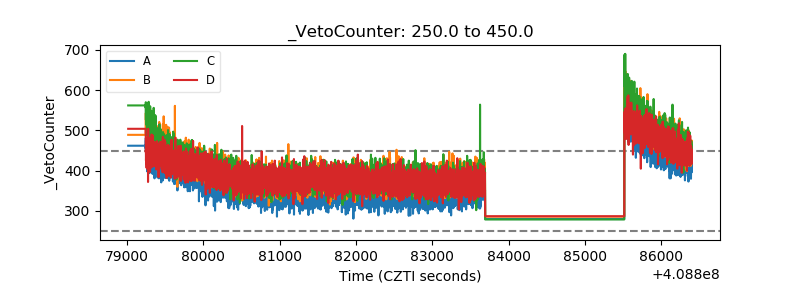 |