| Param | Original file | Final file |
|---|---|---|
| Filename | modeM0/AS1C07_001T02_9000005426_39025cztM0_level2.fits | modeM0/AS1C07_001T02_9000005426_39025cztM0_level2_quad_clean.evt |
| Size (bytes) | 341,035,200 | 93,165,120 |
| Size | 325.2 MB | 88.8 MB |
| Events in quadrant A | 4,187,136 | 615,212 |
| Events in quadrant B | 2,498,402 | 650,914 |
| Events in quadrant C | 2,526,862 | 621,730 |
| Events in quadrant D | 3,010,413 | 572,782 |
| Mode M0 | |||
|---|---|---|---|
| Quadrant | BADHDUFLAG | Total packets | Discarded packets |
| A | 0 | 15699 | 2 |
| B | 0 | 10863 | 1 |
| C | 0 | 10473 | 1 |
| D | 0 | 12237 | 1 |
| Mode M9 | |||
|---|---|---|---|
| Quadrant | BADHDUFLAG | Total packets | Discarded packets |
| A | 0 | 21 | 0 |
| B | 0 | 21 | 0 |
| C | 0 | 21 | 0 |
| D | 0 | 22 | 0 |
| Mode SS | |||
|---|---|---|---|
| Quadrant | BADHDUFLAG | Total packets | Discarded packets |
| A | 0 | 104 | 0 |
| B | 0 | 104 | 0 |
| C | 0 | 104 | 0 |
| D | 0 | 104 | 0 |
| Quadrant | Total seconds | Saturated seconds | Saturation percentage |
|---|---|---|---|
| A | 5149 | 392 | 7.613129% |
| B | 5149 | 26 | 0.504952% |
| C | 5149 | 5 | 0.097106% |
| D | 5149 | 106 | 2.058652% |
Noise dominated data is calculated using 1-second bins in cleaned event files. If a bin has >2000 counts, and if more than 50% of those come from <1% of pixels, then it is considered to be noise-dominated and hence unusable.
| Quadrant | # 1 sec bins | Bins with >0 counts | Bins with >2000 counts | High rate bins dominated by noise | Noise dominated (total time) | Noise dominated (detector-on time) | Marked lightcurve |
|---|---|---|---|---|---|---|---|
| A | 7091 | 5149 | 437 | 437 | 6.16% | 8.49% | 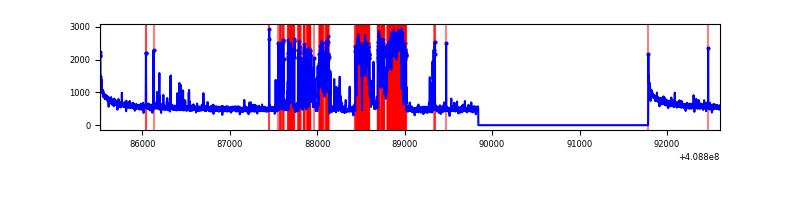 |
| B | 7091 | 5148 | 10 | 10 | 0.14% | 0.19% | 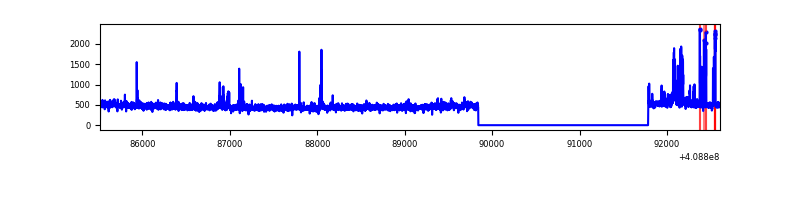 |
| C | 7091 | 5148 | 0 | 0 | 0.00% | 0.00% | 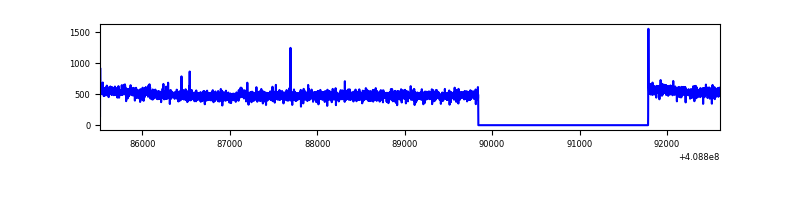 |
| D | 7091 | 5148 | 106 | 106 | 1.49% | 2.06% | 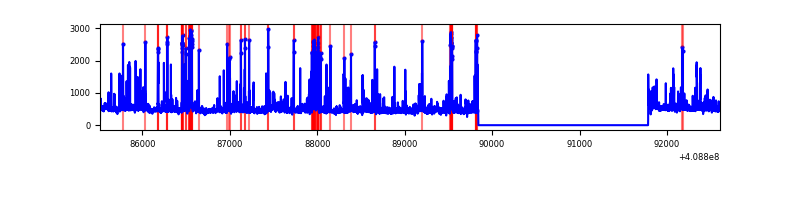 |
Top three noisy pixels from each quadrant. If the there are fewer than three noisy pixels in the level2.evt file, extra rows are filled as -1
| Pixel properties | Quadrant properties | ||||||
|---|---|---|---|---|---|---|---|
| Quadrant | DetID | PixID | Counts | Sigma | Mean | Median | Sigma |
| A | 12 | 227 | 1416952 | 11950.97 | 590 | 579 | 118.5 |
| A | 10 | 83 | 406987 | 3429.16 | 590 | 579 | 118.5 |
| A | 13 | 248 | 36987 | 307.2 | 590 | 579 | 118.5 |
| B | 5 | 172 | 111518 | 997.73 | 591 | 575 | 111.2 |
| B | 15 | 85 | 52069 | 463.1 | 591 | 575 | 111.2 |
| B | 12 | 111 | 13323 | 114.65 | 591 | 575 | 111.2 |
| C | 15 | 214 | 217117 | 1610.32 | 586 | 591 | 134.5 |
| C | 1 | 128 | 14771 | 105.46 | 586 | 591 | 134.5 |
| C | 0 | 10 | 4775 | 31.12 | 586 | 591 | 134.5 |
| D | 12 | 227 | 501784 | 3496.42 | 588 | 572 | 143.4 |
| D | 1 | 47 | 78542 | 543.91 | 588 | 572 | 143.4 |
| D | 12 | 235 | 77101 | 533.86 | 588 | 572 | 143.4 |
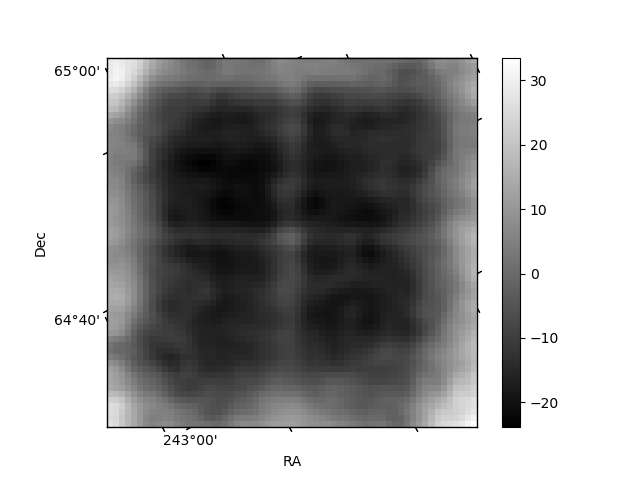
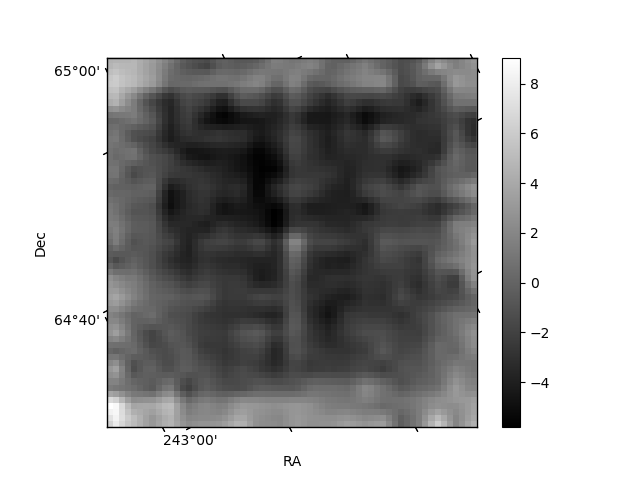
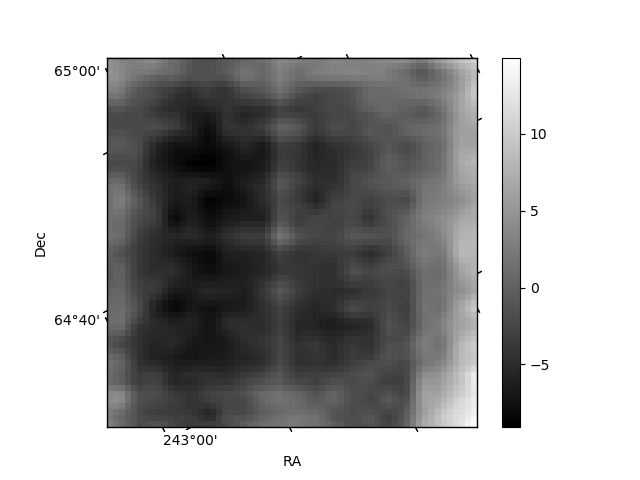
Histogram calculated using DETX and DETY for each event in the final _common_clean file
| Quadrant A | 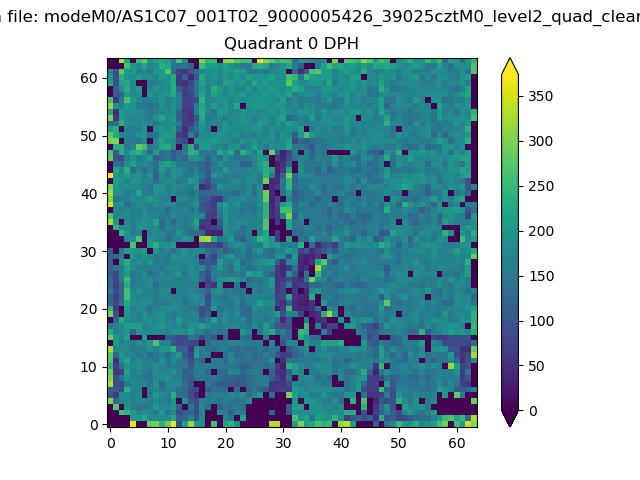 |
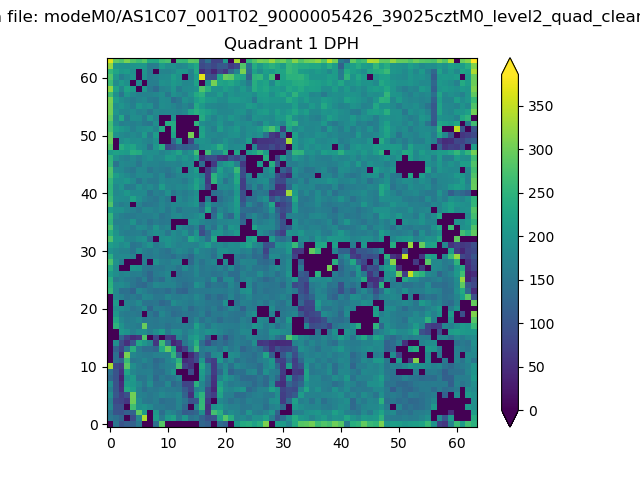 |
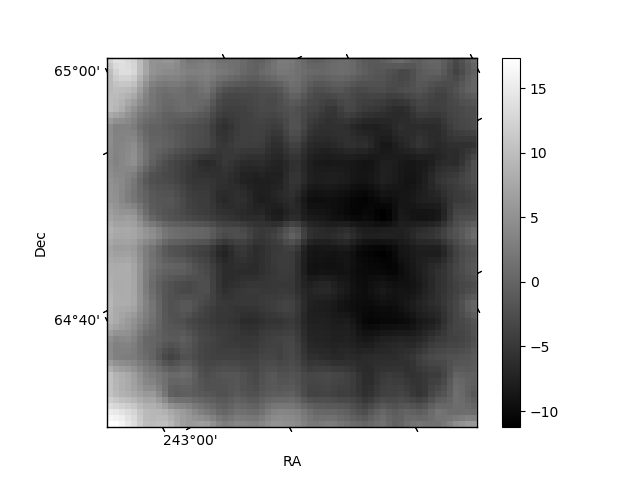
Quadrant B |
|---|---|---|---|
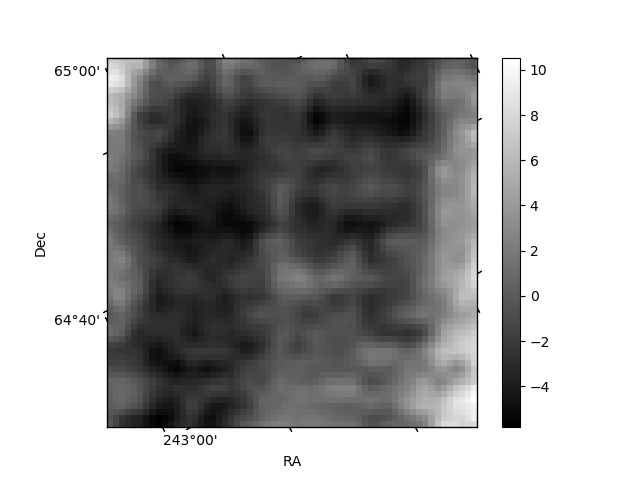
| Quadrant D | 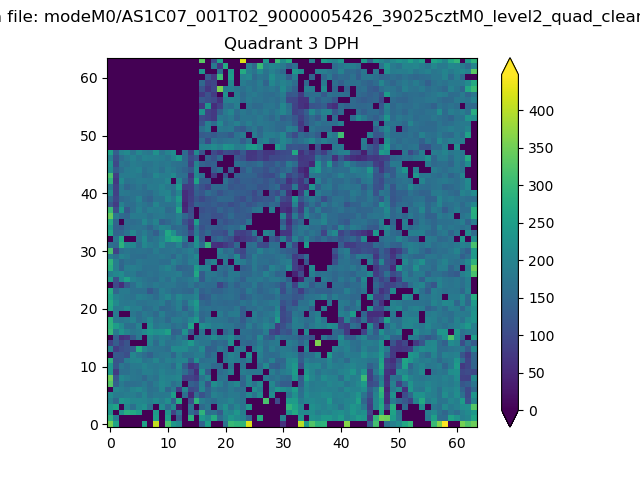 |
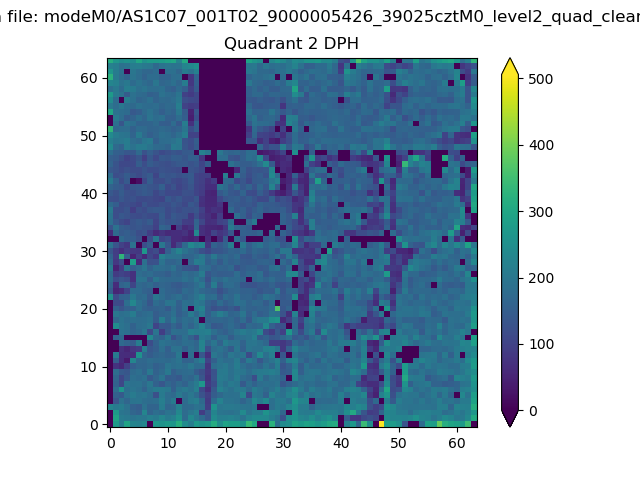 |
Quadrant C |
| Plot type | Count rate plots | Images |
|---|---|---|
| Comparison with Poisson distribution Blue bars denote a histogram of data divided into 1 sec bins. Red curve is a Poisson curve with rate = median count rate of data. |
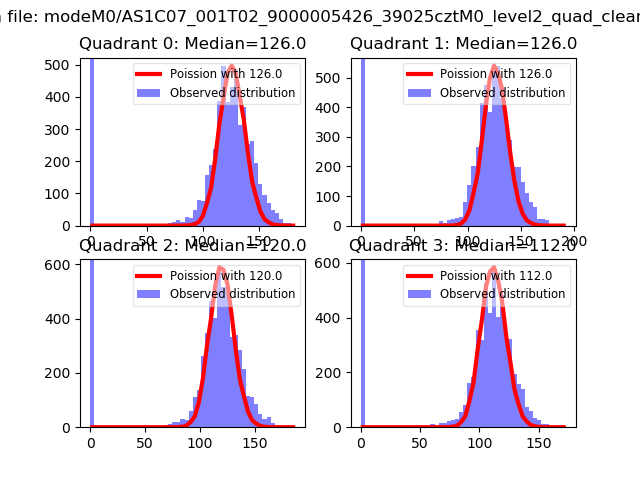 |
 |
| Quadrant-wise count rates Data is divided into 100 sec bins |
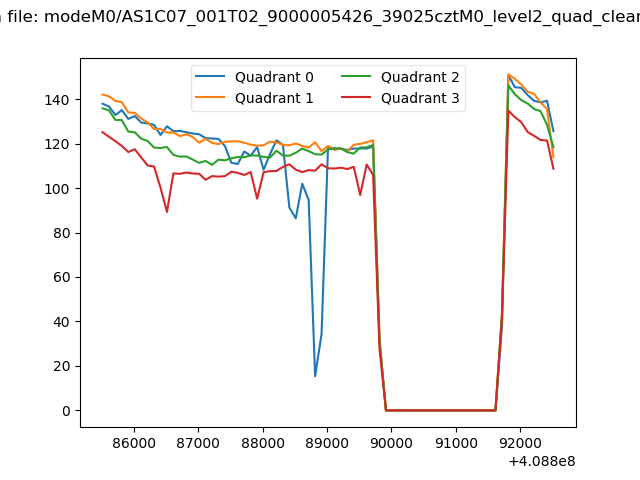 |
|
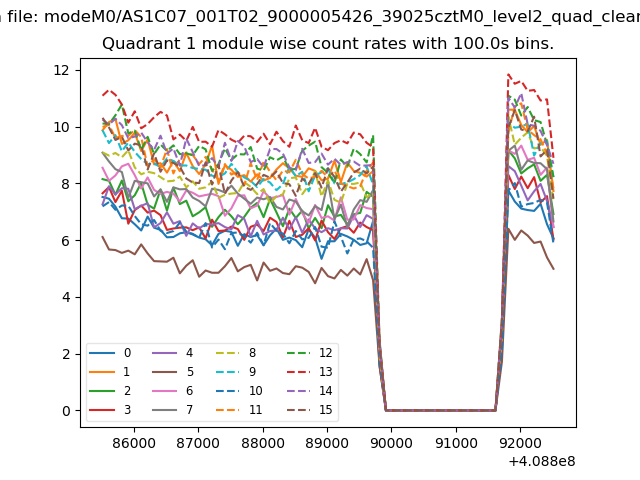
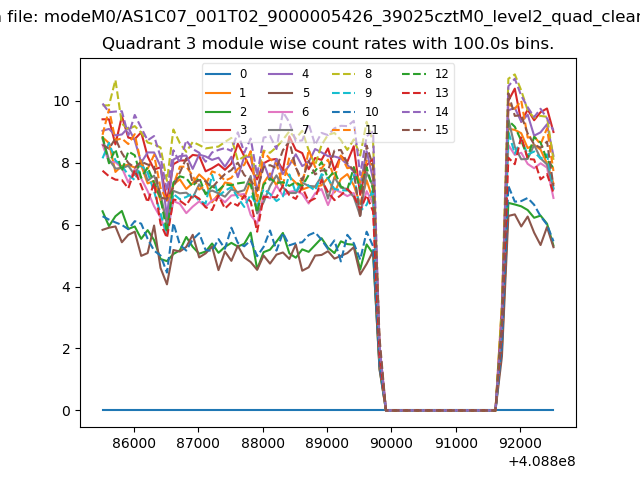
| Module-wise count rates for Quadrant A Data is divided into 100 sec bins |
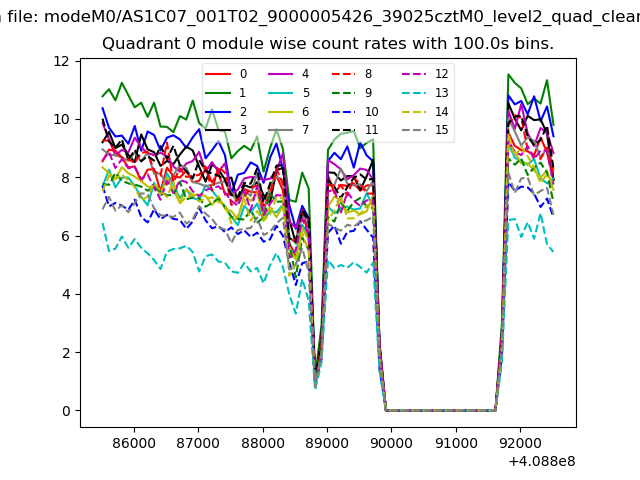 |
 |
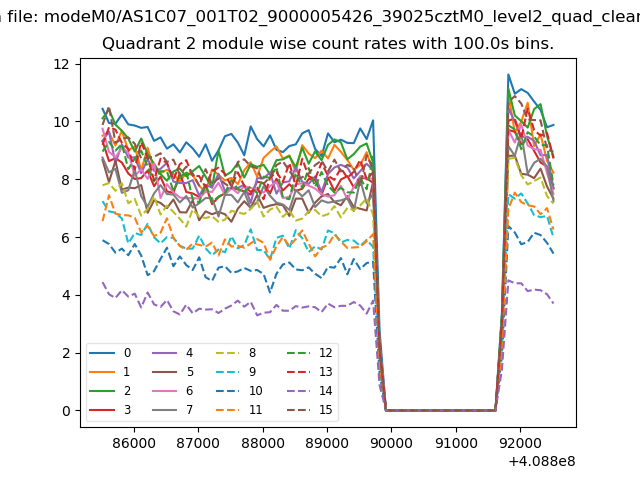
| Module-wise count rates for Quadrant B Data is divided into 100 sec bins |
 |
 |
| Module-wise count rates for Quadrant C Data is divided into 100 sec bins |
 |
 |
| Module-wise count rates for Quadrant D Data is divided into 100 sec bins |
 |
 |
| Parameter | Plot |
|---|---|
| CZT HV Monitor | 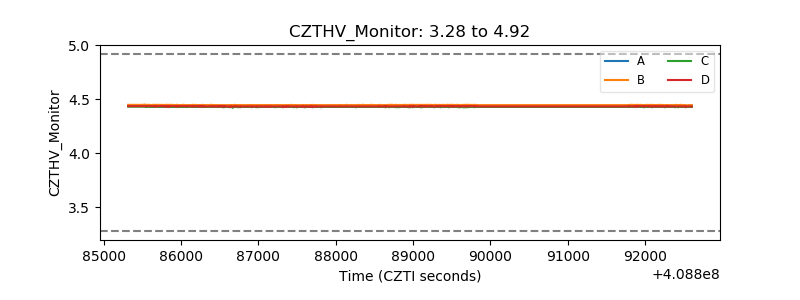 |
| D_VDD | 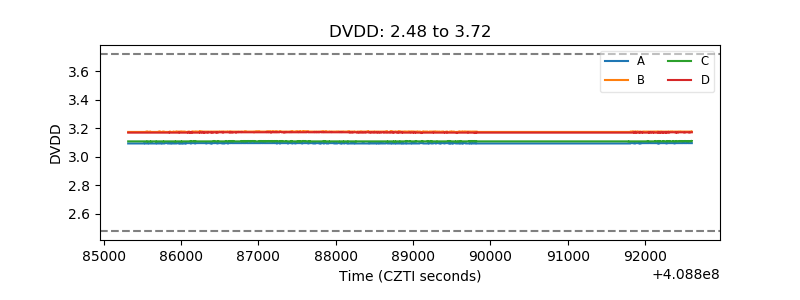 |
| Temperature 1 | 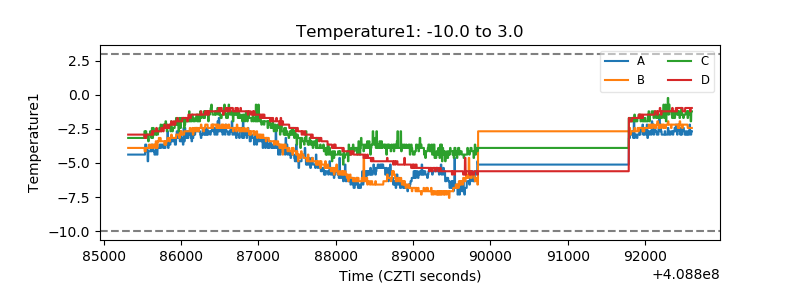 |
| Veto HV Monitor | 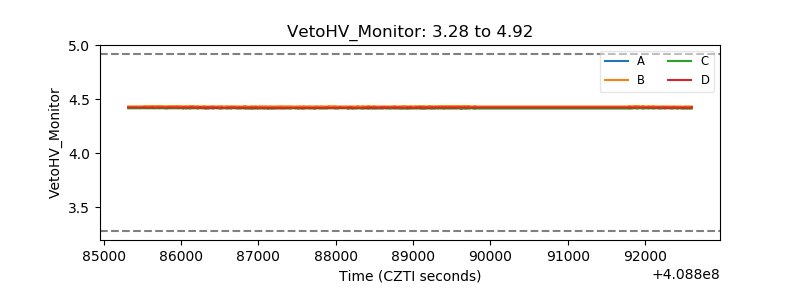 |
| Veto LLD | 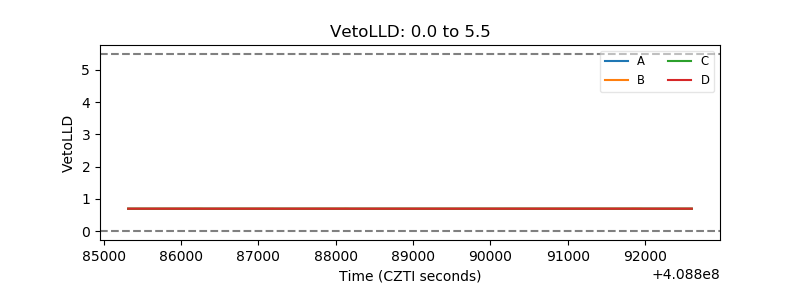 |
| Alpha Counter | 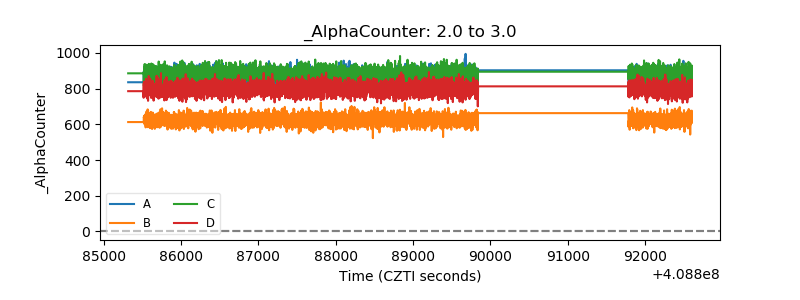 |
| _CPM_Rate | 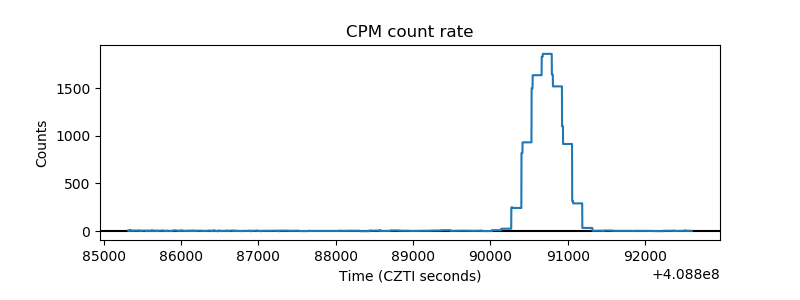 |
| CZT Counter | 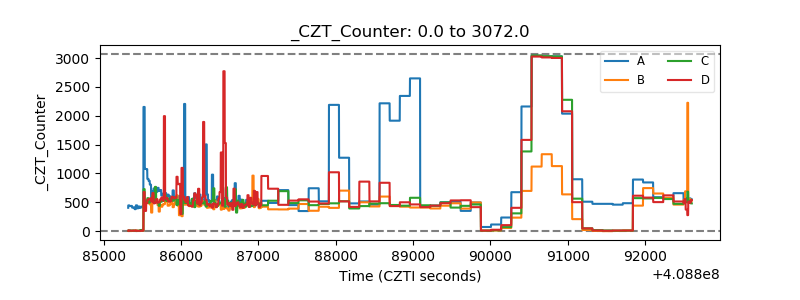 |
| +2.5 Volts monitor | 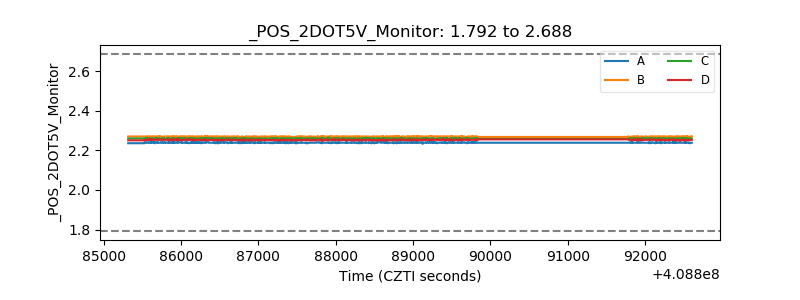 |
| +5 Volts monitor | 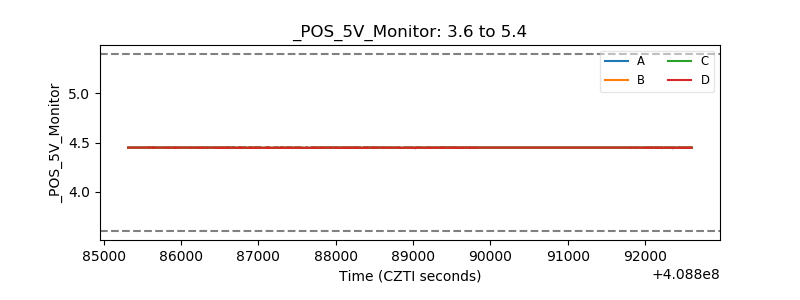 |
| _ROLL_ROT | 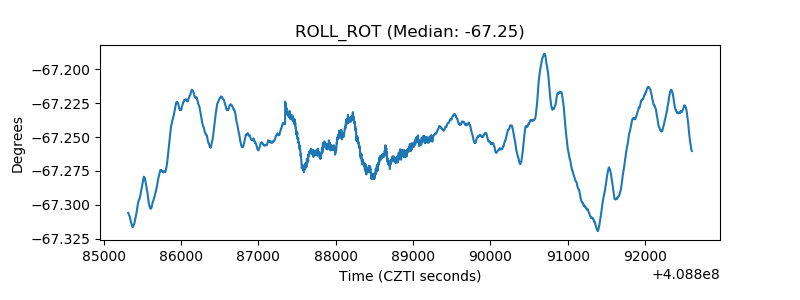 |
| _Roll_DEC | 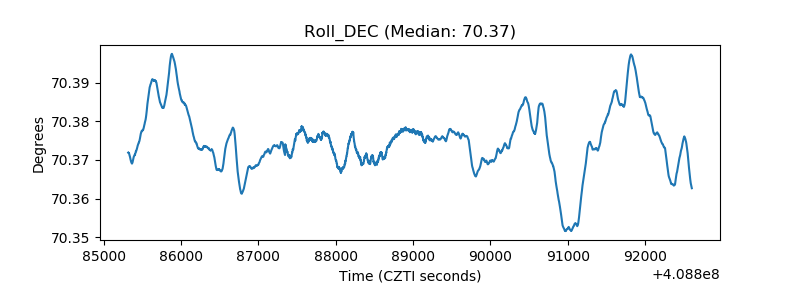 |
| _Roll_RA | 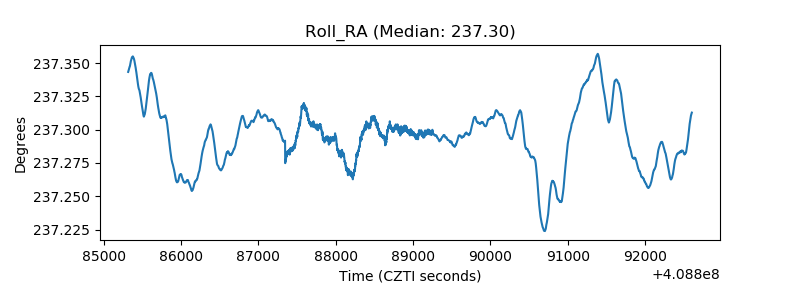 |
| Veto Counter | 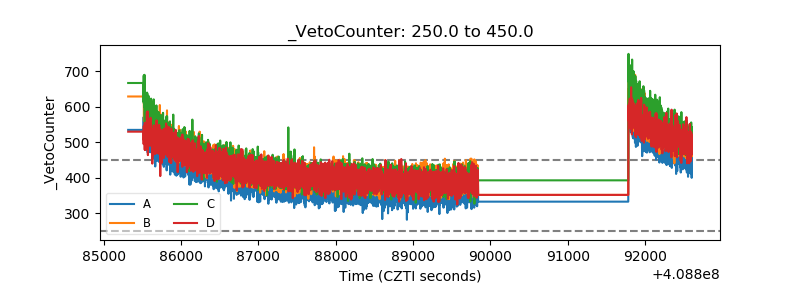 |