| Param | Original file | Final file |
|---|---|---|
| Filename | modeM0/AS1C07_001T02_9000005426_39028cztM0_level2.fits | modeM0/AS1C07_001T02_9000005426_39028cztM0_level2_quad_clean.evt |
| Size (bytes) | 254,543,040 | 74,986,560 |
| Size | 242.8 MB | 71.5 MB |
| Events in quadrant A | 2,958,302 | 479,954 |
| Events in quadrant B | 1,917,093 | 521,007 |
| Events in quadrant C | 2,001,095 | 507,628 |
| Events in quadrant D | 2,221,552 | 470,209 |
| Mode M0 | |||
|---|---|---|---|
| Quadrant | BADHDUFLAG | Total packets | Discarded packets |
| A | 0 | 11432 | 1 |
| B | 0 | 8525 | 1 |
| C | 0 | 8421 | 1 |
| D | 0 | 9393 | 1 |
| Mode M9 | |||
|---|---|---|---|
| Quadrant | BADHDUFLAG | Total packets | Discarded packets |
| A | 0 | 22 | 0 |
| B | 0 | 22 | 0 |
| C | 0 | 22 | 0 |
| D | 0 | 23 | 0 |
| Mode SS | |||
|---|---|---|---|
| Quadrant | BADHDUFLAG | Total packets | Discarded packets |
| A | 0 | 84 | 0 |
| B | 0 | 84 | 0 |
| C | 0 | 84 | 0 |
| D | 0 | 84 | 0 |
| Quadrant | Total seconds | Saturated seconds | Saturation percentage |
|---|---|---|---|
| A | 4148 | 321 | 7.738669% |
| B | 4148 | 16 | 0.385728% |
| C | 4148 | 4 | 0.096432% |
| D | 4148 | 15 | 0.361620% |
Noise dominated data is calculated using 1-second bins in cleaned event files. If a bin has >2000 counts, and if more than 50% of those come from <1% of pixels, then it is considered to be noise-dominated and hence unusable.
| Quadrant | # 1 sec bins | Bins with >0 counts | Bins with >2000 counts | High rate bins dominated by noise | Noise dominated (total time) | Noise dominated (detector-on time) | Marked lightcurve |
|---|---|---|---|---|---|---|---|
| A | 4148 | 4148 | 305 | 305 | 7.35% | 7.35% | 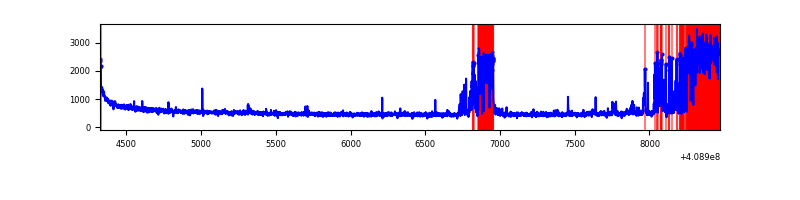 |
| B | 4148 | 4148 | 7 | 7 | 0.17% | 0.17% | 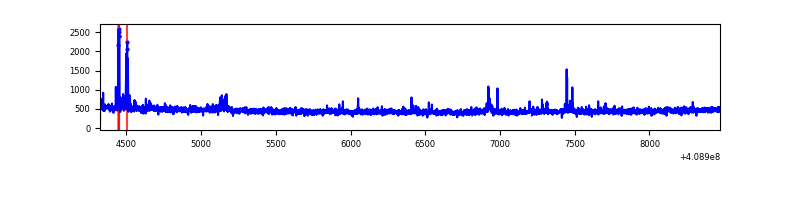 |
| C | 4148 | 4148 | 0 | 0 | 0.00% | 0.00% | 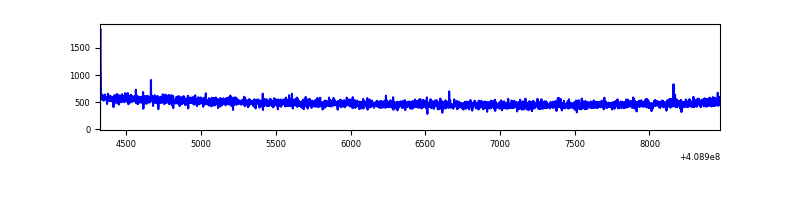 |
| D | 4148 | 4148 | 17 | 17 | 0.41% | 0.41% | 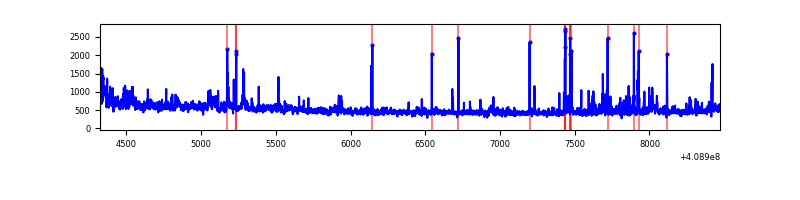 |
Top three noisy pixels from each quadrant. If the there are fewer than three noisy pixels in the level2.evt file, extra rows are filled as -1
| Pixel properties | Quadrant properties | ||||||
|---|---|---|---|---|---|---|---|
| Quadrant | DetID | PixID | Counts | Sigma | Mean | Median | Sigma |
| A | 15 | 222 | 693495 | 7721.1 | 443 | 433 | 89.8 |
| A | 13 | 248 | 273134 | 3038.04 | 443 | 433 | 89.8 |
| A | 10 | 83 | 269989 | 3003.0 | 443 | 433 | 89.8 |
| B | 15 | 85 | 39874 | 449.1 | 464 | 452 | 87.8 |
| B | 5 | 172 | 21917 | 244.53 | 464 | 452 | 87.8 |
| B | 5 | 184 | 13779 | 151.82 | 464 | 452 | 87.8 |
| C | 15 | 214 | 171915 | 1592.9 | 464 | 468 | 107.6 |
| C | 1 | 128 | 6330 | 54.46 | 464 | 468 | 107.6 |
| C | 0 | 10 | 4755 | 39.83 | 464 | 468 | 107.6 |
| D | 12 | 227 | 201900 | 1822.41 | 460 | 450 | 110.5 |
| D | 12 | 235 | 150429 | 1356.78 | 460 | 450 | 110.5 |
| D | 1 | 47 | 30673 | 273.41 | 460 | 450 | 110.5 |
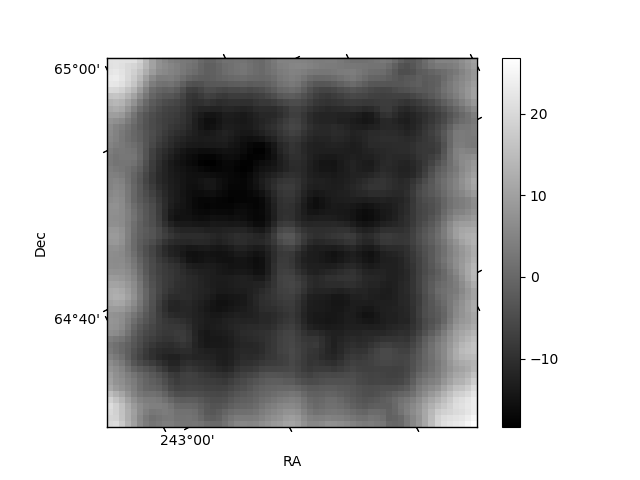
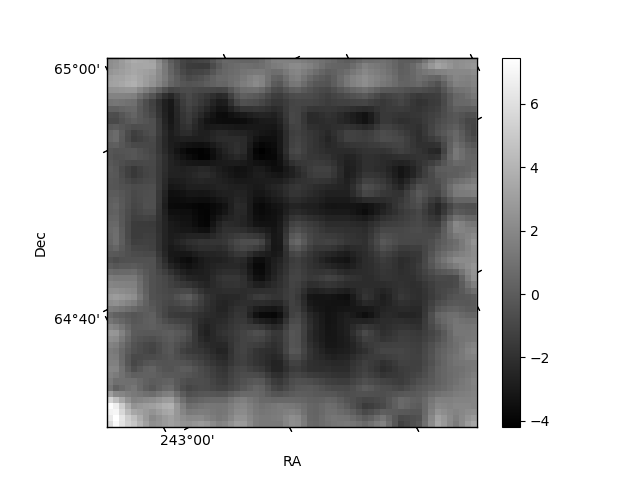
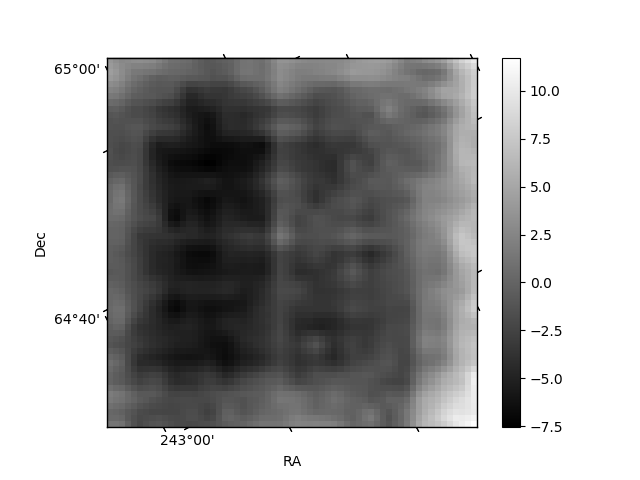
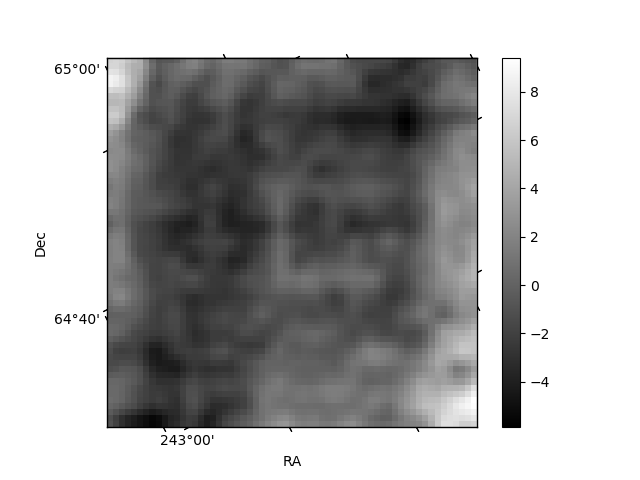
Histogram calculated using DETX and DETY for each event in the final _common_clean file
| Quadrant A | 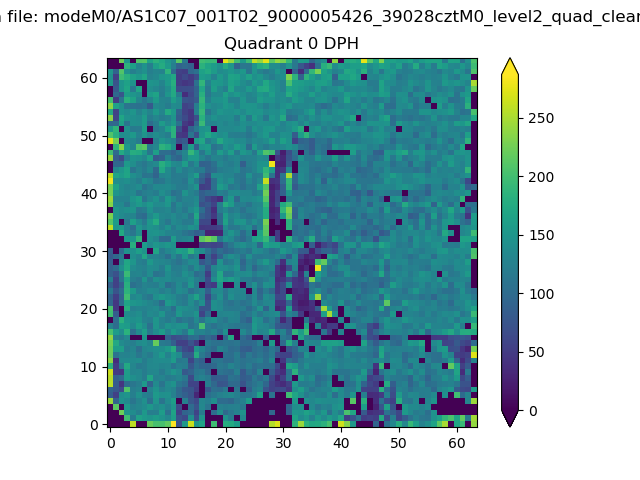 |
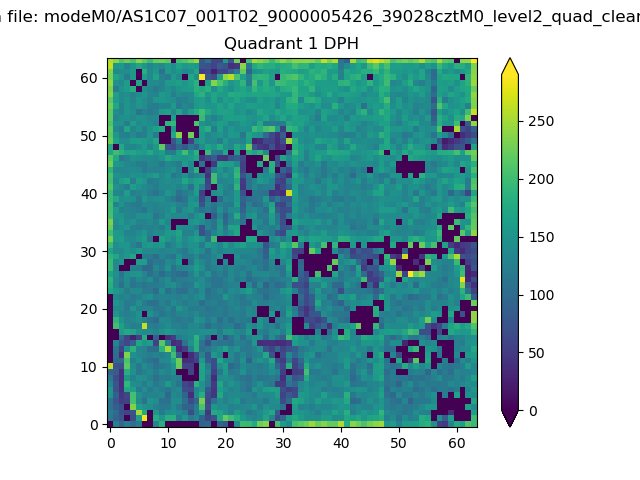 |
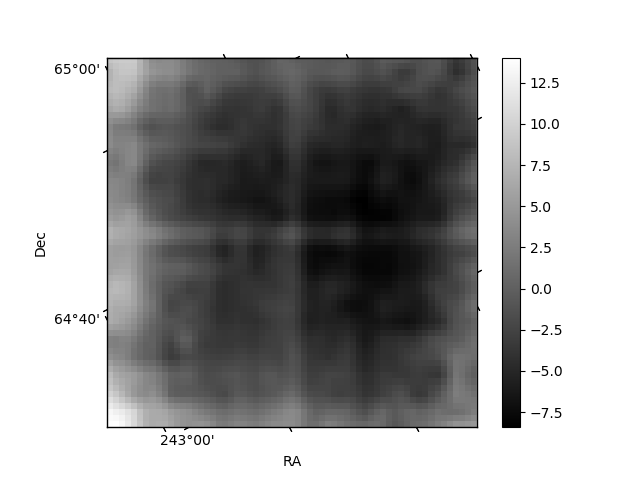
Quadrant B |
|---|---|---|---|
| Quadrant D | 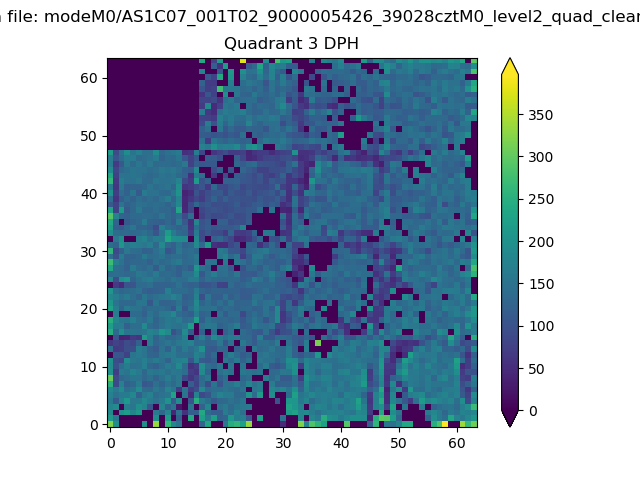 |
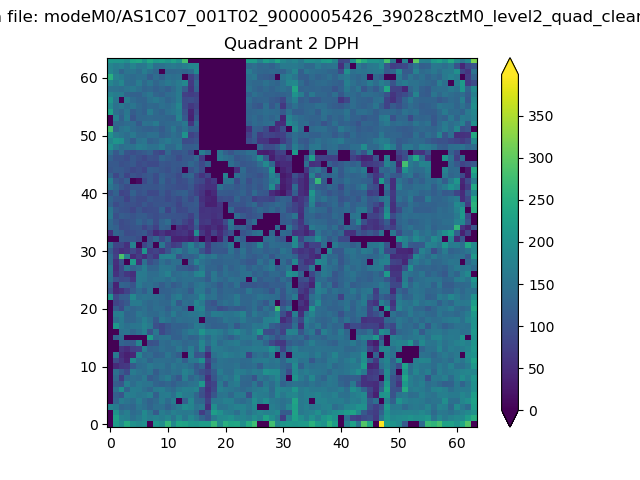 |
Quadrant C |
| Plot type | Count rate plots | Images |
|---|---|---|
| Comparison with Poisson distribution Blue bars denote a histogram of data divided into 1 sec bins. Red curve is a Poisson curve with rate = median count rate of data. |
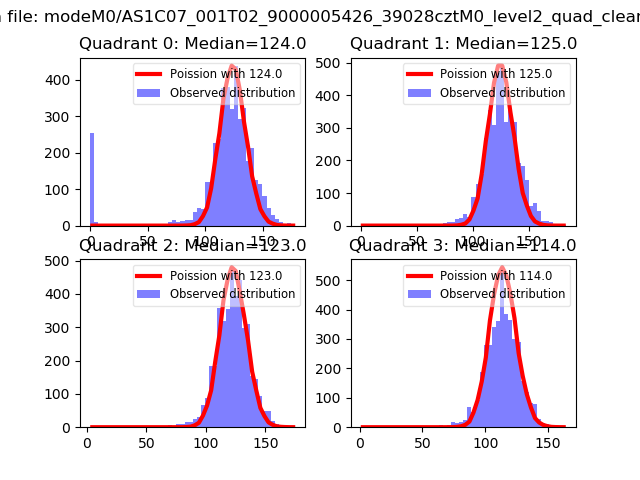 |
 |
| Quadrant-wise count rates Data is divided into 100 sec bins |
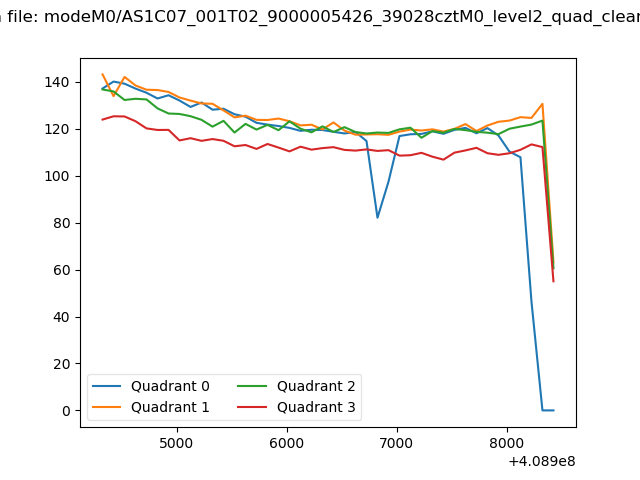 |
|
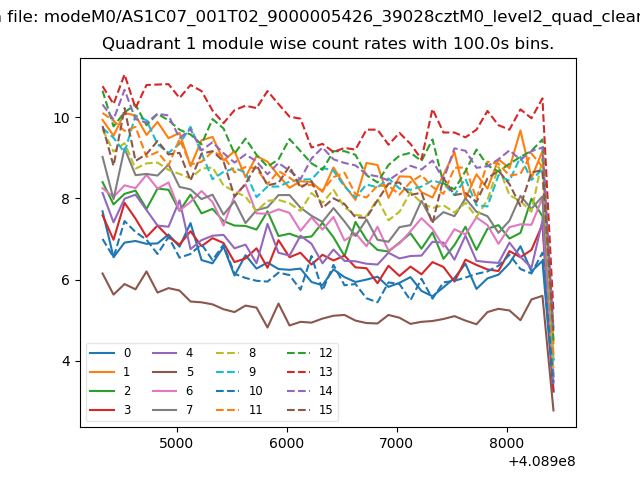
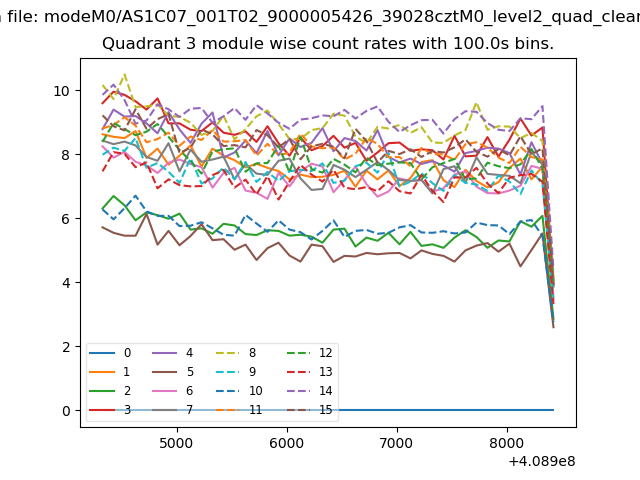
| Module-wise count rates for Quadrant A Data is divided into 100 sec bins |
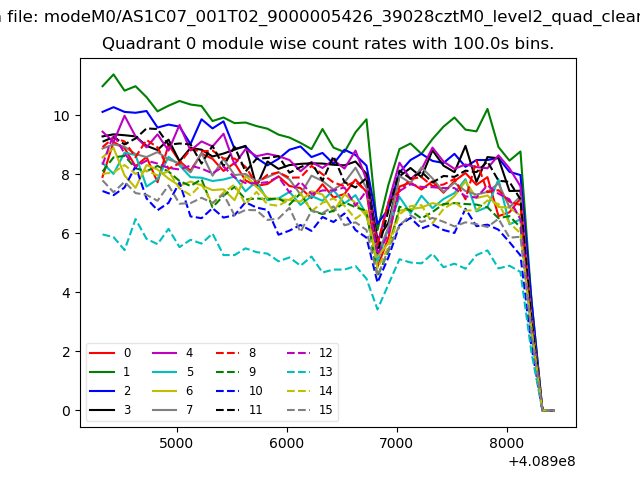 |
 |
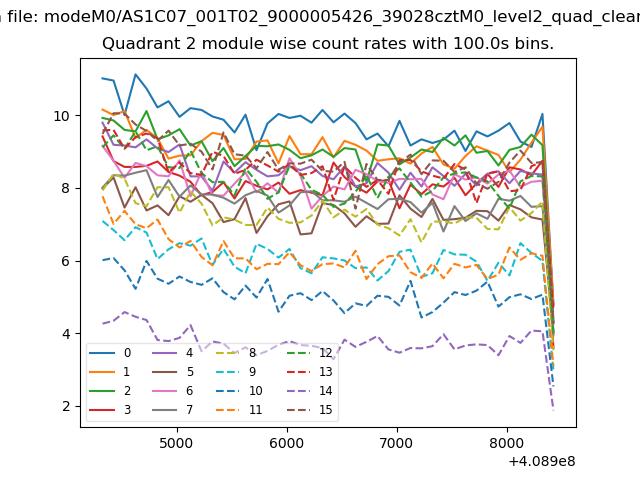
| Module-wise count rates for Quadrant B Data is divided into 100 sec bins |
 |
 |
| Module-wise count rates for Quadrant C Data is divided into 100 sec bins |
 |
 |
| Module-wise count rates for Quadrant D Data is divided into 100 sec bins |
 |
 |
| Parameter | Plot |
|---|---|
| CZT HV Monitor |  |
| D_VDD | 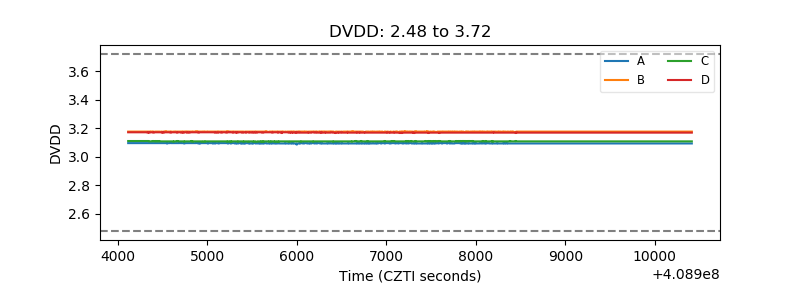 |
| Temperature 1 | 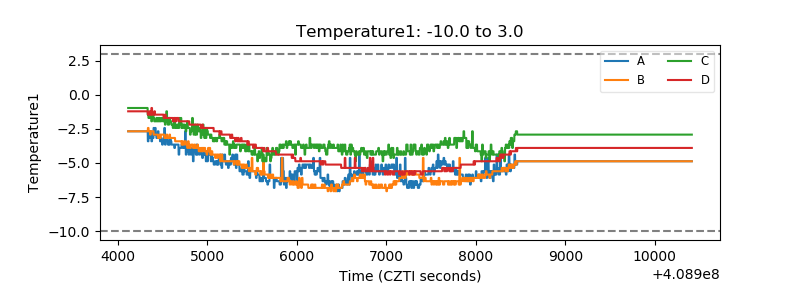 |
| Veto HV Monitor | 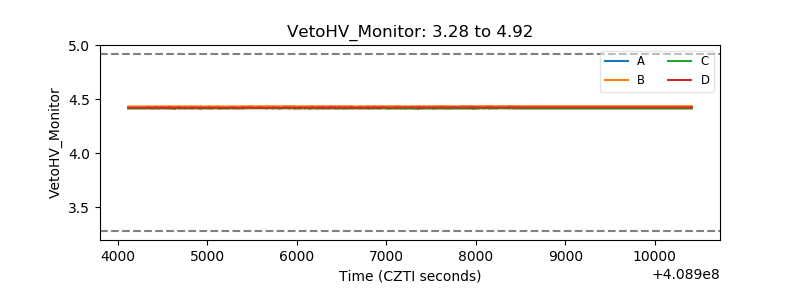 |
| Veto LLD | 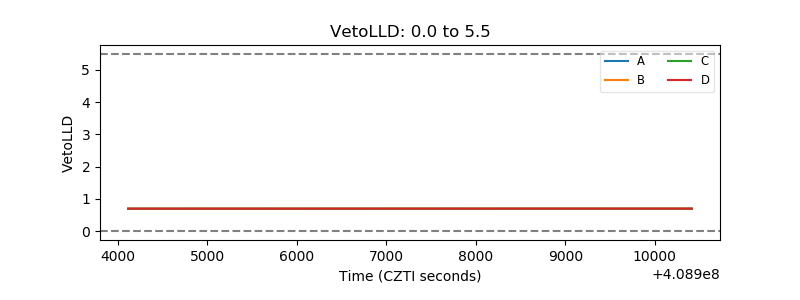 |
| Alpha Counter | 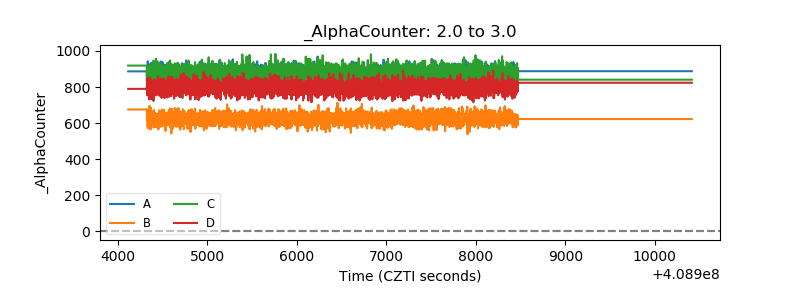 |
| _CPM_Rate | 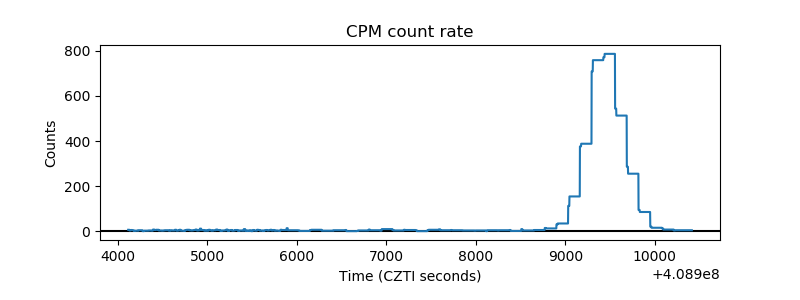 |
| CZT Counter | 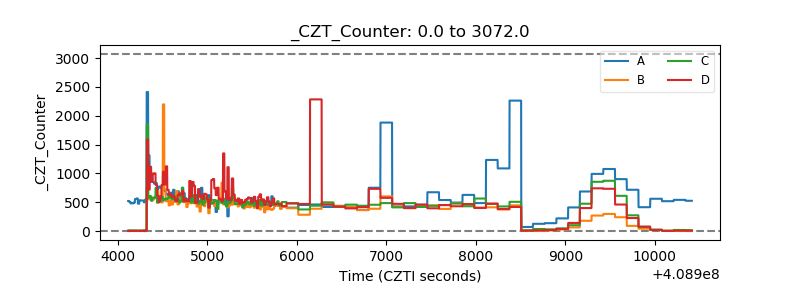 |
| +2.5 Volts monitor | 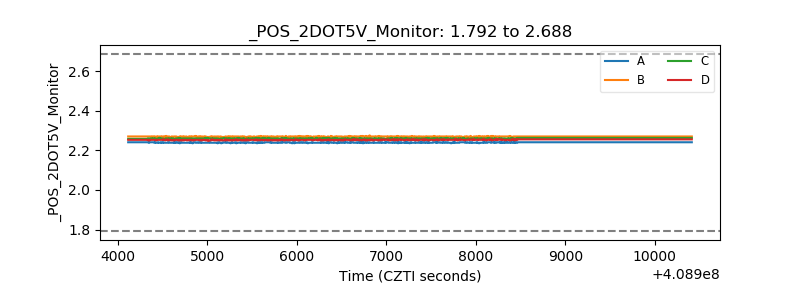 |
| +5 Volts monitor |  |
| _ROLL_ROT | 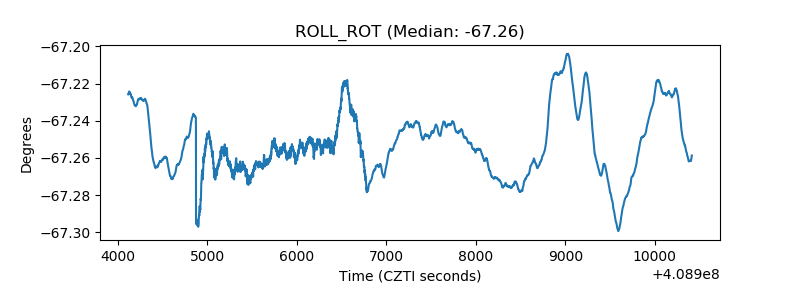 |
| _Roll_DEC | 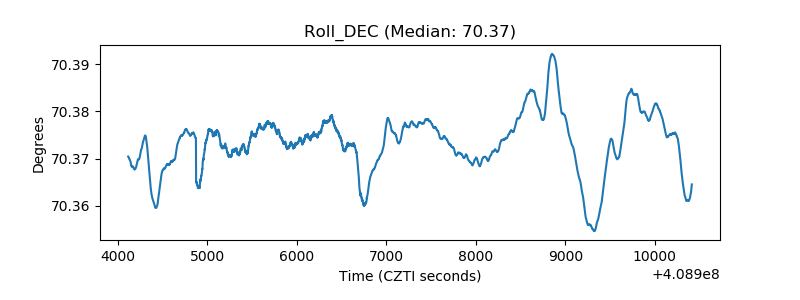 |
| _Roll_RA | 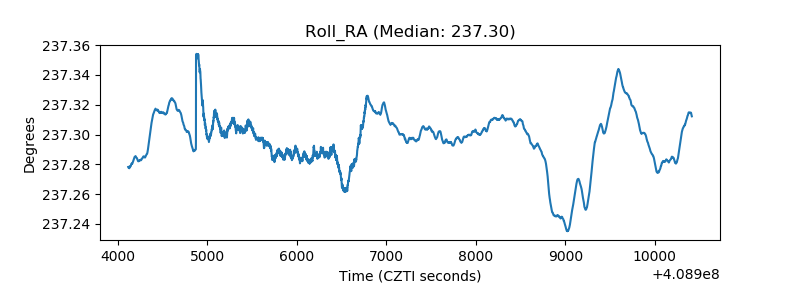 |
| Veto Counter | 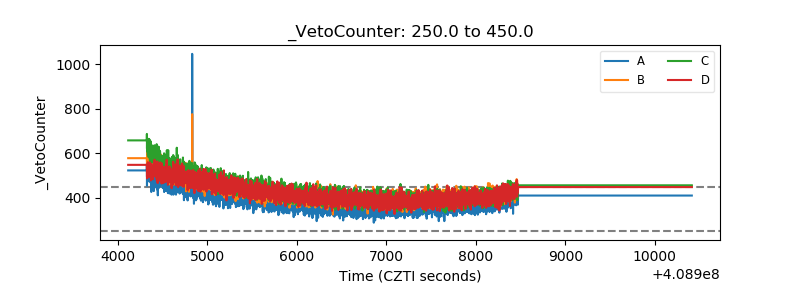 |