| Param | Original file | Final file |
|---|---|---|
| Filename | modeM0/AS1A12_077T06_9000005430_39035cztM0_level2.fits | modeM0/AS1A12_077T06_9000005430_39035cztM0_level2_quad_clean.evt |
| Size (bytes) | 86,869,440 | 21,582,720 |
| Size | 82.8 MB | 20.6 MB |
| Events in quadrant A | 1,269,319 | 138,205 |
| Events in quadrant B | 615,248 | 146,885 |
| Events in quadrant C | 639,040 | 141,100 |
| Events in quadrant D | 588,831 | 130,709 |
| Mode M9 | |||
|---|---|---|---|
| Quadrant | BADHDUFLAG | Total packets | Discarded packets |
| A | 0 | 15 | 0 |
| B | 0 | 15 | 0 |
| C | 0 | 15 | 0 |
| D | 0 | 15 | 0 |
| Mode M0 | |||
|---|---|---|---|
| Quadrant | BADHDUFLAG | Total packets | Discarded packets |
| A | 0 | 4762 | 2 |
| B | 0 | 2691 | 1 |
| C | 0 | 2681 | 1 |
| D | 0 | 2656 | 1 |
| Mode SS | |||
|---|---|---|---|
| Quadrant | BADHDUFLAG | Total packets | Discarded packets |
| A | 0 | 28 | 0 |
| B | 0 | 28 | 0 |
| C | 0 | 28 | 0 |
| D | 0 | 28 | 0 |
| Quadrant | Total seconds | Saturated seconds | Saturation percentage |
|---|---|---|---|
| A | 1290 | 64 | 4.961240% |
| B | 1290 | 3 | 0.232558% |
| C | 1290 | 2 | 0.155039% |
| D | 1290 | 2 | 0.155039% |
Noise dominated data is calculated using 1-second bins in cleaned event files. If a bin has >2000 counts, and if more than 50% of those come from <1% of pixels, then it is considered to be noise-dominated and hence unusable.
| Quadrant | # 1 sec bins | Bins with >0 counts | Bins with >2000 counts | High rate bins dominated by noise | Noise dominated (total time) | Noise dominated (detector-on time) | Marked lightcurve |
|---|---|---|---|---|---|---|---|
| A | 2784 | 1291 | 51 | 51 | 1.83% | 3.95% | 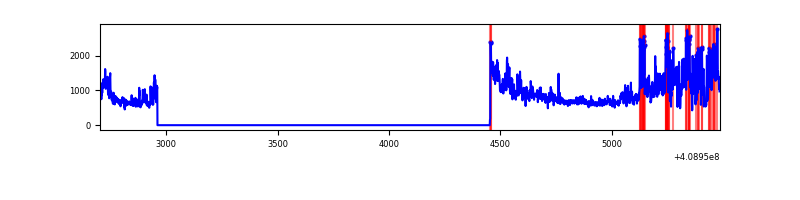 |
| B | 2784 | 1291 | 1 | 1 | 0.04% | 0.08% | 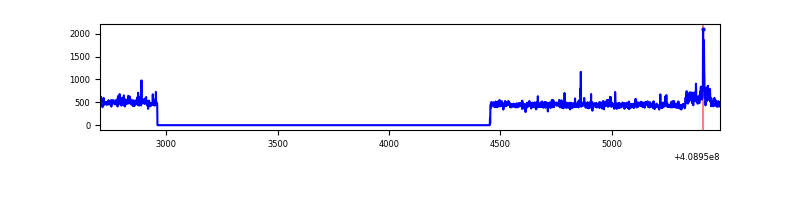 |
| C | 2784 | 1291 | 0 | 0 | 0.00% | 0.00% | 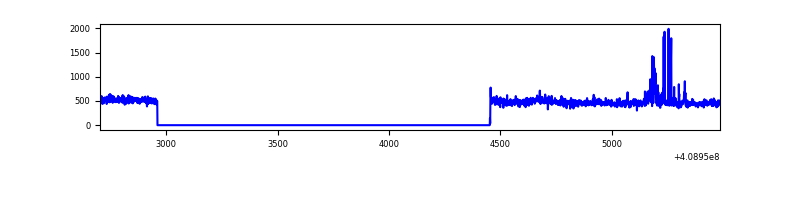 |
| D | 2784 | 1291 | 1 | 1 | 0.04% | 0.08% | 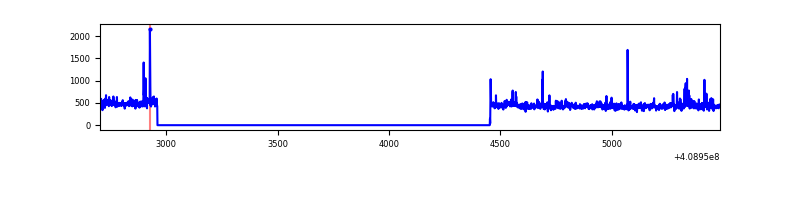 |
Top three noisy pixels from each quadrant. If the there are fewer than three noisy pixels in the level2.evt file, extra rows are filled as -1
| Pixel properties | Quadrant properties | ||||||
|---|---|---|---|---|---|---|---|
| Quadrant | DetID | PixID | Counts | Sigma | Mean | Median | Sigma |
| A | 15 | 222 | 562299 | 18480.99 | 142 | 139 | 30.4 |
| A | 10 | 83 | 141137 | 4635.3 | 142 | 139 | 30.4 |
| A | 9 | 143 | 11830 | 384.34 | 142 | 139 | 30.4 |
| B | 5 | 184 | 34217 | 1133.73 | 142 | 138 | 30.1 |
| B | 0 | 230 | 7712 | 251.97 | 142 | 138 | 30.1 |
| B | 0 | 190 | 7163 | 233.71 | 142 | 138 | 30.1 |
| C | 15 | 214 | 59183 | 1700.67 | 139 | 139 | 34.7 |
| C | 15 | 208 | 31777 | 911.29 | 139 | 139 | 34.7 |
| C | 9 | 54 | 2101 | 56.51 | 139 | 139 | 34.7 |
| D | 1 | 47 | 17236 | 486.04 | 138 | 134 | 35.2 |
| D | 12 | 235 | 8423 | 235.57 | 138 | 134 | 35.2 |
| D | 2 | 249 | 7770 | 217.01 | 138 | 134 | 35.2 |
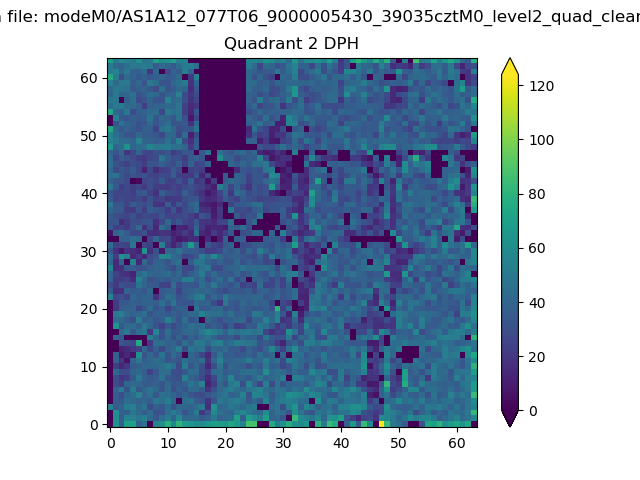
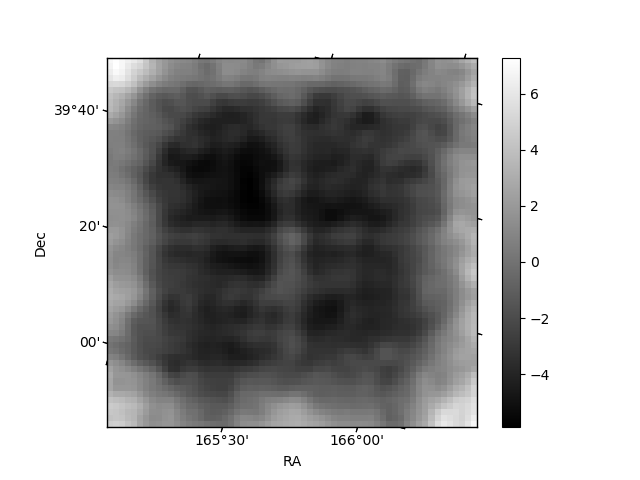
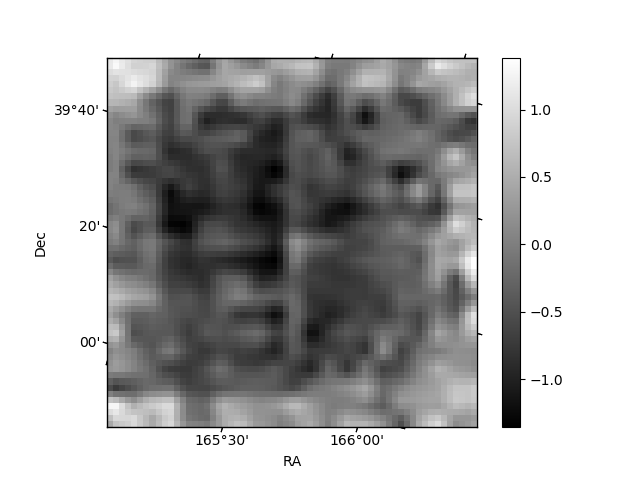
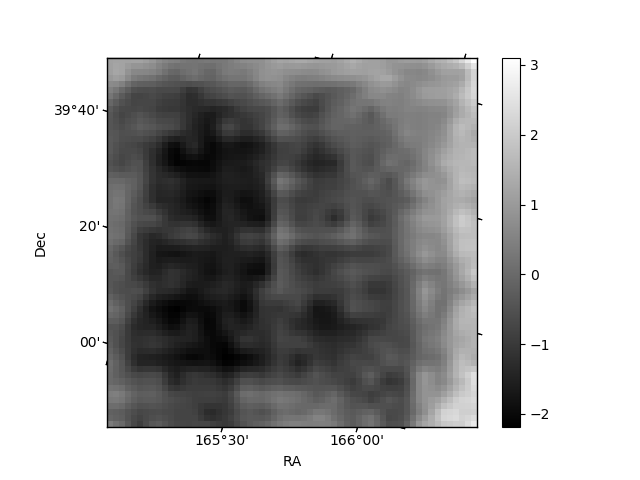
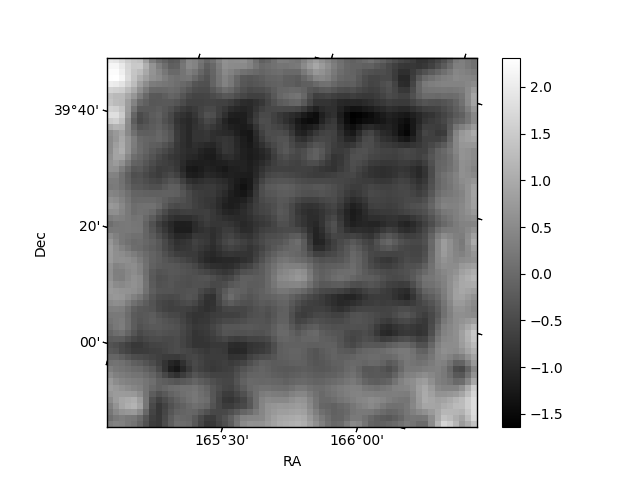
Histogram calculated using DETX and DETY for each event in the final _common_clean file
| Quadrant A | 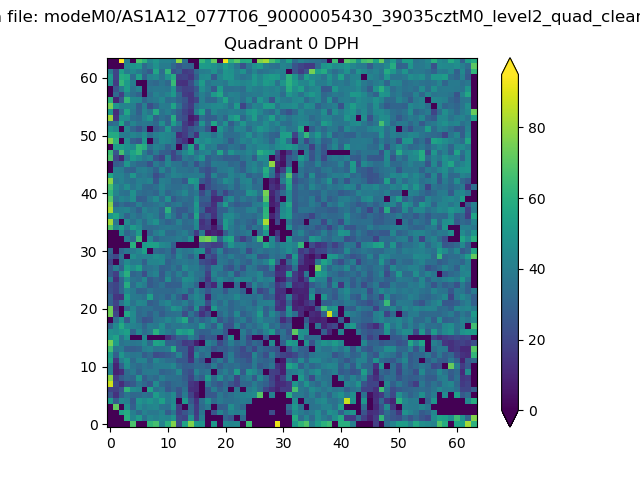 |
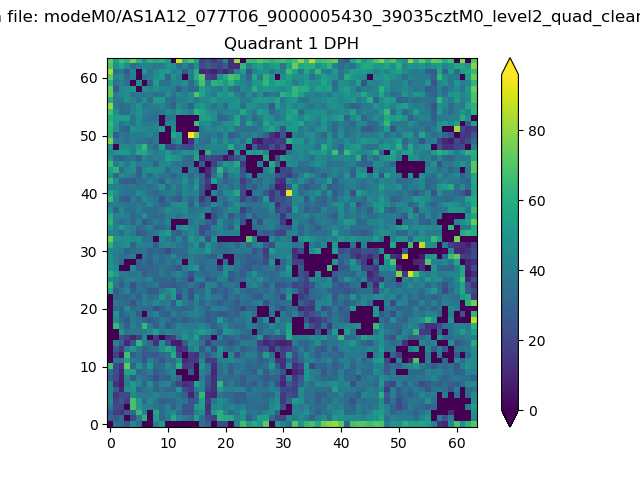 |
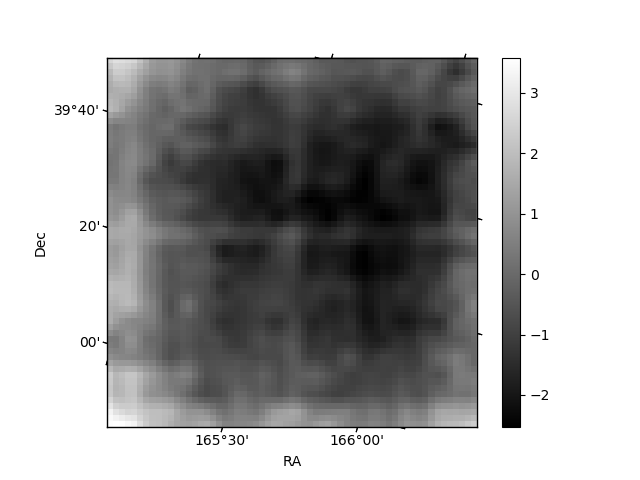
Quadrant B |
|---|---|---|---|
| Quadrant D | 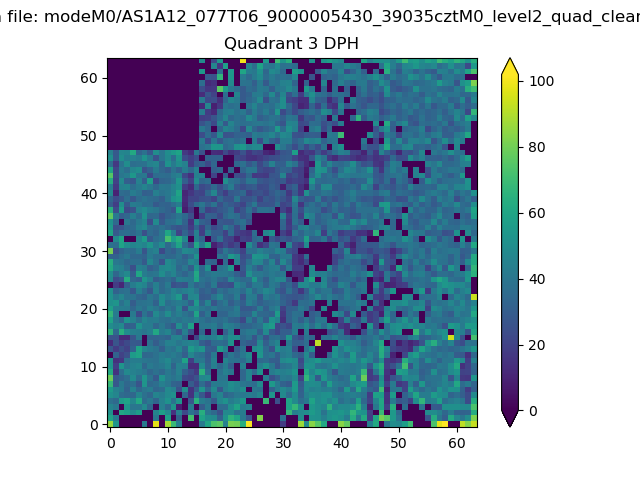 |
 |
Quadrant C |
| Plot type | Count rate plots | Images |
|---|---|---|
| Comparison with Poisson distribution Blue bars denote a histogram of data divided into 1 sec bins. Red curve is a Poisson curve with rate = median count rate of data. |
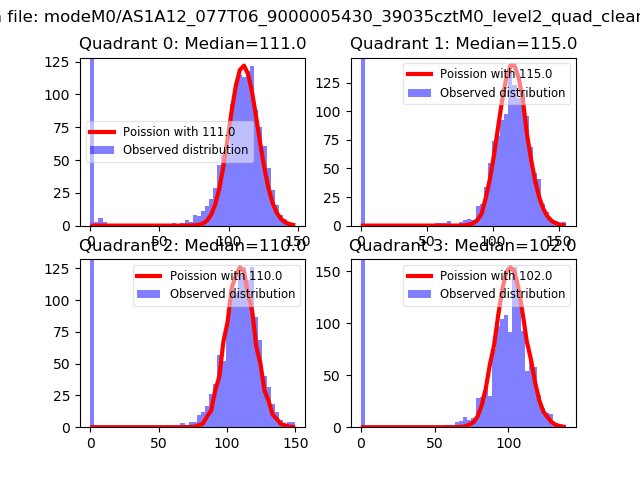 |
 |
| Quadrant-wise count rates Data is divided into 100 sec bins |
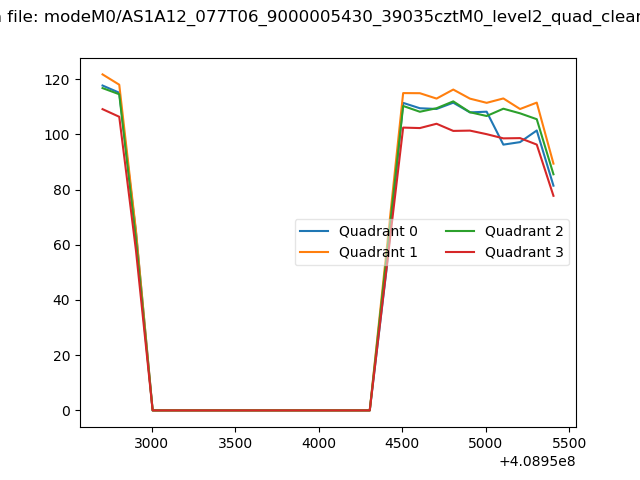 |
|
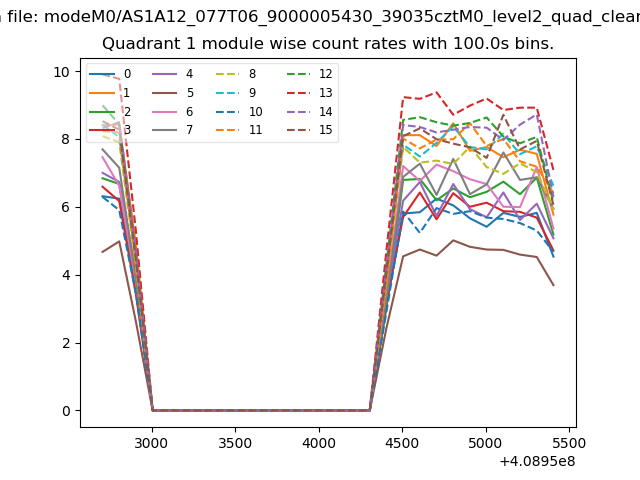
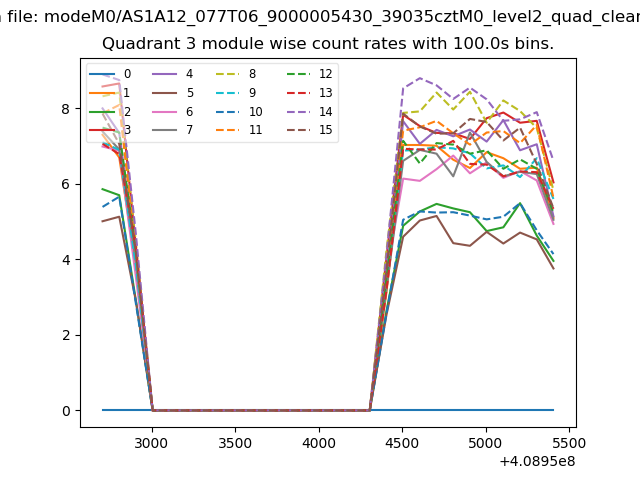
| Module-wise count rates for Quadrant A Data is divided into 100 sec bins |
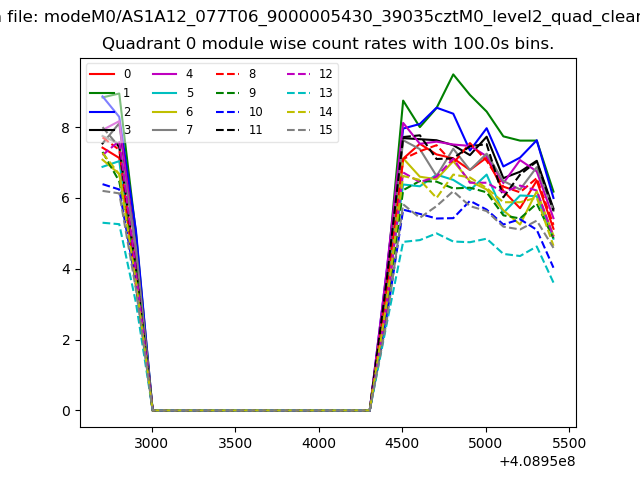 |
 |
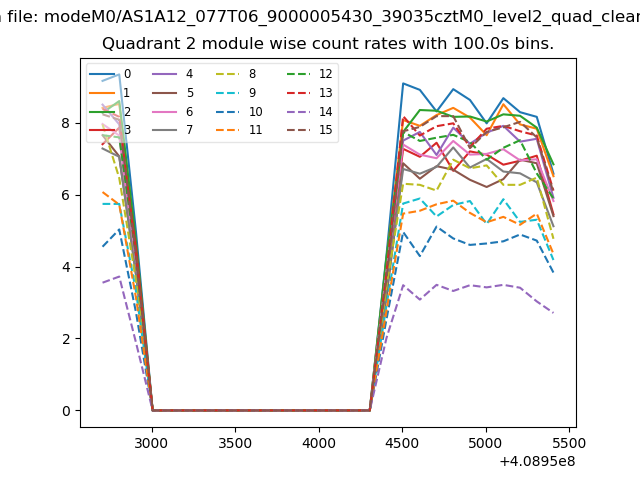
| Module-wise count rates for Quadrant B Data is divided into 100 sec bins |
 |
 |
| Module-wise count rates for Quadrant C Data is divided into 100 sec bins |
 |
 |
| Module-wise count rates for Quadrant D Data is divided into 100 sec bins |
 |
 |
| Parameter | Plot |
|---|---|
| CZT HV Monitor | 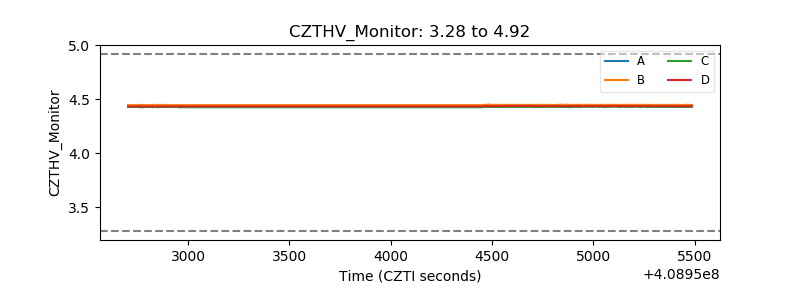 |
| D_VDD | 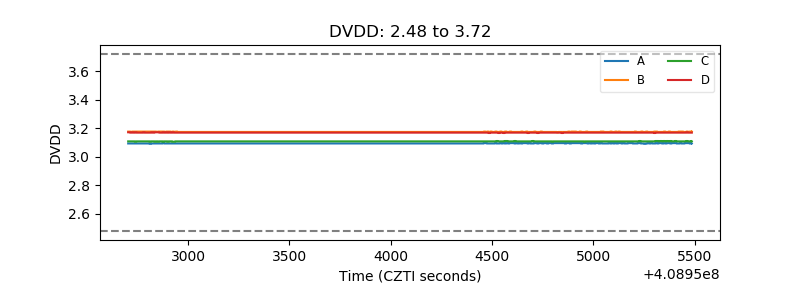 |
| Temperature 1 | 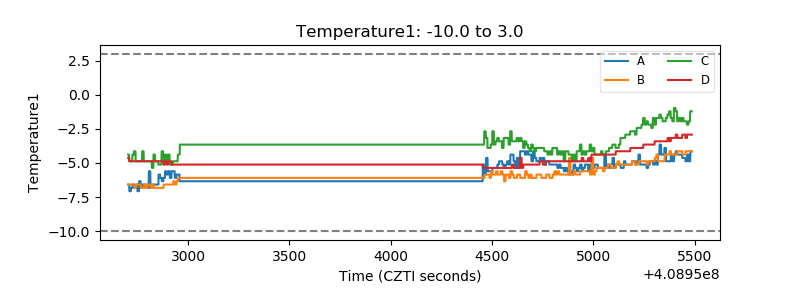 |
| Veto HV Monitor | 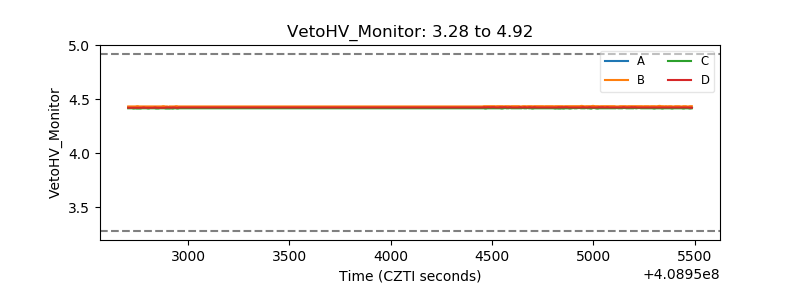 |
| Veto LLD | 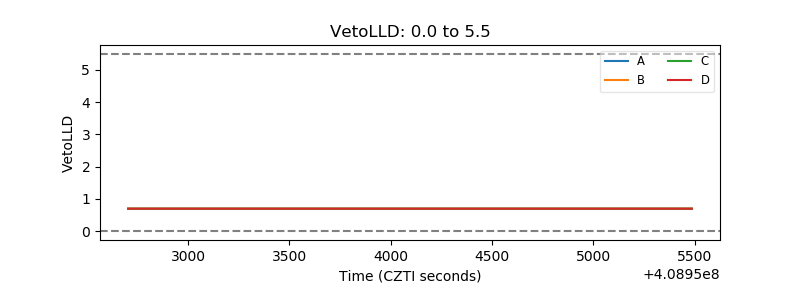 |
| Alpha Counter | 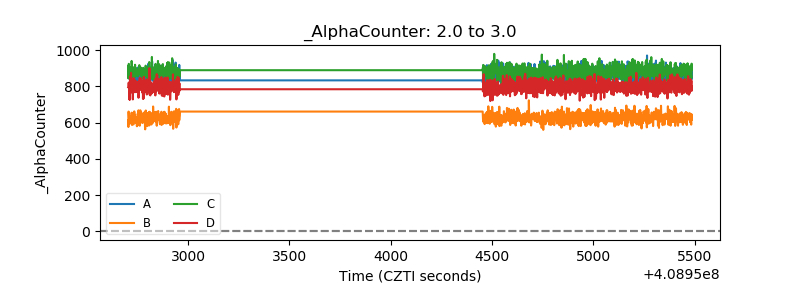 |
| _CPM_Rate | 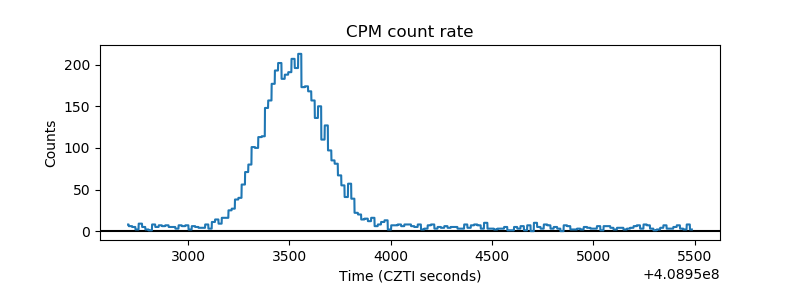 |
| CZT Counter | 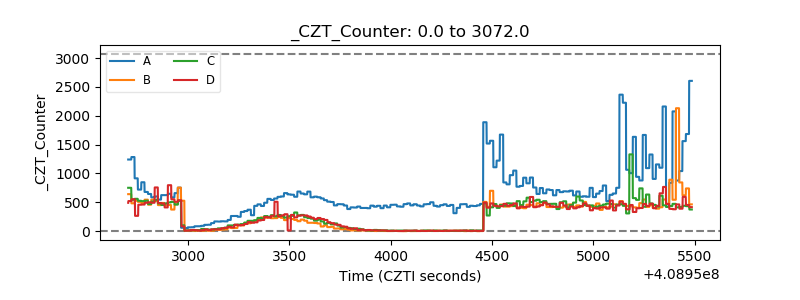 |
| +2.5 Volts monitor | 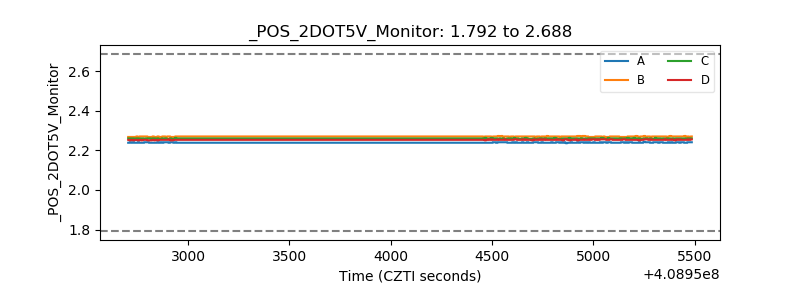 |
| +5 Volts monitor | 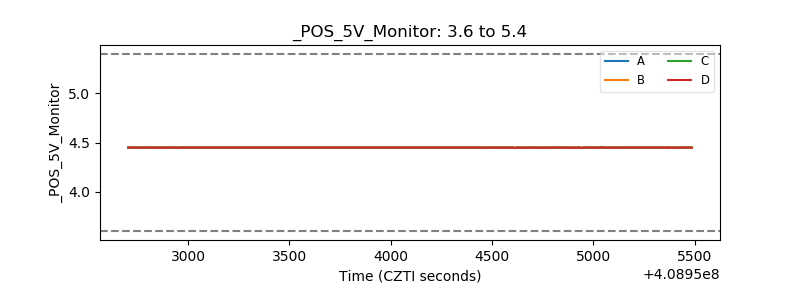 |
| _ROLL_ROT | 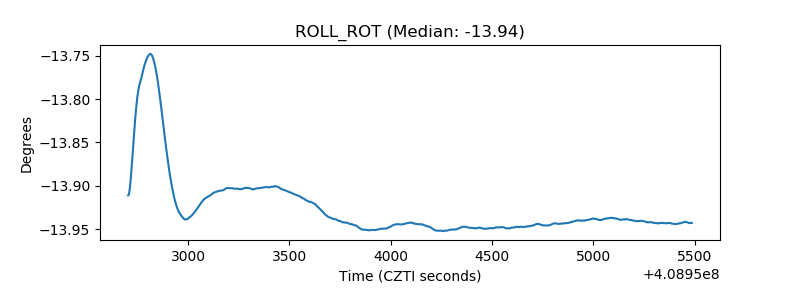 |
| _Roll_DEC | 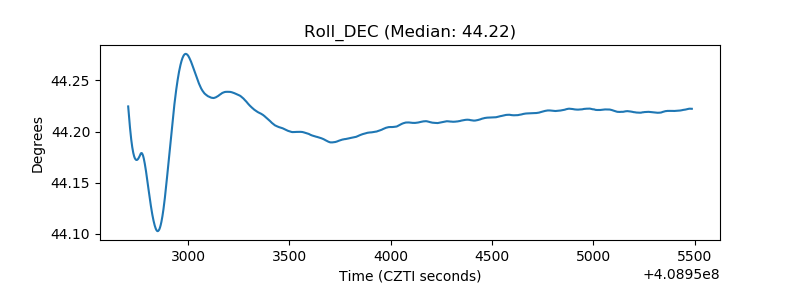 |
| _Roll_RA | 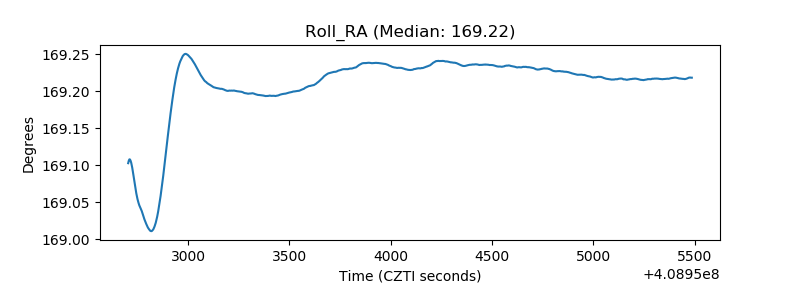 |
| Veto Counter | 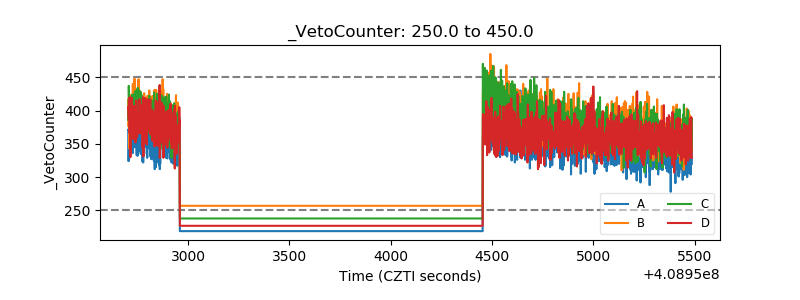 |