| Param | Original file | Final file |
|---|---|---|
| Filename | modeM0/AS1A12_077T06_9000005430_39040cztM0_level2.fits | modeM0/AS1A12_077T06_9000005430_39040cztM0_level2_quad_clean.evt |
| Size (bytes) | 441,912,960 | 99,653,760 |
| Size | 421.4 MB | 95.0 MB |
| Events in quadrant A | 7,497,934 | 603,841 |
| Events in quadrant B | 2,657,179 | 724,899 |
| Events in quadrant C | 2,793,588 | 682,551 |
| Events in quadrant D | 2,994,871 | 632,839 |
| Mode M9 | |||
|---|---|---|---|
| Quadrant | BADHDUFLAG | Total packets | Discarded packets |
| A | 0 | 23 | 0 |
| B | 0 | 23 | 0 |
| C | 0 | 23 | 0 |
| D | 0 | 24 | 0 |
| Mode M0 | |||
|---|---|---|---|
| Quadrant | BADHDUFLAG | Total packets | Discarded packets |
| A | 0 | 26015 | 3 |
| B | 0 | 11017 | 2 |
| C | 0 | 11330 | 2 |
| D | 0 | 12349 | 2 |
| Mode SS | |||
|---|---|---|---|
| Quadrant | BADHDUFLAG | Total packets | Discarded packets |
| A | 0 | 108 | 0 |
| B | 0 | 108 | 0 |
| C | 0 | 108 | 0 |
| D | 0 | 108 | 0 |
| Quadrant | Total seconds | Saturated seconds | Saturation percentage |
|---|---|---|---|
| A | 5337 | 1145 | 21.454000% |
| B | 5337 | 10 | 0.187371% |
| C | 5337 | 5 | 0.093686% |
| D | 5337 | 45 | 0.843170% |
Noise dominated data is calculated using 1-second bins in cleaned event files. If a bin has >2000 counts, and if more than 50% of those come from <1% of pixels, then it is considered to be noise-dominated and hence unusable.
| Quadrant | # 1 sec bins | Bins with >0 counts | Bins with >2000 counts | High rate bins dominated by noise | Noise dominated (total time) | Noise dominated (detector-on time) | Marked lightcurve |
|---|---|---|---|---|---|---|---|
| A | 7341 | 5338 | 1047 | 1047 | 14.26% | 19.61% | 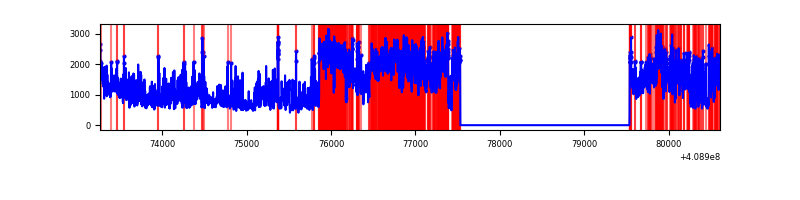 |
| B | 7341 | 5338 | 2 | 2 | 0.03% | 0.04% | 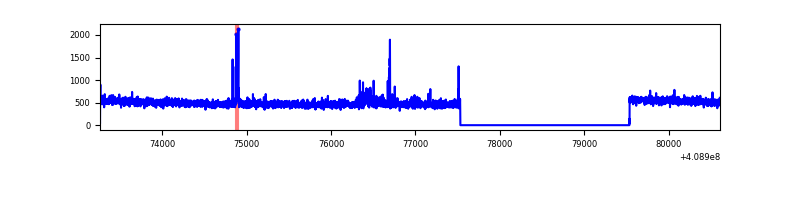 |
| C | 7341 | 5338 | 1 | 1 | 0.01% | 0.02% | 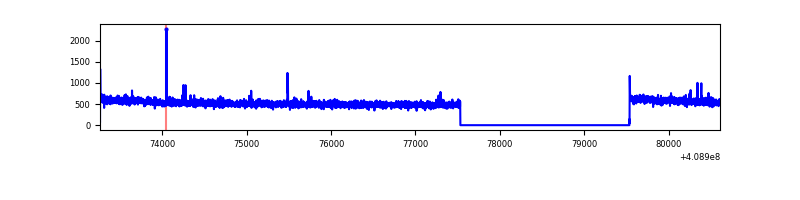 |
| D | 7341 | 5338 | 41 | 41 | 0.56% | 0.77% | 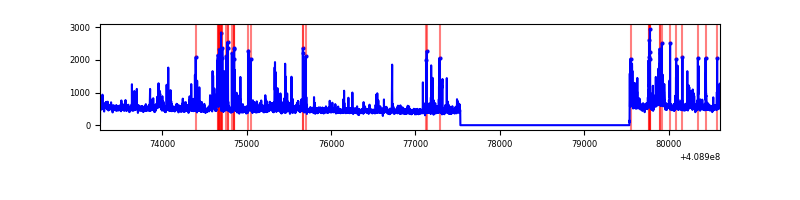 |
Top three noisy pixels from each quadrant. If the there are fewer than three noisy pixels in the level2.evt file, extra rows are filled as -1
| Pixel properties | Quadrant properties | ||||||
|---|---|---|---|---|---|---|---|
| Quadrant | DetID | PixID | Counts | Sigma | Mean | Median | Sigma |
| A | 15 | 222 | 4568451 | 36124.88 | 629 | 619 | 126.4 |
| A | 10 | 83 | 416025 | 3285.25 | 629 | 619 | 126.4 |
| A | 6 | 10 | 51385 | 401.48 | 629 | 619 | 126.4 |
| B | 5 | 172 | 26611 | 212.21 | 657 | 640 | 122.4 |
| B | 15 | 85 | 25823 | 205.77 | 657 | 640 | 122.4 |
| B | 0 | 190 | 21544 | 170.81 | 657 | 640 | 122.4 |
| C | 15 | 214 | 222872 | 1482.26 | 647 | 654 | 149.9 |
| C | 3 | 233 | 14598 | 93.01 | 647 | 654 | 149.9 |
| C | 2 | 16 | 12504 | 79.04 | 647 | 654 | 149.9 |
| D | 2 | 249 | 200361 | 1265.8 | 650 | 633 | 157.8 |
| D | 1 | 47 | 116889 | 736.79 | 650 | 633 | 157.8 |
| D | 2 | 250 | 92079 | 579.55 | 650 | 633 | 157.8 |
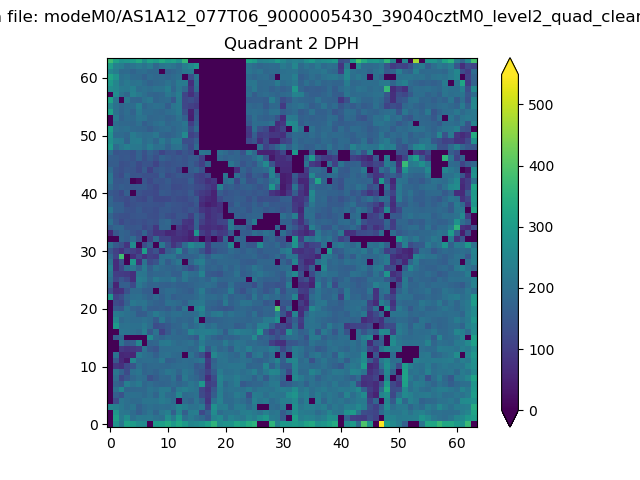
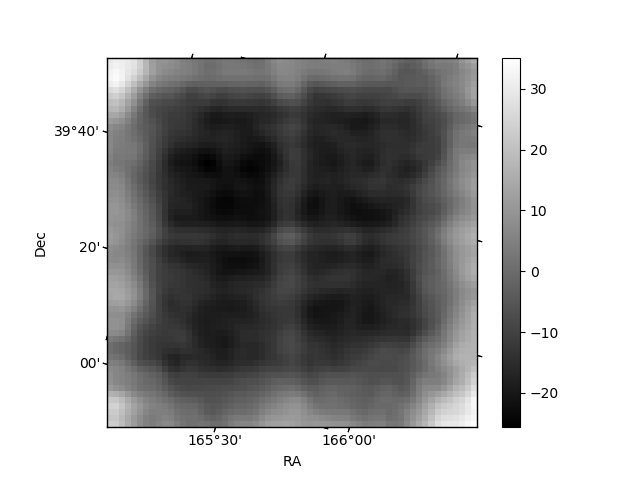
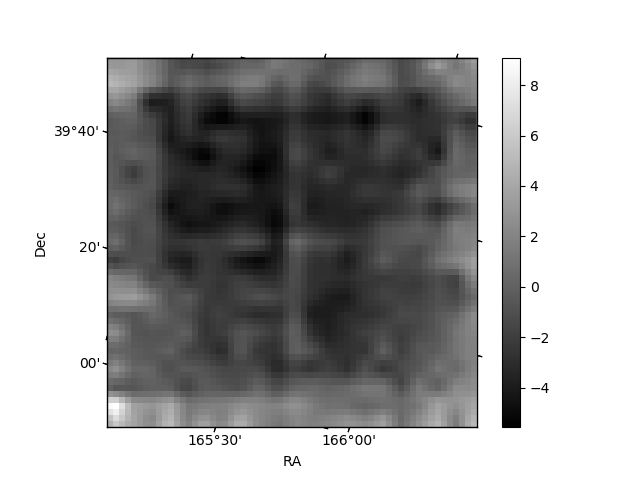
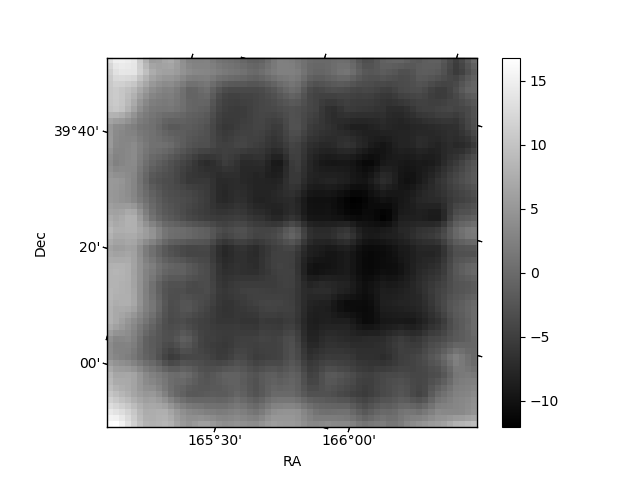
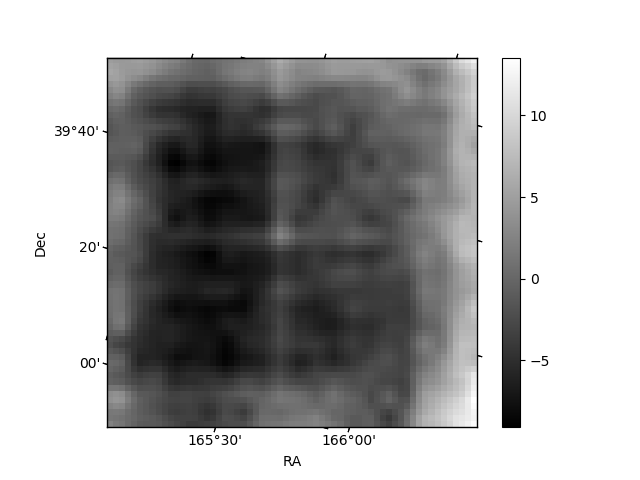
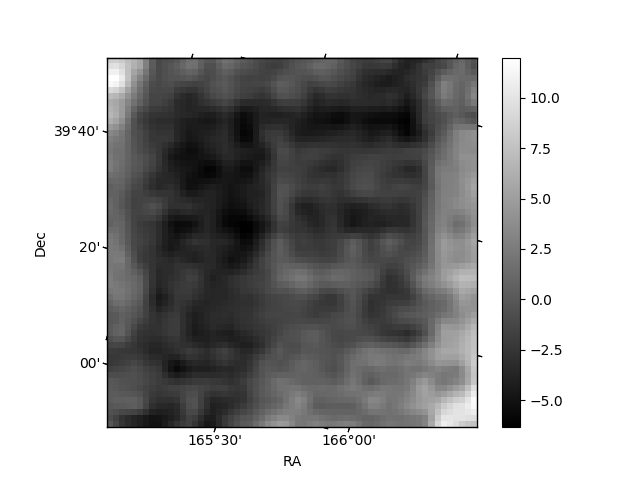
Histogram calculated using DETX and DETY for each event in the final _common_clean file
| Quadrant A | 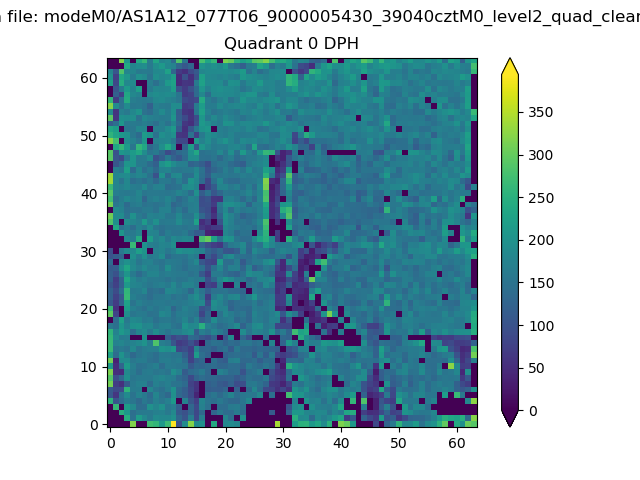 |
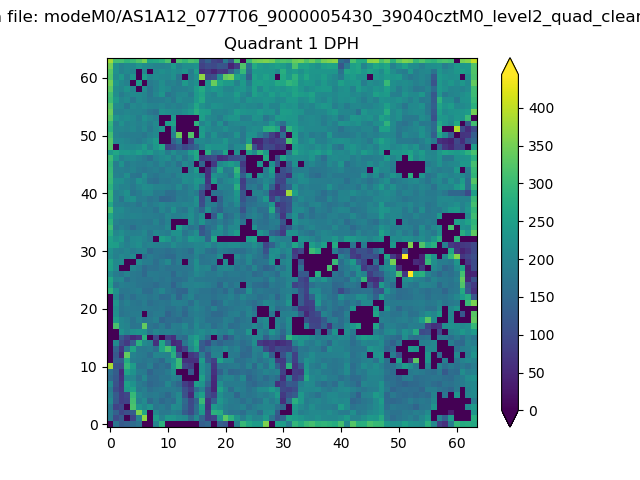 |
Quadrant B |
|---|---|---|---|
| Quadrant D | 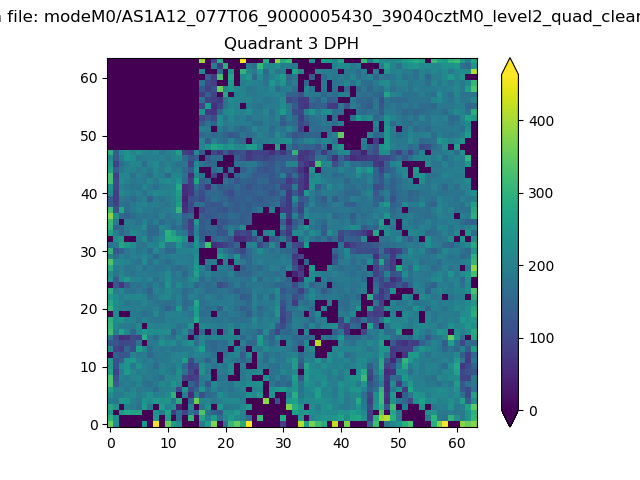 |
 |
Quadrant C |
| Plot type | Count rate plots | Images |
|---|---|---|
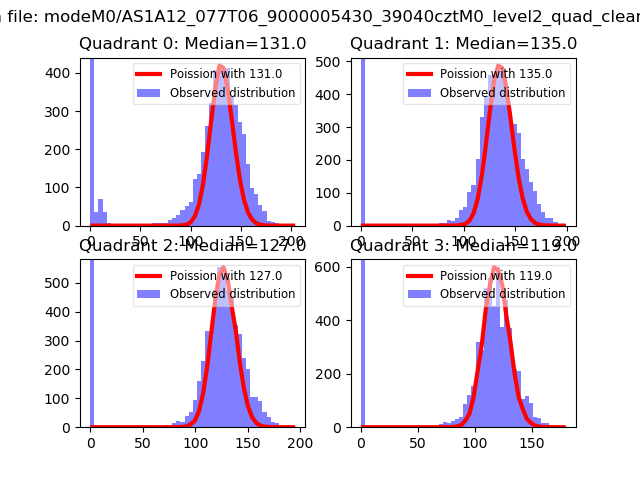
| Comparison with Poisson distribution Blue bars denote a histogram of data divided into 1 sec bins. Red curve is a Poisson curve with rate = median count rate of data. |
 |
 |
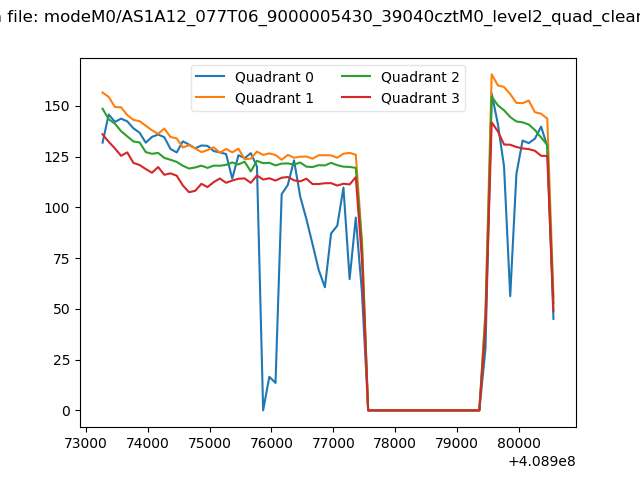
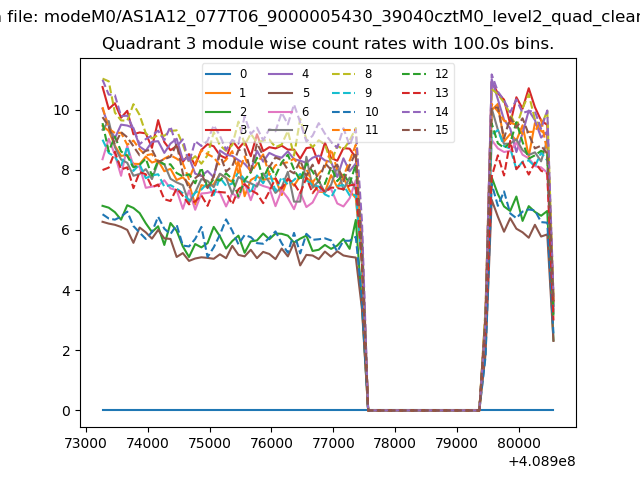
| Quadrant-wise count rates Data is divided into 100 sec bins |
 |
|
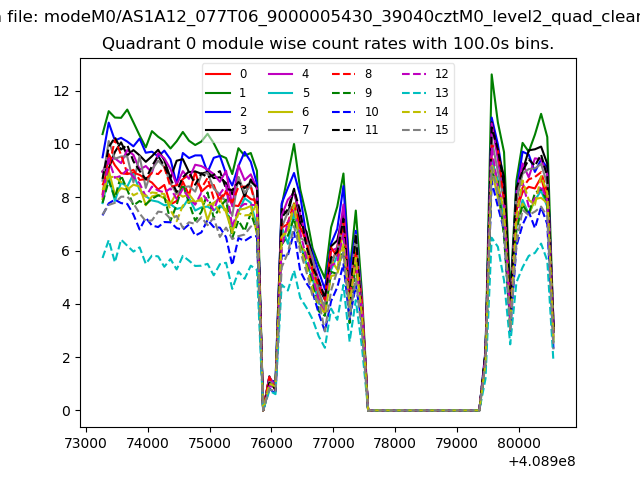
| Module-wise count rates for Quadrant A Data is divided into 100 sec bins |
 |
 |
| Module-wise count rates for Quadrant B Data is divided into 100 sec bins |
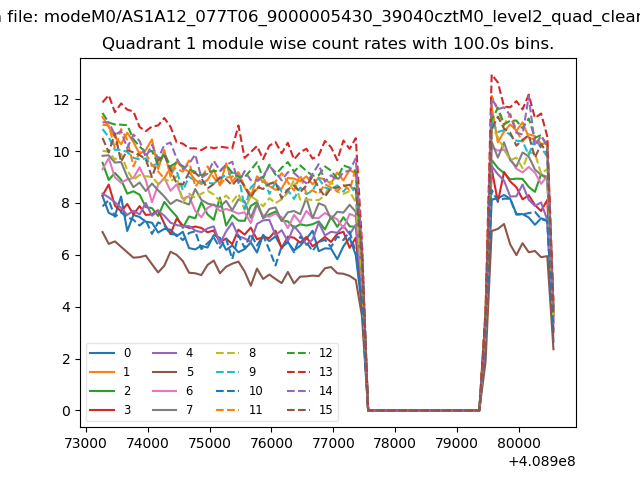 |
 |
| Module-wise count rates for Quadrant C Data is divided into 100 sec bins |
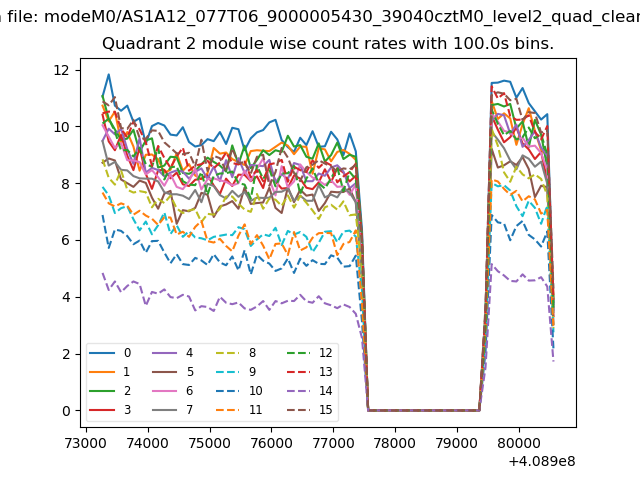 |
 |
| Module-wise count rates for Quadrant D Data is divided into 100 sec bins |
 |
 |
| Parameter | Plot |
|---|---|
| CZT HV Monitor | 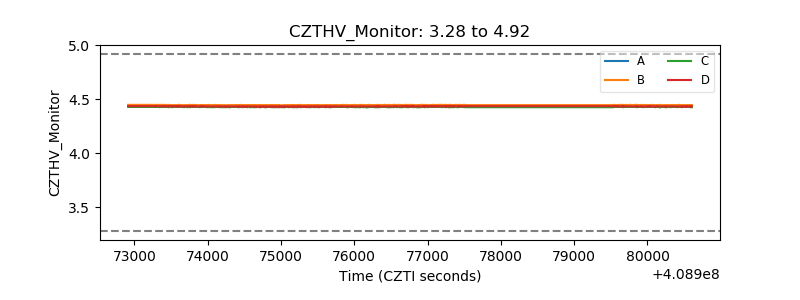 |
| D_VDD | 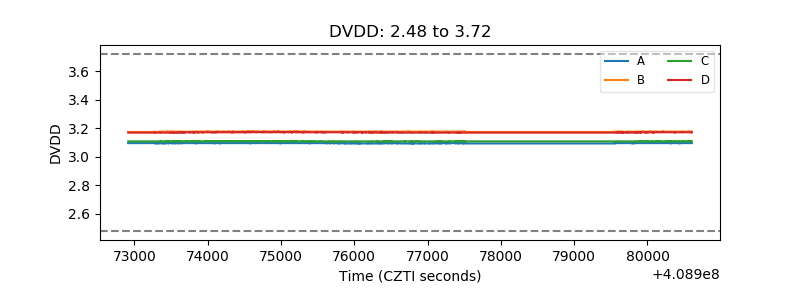 |
| Temperature 1 | 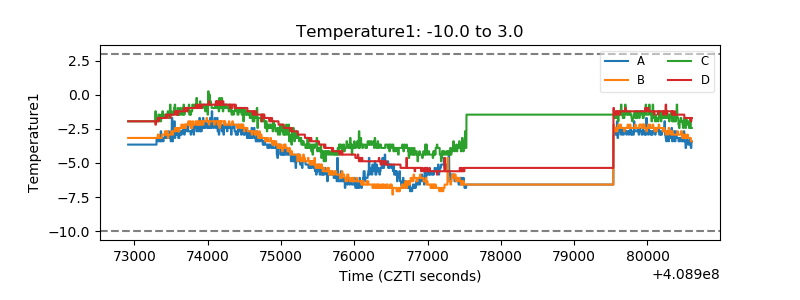 |
| Veto HV Monitor | 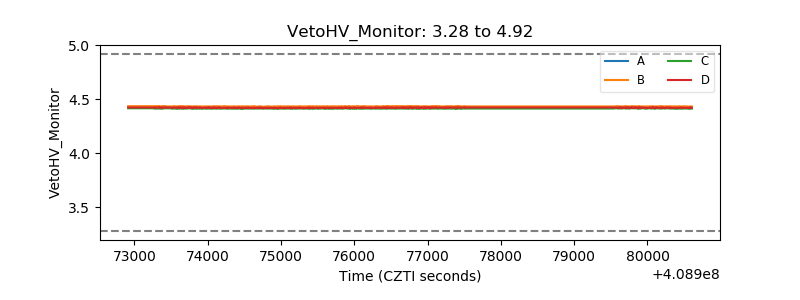 |
| Veto LLD | 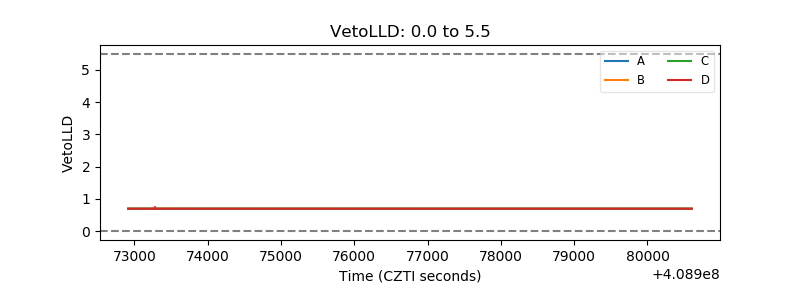 |
| Alpha Counter | 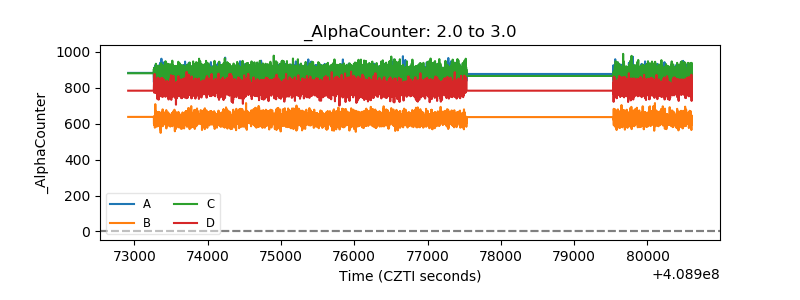 |
| _CPM_Rate | 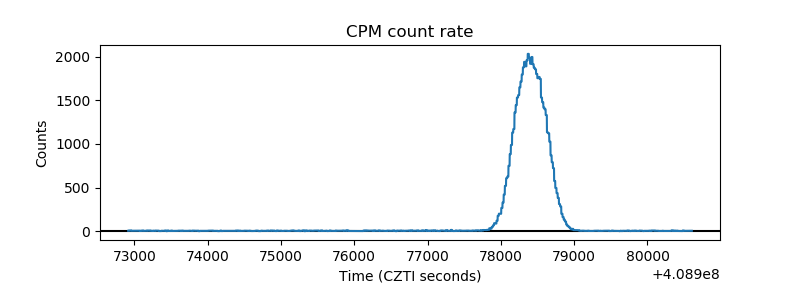 |
| CZT Counter | 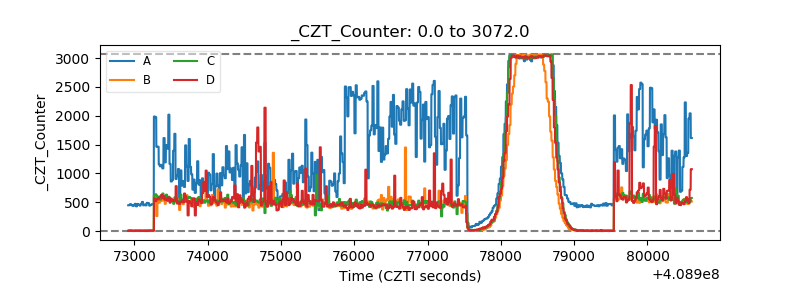 |
| +2.5 Volts monitor |  |
| +5 Volts monitor | 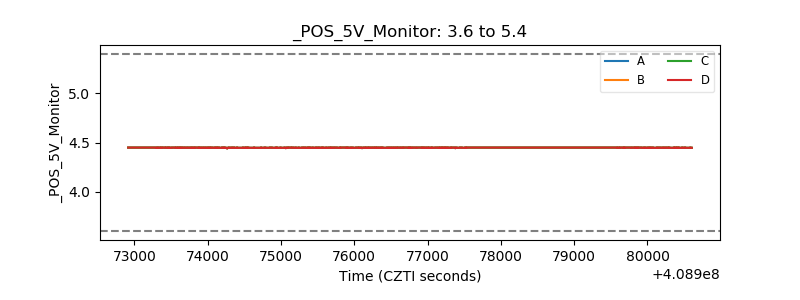 |
| _ROLL_ROT | 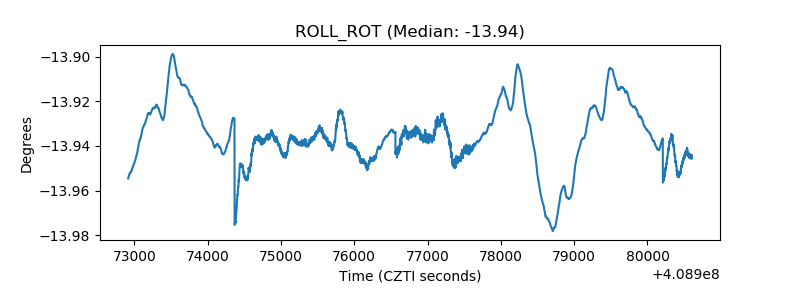 |
| _Roll_DEC | 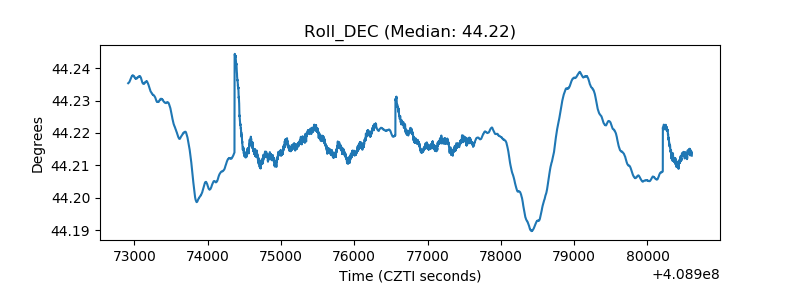 |
| _Roll_RA | 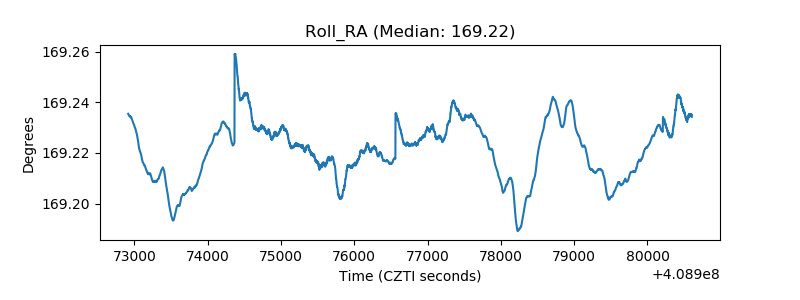 |
| Veto Counter | 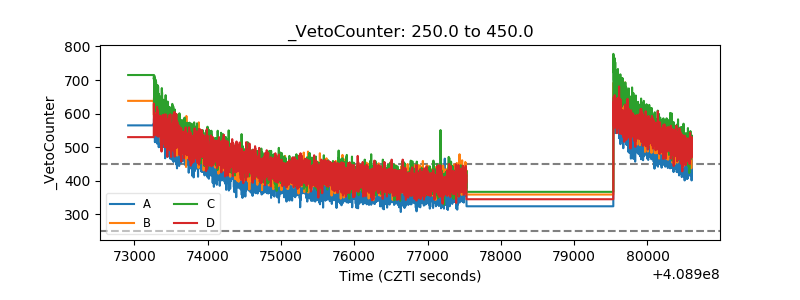 |