| Param | Original file | Final file |
|---|---|---|
| Filename | modeM0/AS1A12_077T06_9000005430_39041cztM0_level2.fits | modeM0/AS1A12_077T06_9000005430_39041cztM0_level2_quad_clean.evt |
| Size (bytes) | 412,280,640 | 99,613,440 |
| Size | 393.2 MB | 95.0 MB |
| Events in quadrant A | 6,715,400 | 604,843 |
| Events in quadrant B | 2,627,188 | 725,609 |
| Events in quadrant C | 2,739,848 | 686,798 |
| Events in quadrant D | 2,774,528 | 635,073 |
| Mode M9 | |||
|---|---|---|---|
| Quadrant | BADHDUFLAG | Total packets | Discarded packets |
| A | 0 | 29 | 0 |
| B | 0 | 29 | 0 |
| C | 0 | 29 | 0 |
| D | 0 | 30 | 0 |
| Mode M0 | |||
|---|---|---|---|
| Quadrant | BADHDUFLAG | Total packets | Discarded packets |
| A | 0 | 23567 | 3 |
| B | 0 | 10811 | 2 |
| C | 0 | 11135 | 2 |
| D | 0 | 11562 | 2 |
| Mode SS | |||
|---|---|---|---|
| Quadrant | BADHDUFLAG | Total packets | Discarded packets |
| A | 0 | 106 | 0 |
| B | 0 | 106 | 0 |
| C | 0 | 106 | 0 |
| D | 0 | 106 | 0 |
| Quadrant | Total seconds | Saturated seconds | Saturation percentage |
|---|---|---|---|
| A | 5200 | 1027 | 19.750000% |
| B | 5200 | 14 | 0.269231% |
| C | 5200 | 8 | 0.153846% |
| D | 5200 | 28 | 0.538462% |
Noise dominated data is calculated using 1-second bins in cleaned event files. If a bin has >2000 counts, and if more than 50% of those come from <1% of pixels, then it is considered to be noise-dominated and hence unusable.
| Quadrant | # 1 sec bins | Bins with >0 counts | Bins with >2000 counts | High rate bins dominated by noise | Noise dominated (total time) | Noise dominated (detector-on time) | Marked lightcurve |
|---|---|---|---|---|---|---|---|
| A | 7293 | 5201 | 825 | 825 | 11.31% | 15.86% | 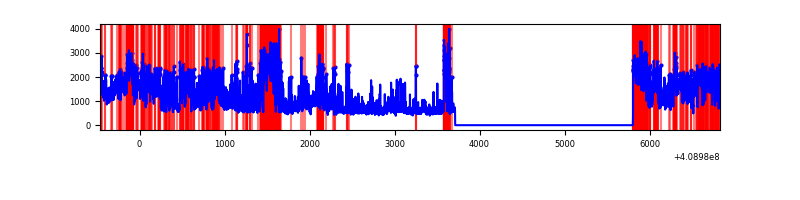 |
| B | 7293 | 5201 | 6 | 6 | 0.08% | 0.12% | 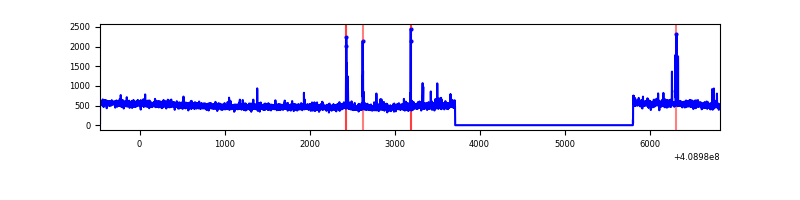 |
| C | 7293 | 5201 | 3 | 3 | 0.04% | 0.06% | 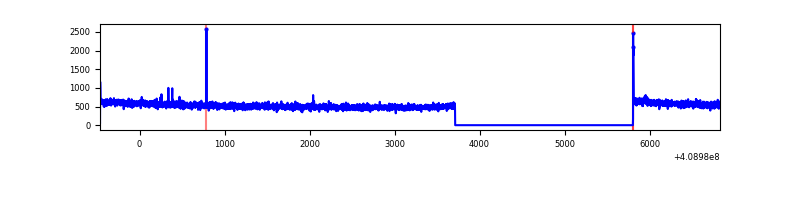 |
| D | 7293 | 5201 | 21 | 21 | 0.29% | 0.40% | 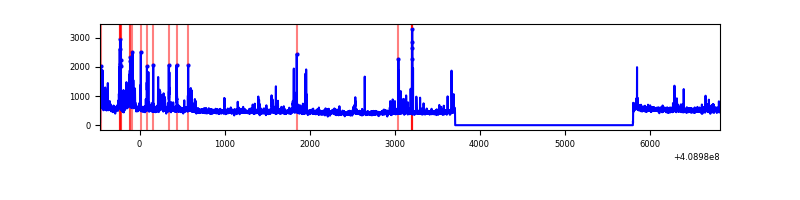 |
Top three noisy pixels from each quadrant. If the there are fewer than three noisy pixels in the level2.evt file, extra rows are filled as -1
| Pixel properties | Quadrant properties | ||||||
|---|---|---|---|---|---|---|---|
| Quadrant | DetID | PixID | Counts | Sigma | Mean | Median | Sigma |
| A | 15 | 222 | 3919776 | 32335.82 | 606 | 597 | 121.2 |
| A | 10 | 83 | 378931 | 3121.51 | 606 | 597 | 121.2 |
| A | 12 | 16 | 23967 | 192.82 | 606 | 597 | 121.2 |
| B | 0 | 190 | 50065 | 408.04 | 647 | 631 | 121.1 |
| B | 15 | 85 | 18955 | 151.25 | 647 | 631 | 121.1 |
| B | 0 | 230 | 15806 | 125.26 | 647 | 631 | 121.1 |
| C | 15 | 214 | 218362 | 1474.23 | 640 | 645 | 147.7 |
| C | 0 | 10 | 10695 | 68.05 | 640 | 645 | 147.7 |
| C | 4 | 0 | 4621 | 26.92 | 640 | 645 | 147.7 |
| D | 1 | 47 | 129332 | 833.22 | 640 | 624 | 154.5 |
| D | 2 | 249 | 63717 | 408.45 | 640 | 624 | 154.5 |
| D | 2 | 250 | 45703 | 291.83 | 640 | 624 | 154.5 |
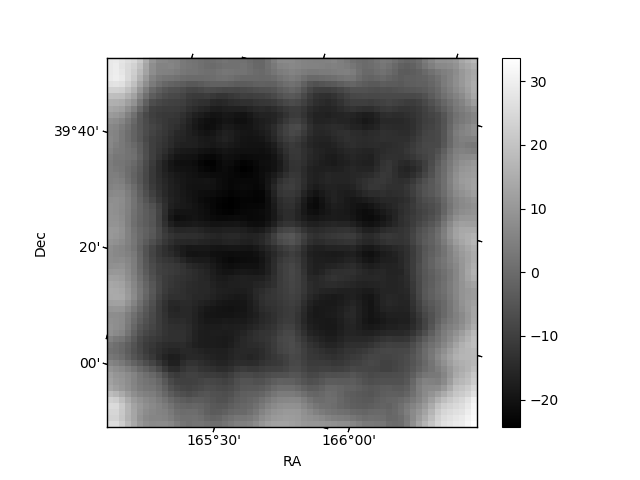
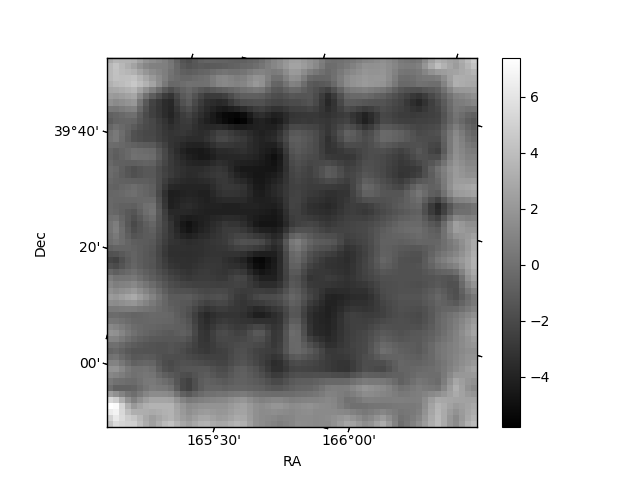
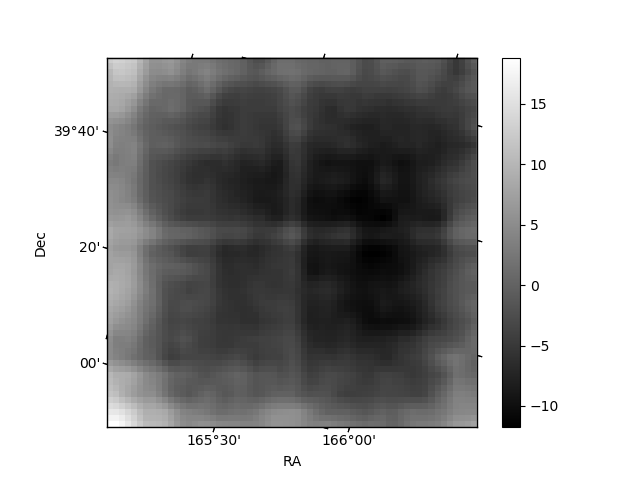
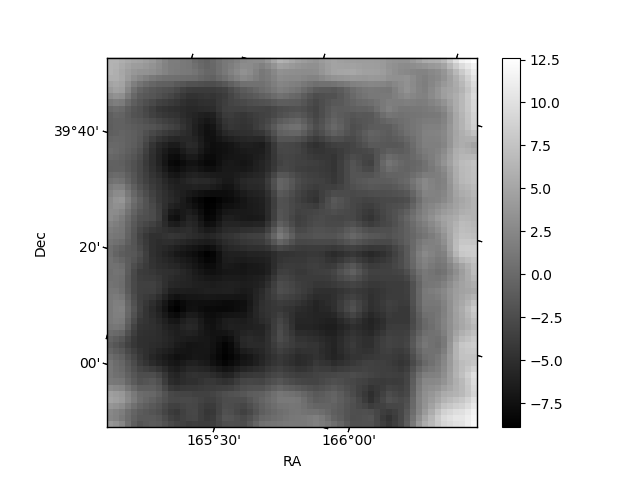
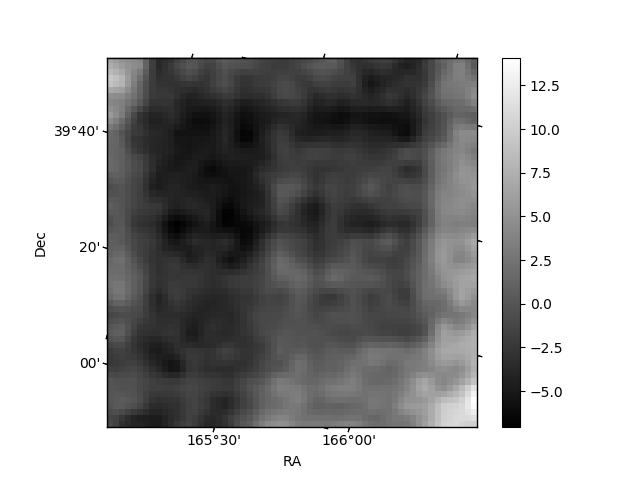
Histogram calculated using DETX and DETY for each event in the final _common_clean file
| Quadrant A | 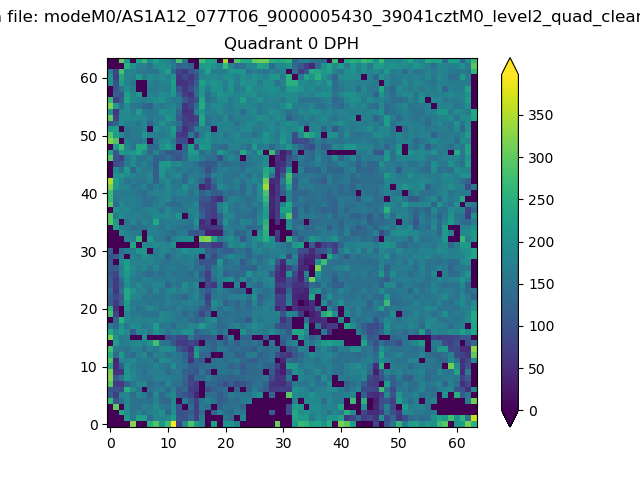 |
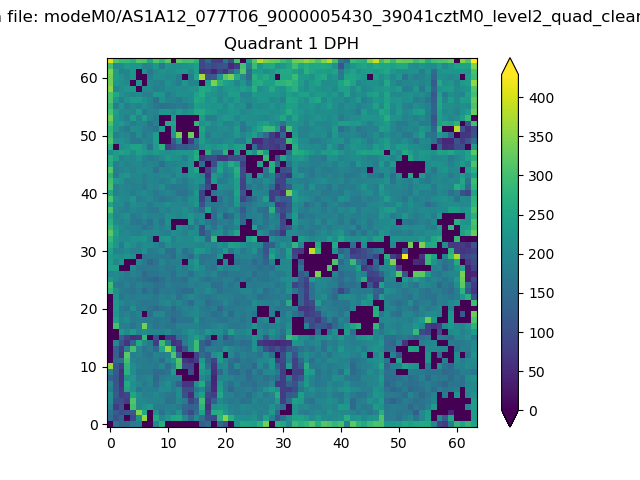 |
Quadrant B |
|---|---|---|---|
| Quadrant D | 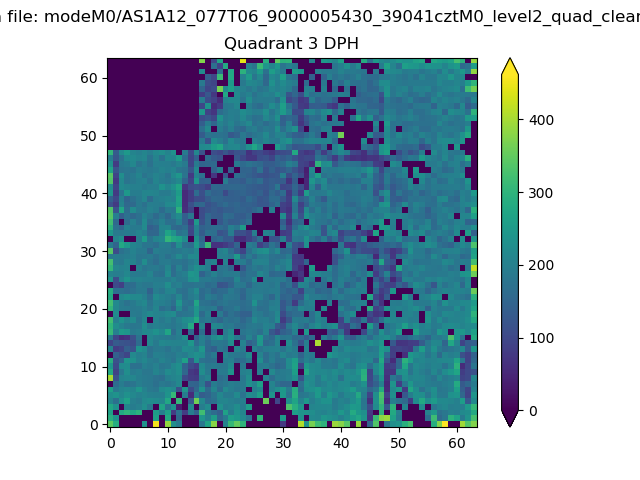 |
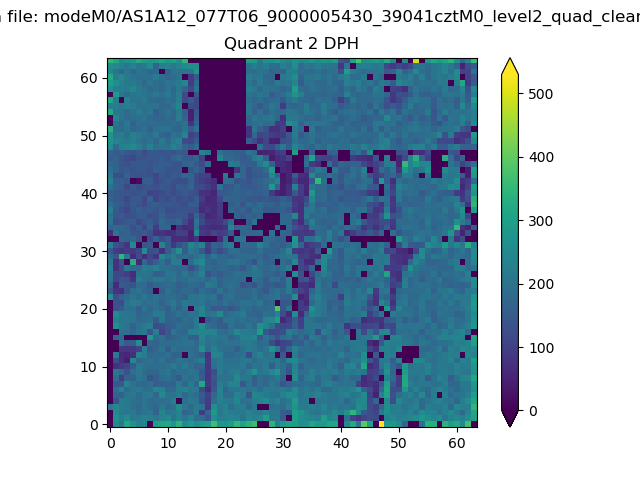 |
Quadrant C |
| Plot type | Count rate plots | Images |
|---|---|---|
| Comparison with Poisson distribution Blue bars denote a histogram of data divided into 1 sec bins. Red curve is a Poisson curve with rate = median count rate of data. |
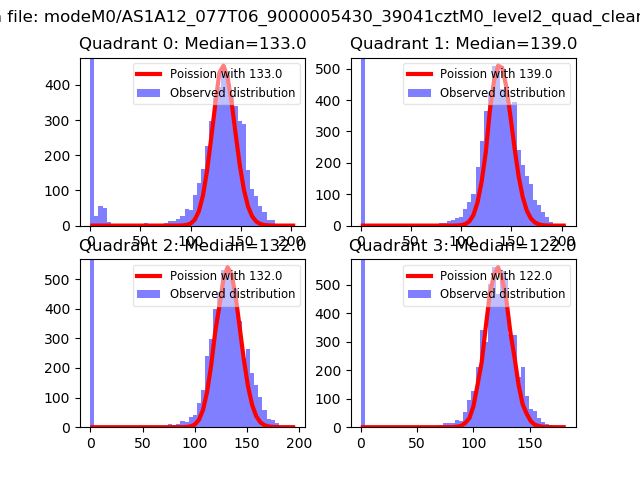 |
 |
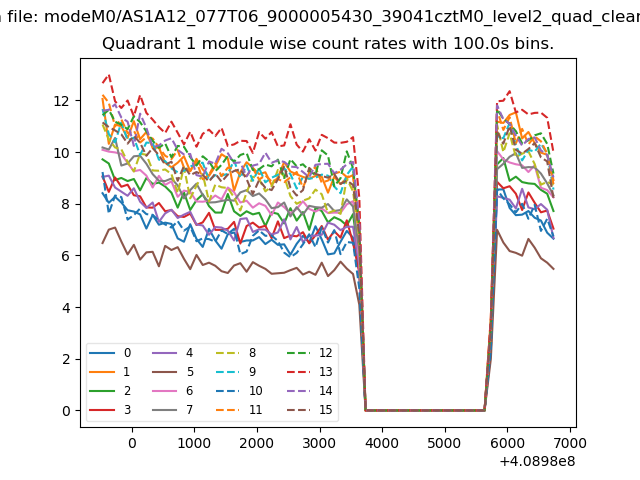
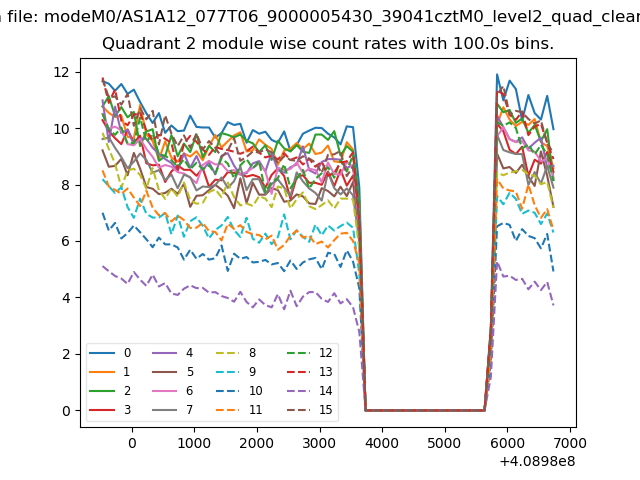
| Quadrant-wise count rates Data is divided into 100 sec bins |
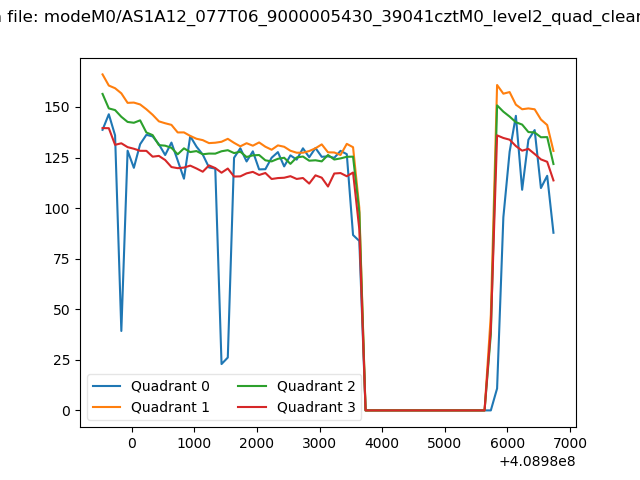 |
|
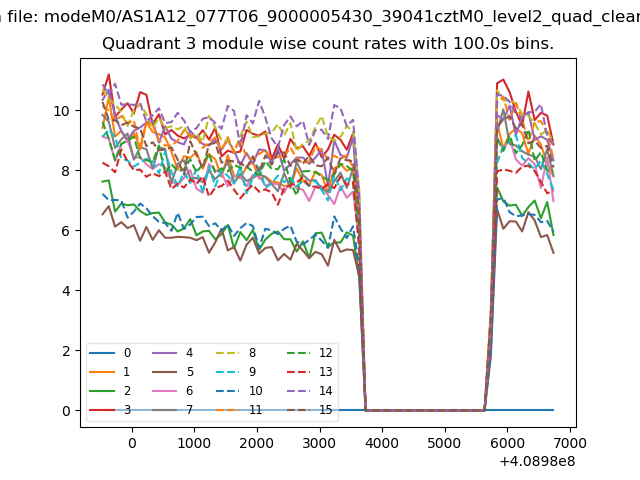
| Module-wise count rates for Quadrant A Data is divided into 100 sec bins |
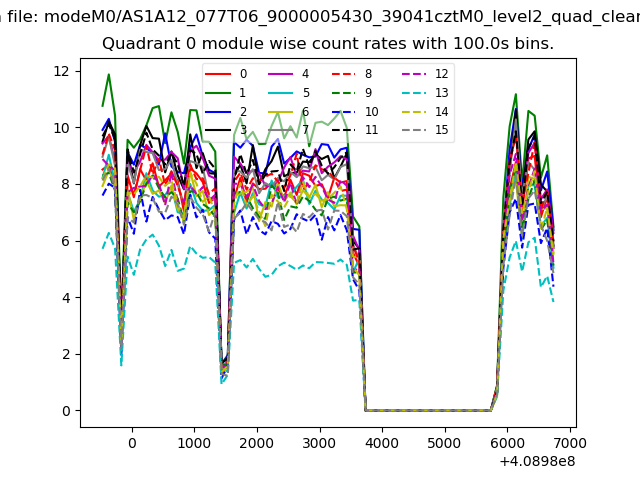 |
 |
| Module-wise count rates for Quadrant B Data is divided into 100 sec bins |
 |
 |
| Module-wise count rates for Quadrant C Data is divided into 100 sec bins |
 |
 |
| Module-wise count rates for Quadrant D Data is divided into 100 sec bins |
 |
 |
| Parameter | Plot |
|---|---|
| CZT HV Monitor | 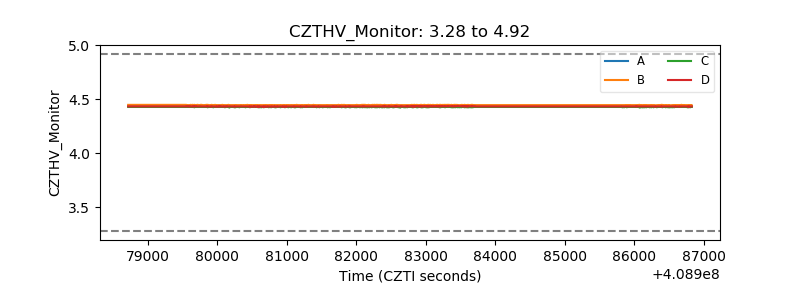 |
| D_VDD | 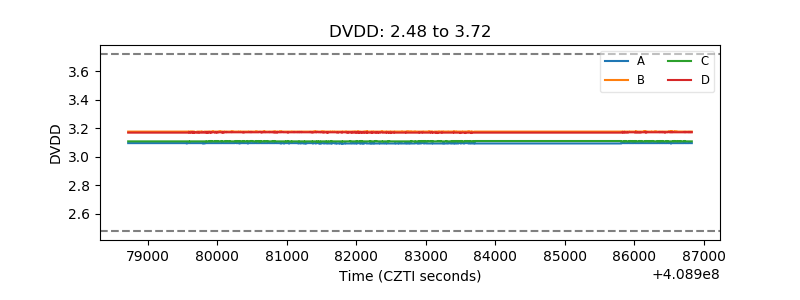 |
| Temperature 1 | 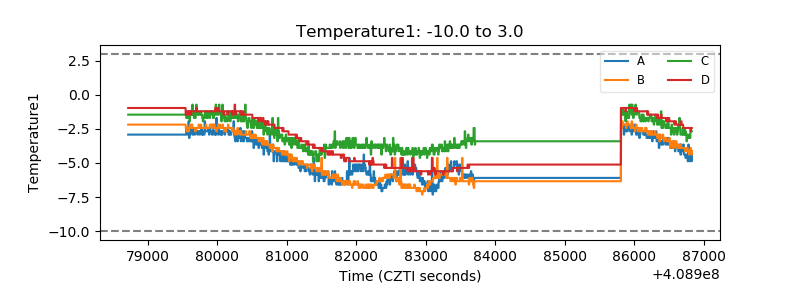 |
| Veto HV Monitor | 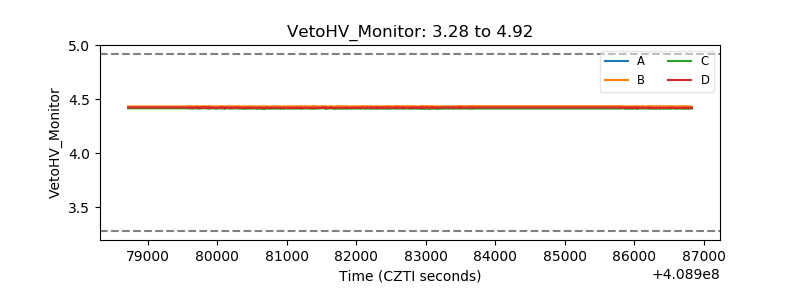 |
| Veto LLD | 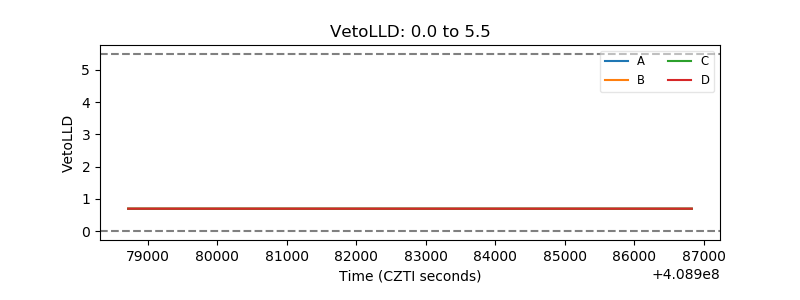 |
| Alpha Counter | 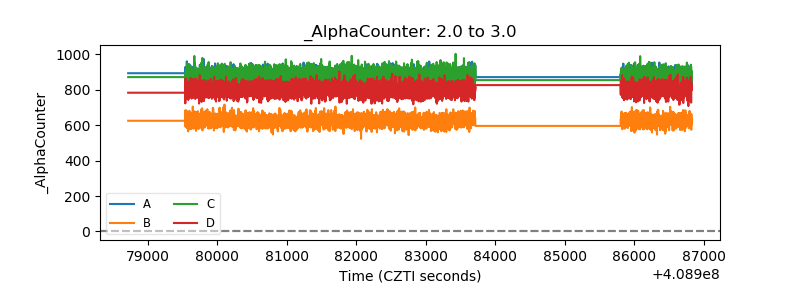 |
| _CPM_Rate | 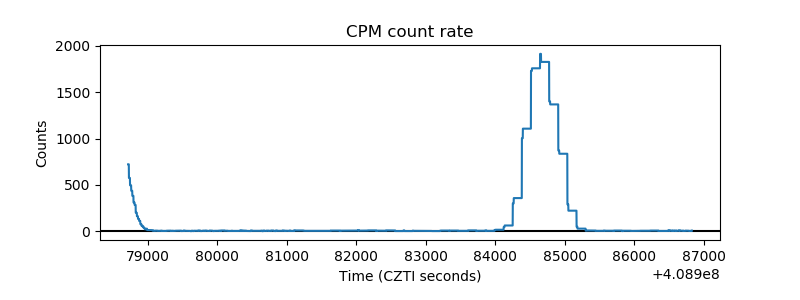 |
| CZT Counter | 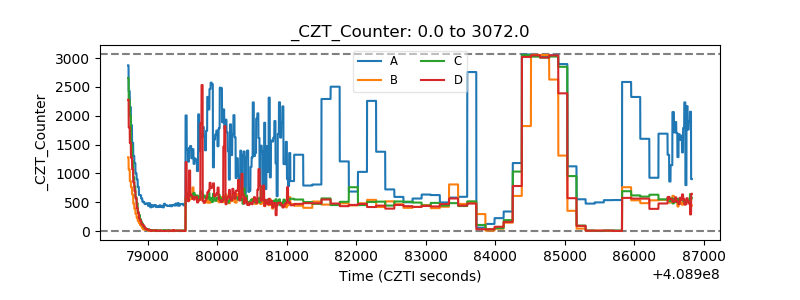 |
| +2.5 Volts monitor | 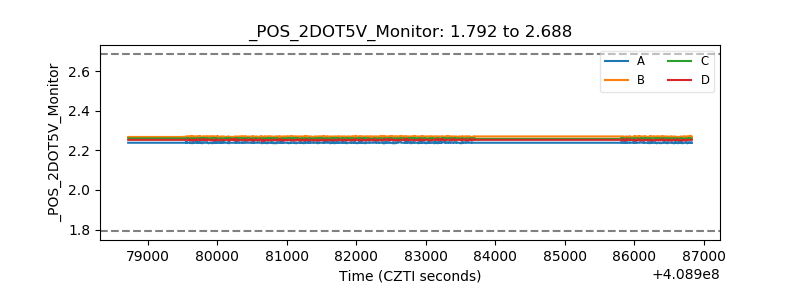 |
| +5 Volts monitor | 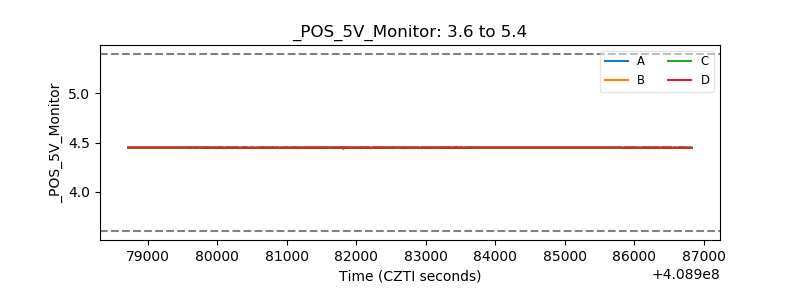 |
| _ROLL_ROT | 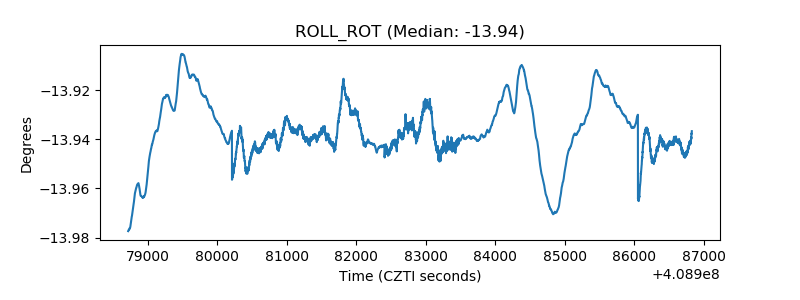 |
| _Roll_DEC | 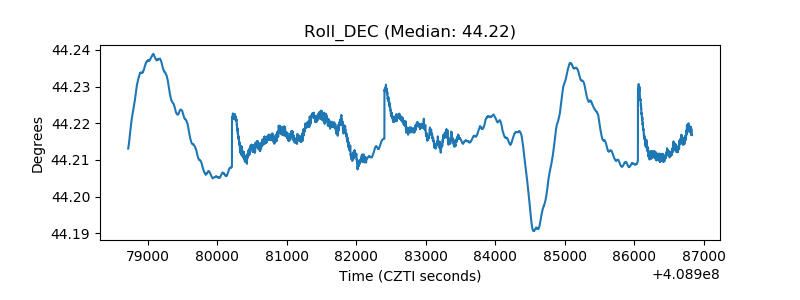 |
| _Roll_RA | 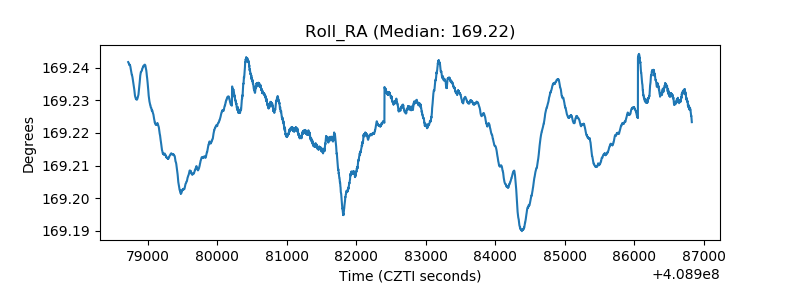 |
| Veto Counter | 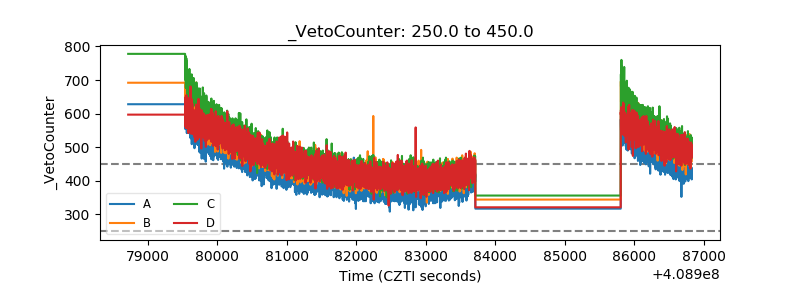 |