| Param | Original file | Final file |
|---|---|---|
| Filename | modeM0/AS1A12_077T06_9000005430_39042cztM0_level2.fits | modeM0/AS1A12_077T06_9000005430_39042cztM0_level2_quad_clean.evt |
| Size (bytes) | 451,782,720 | 86,469,120 |
| Size | 430.9 MB | 82.5 MB |
| Events in quadrant A | 8,548,770 | 381,034 |
| Events in quadrant B | 2,424,984 | 668,415 |
| Events in quadrant C | 2,549,655 | 636,371 |
| Events in quadrant D | 2,816,880 | 587,226 |
| Mode M9 | |||
|---|---|---|---|
| Quadrant | BADHDUFLAG | Total packets | Discarded packets |
| A | 0 | 33 | 0 |
| B | 0 | 33 | 0 |
| C | 0 | 33 | 0 |
| D | 0 | 34 | 0 |
| Mode M0 | |||
|---|---|---|---|
| Quadrant | BADHDUFLAG | Total packets | Discarded packets |
| A | 0 | 28724 | 3 |
| B | 0 | 10155 | 2 |
| C | 0 | 10453 | 2 |
| D | 0 | 11565 | 2 |
| Mode SS | |||
|---|---|---|---|
| Quadrant | BADHDUFLAG | Total packets | Discarded packets |
| A | 0 | 102 | 0 |
| B | 0 | 102 | 0 |
| C | 0 | 102 | 0 |
| D | 0 | 102 | 0 |
| Quadrant | Total seconds | Saturated seconds | Saturation percentage |
|---|---|---|---|
| A | 4921 | 2316 | 47.063605% |
| B | 4921 | 6 | 0.121926% |
| C | 4921 | 8 | 0.162569% |
| D | 4921 | 44 | 0.894127% |
Noise dominated data is calculated using 1-second bins in cleaned event files. If a bin has >2000 counts, and if more than 50% of those come from <1% of pixels, then it is considered to be noise-dominated and hence unusable.
| Quadrant | # 1 sec bins | Bins with >0 counts | Bins with >2000 counts | High rate bins dominated by noise | Noise dominated (total time) | Noise dominated (detector-on time) | Marked lightcurve |
|---|---|---|---|---|---|---|---|
| A | 7073 | 4922 | 2238 | 2238 | 31.64% | 45.47% | 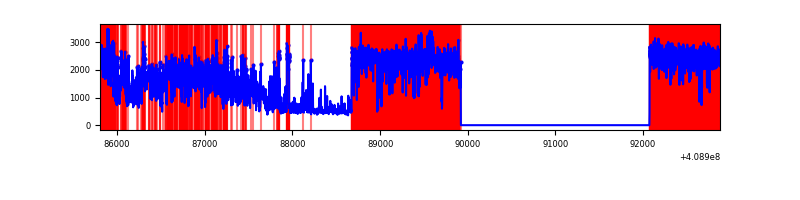 |
| B | 7073 | 4922 | 1 | 1 | 0.01% | 0.02% |  |
| C | 7073 | 4922 | 3 | 3 | 0.04% | 0.06% | 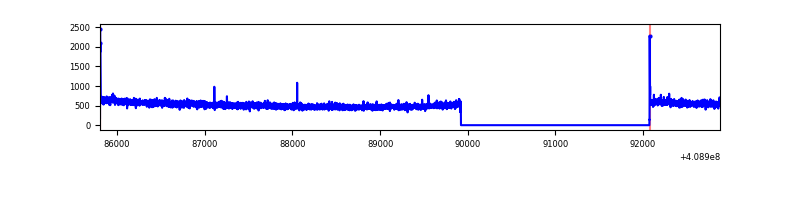 |
| D | 7073 | 4922 | 41 | 41 | 0.58% | 0.83% | 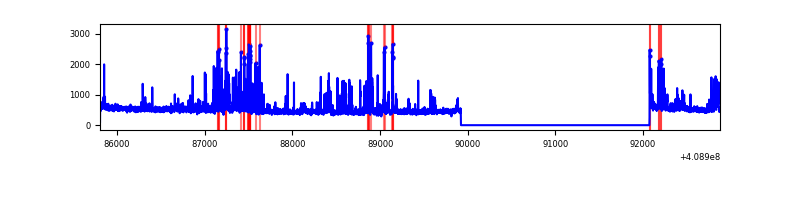 |
Top three noisy pixels from each quadrant. If the there are fewer than three noisy pixels in the level2.evt file, extra rows are filled as -1
| Pixel properties | Quadrant properties | ||||||
|---|---|---|---|---|---|---|---|
| Quadrant | DetID | PixID | Counts | Sigma | Mean | Median | Sigma |
| A | 15 | 222 | 6180435 | 62207.6 | 496 | 489 | 99.3 |
| A | 10 | 83 | 306107 | 3076.36 | 496 | 489 | 99.3 |
| A | 12 | 16 | 69562 | 695.29 | 496 | 489 | 99.3 |
| B | 0 | 190 | 45184 | 393.36 | 597 | 582 | 113.4 |
| B | 15 | 85 | 22262 | 191.2 | 597 | 582 | 113.4 |
| B | 12 | 111 | 13461 | 113.58 | 597 | 582 | 113.4 |
| C | 15 | 214 | 207465 | 1513.3 | 592 | 598 | 136.7 |
| C | 0 | 10 | 15599 | 109.74 | 592 | 598 | 136.7 |
| C | 12 | 175 | 5715 | 37.43 | 592 | 598 | 136.7 |
| D | 1 | 47 | 162081 | 1122.11 | 588 | 571 | 143.9 |
| D | 12 | 233 | 112150 | 775.21 | 588 | 571 | 143.9 |
| D | 2 | 249 | 103407 | 714.46 | 588 | 571 | 143.9 |
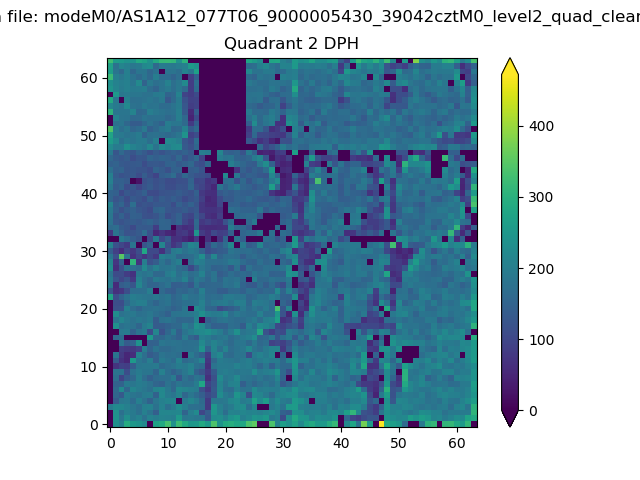
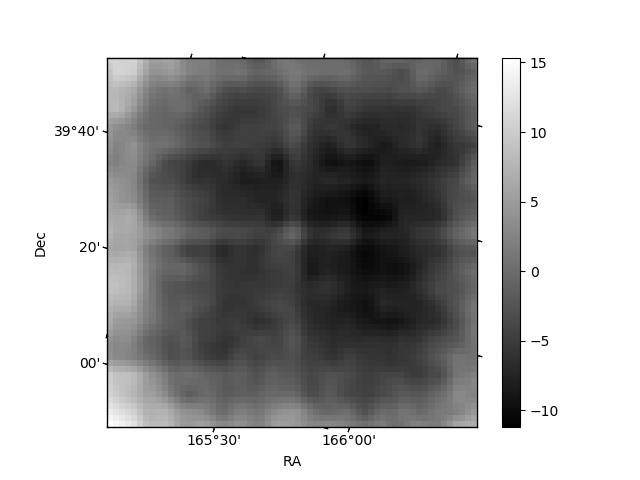
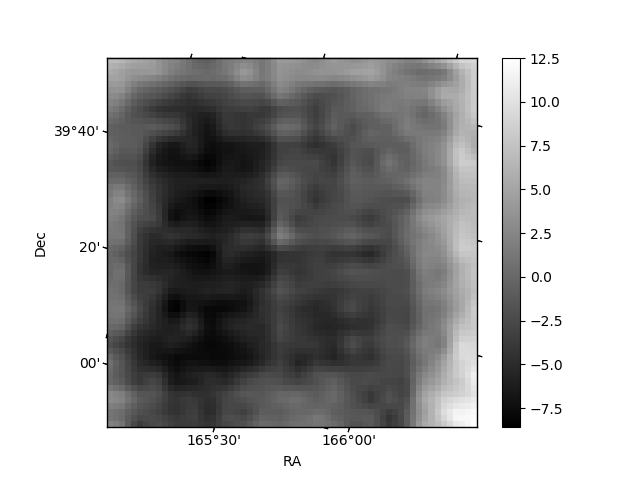
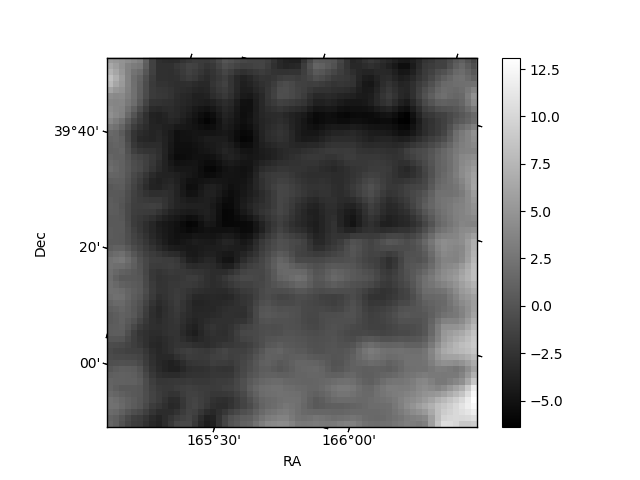
Histogram calculated using DETX and DETY for each event in the final _common_clean file
| Quadrant A | 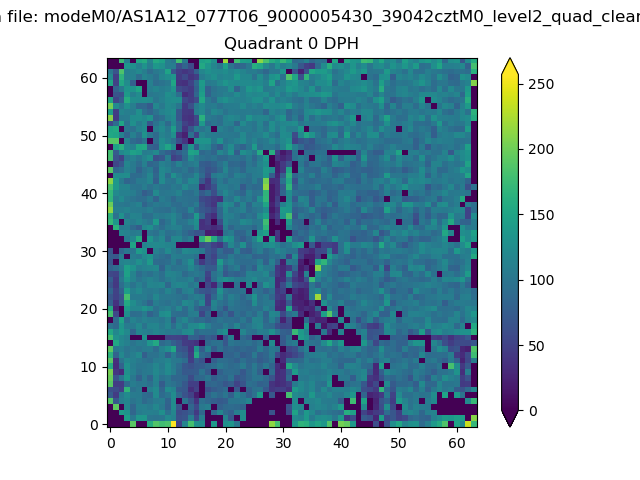 |
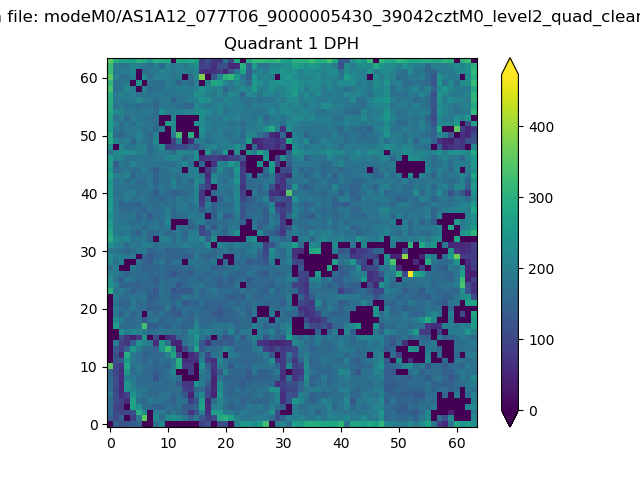 |
Quadrant B |
|---|---|---|---|
| Quadrant D | 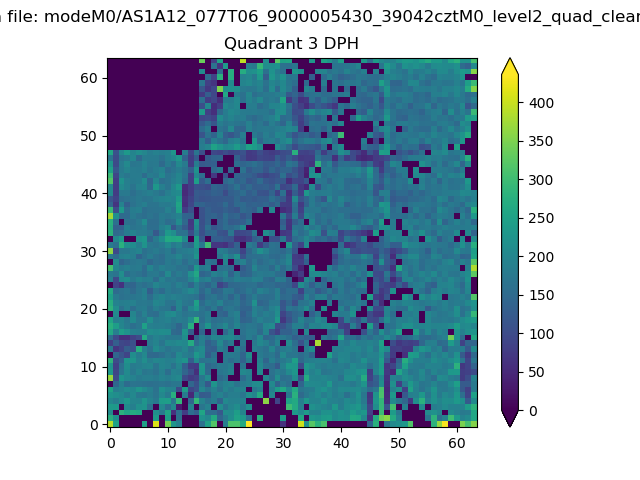 |
 |
Quadrant C |
| Plot type | Count rate plots | Images |
|---|---|---|
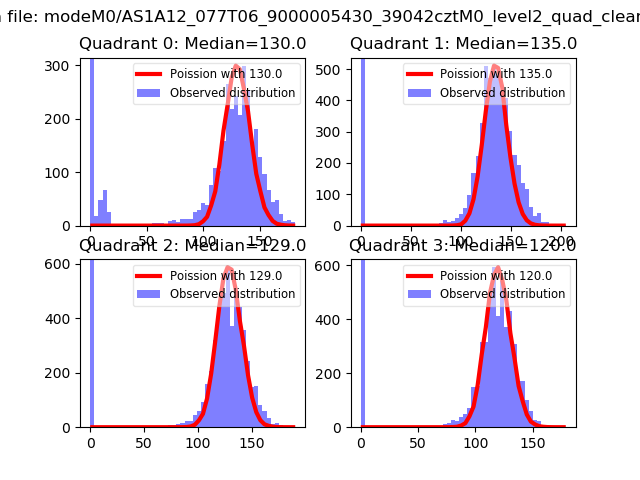
| Comparison with Poisson distribution Blue bars denote a histogram of data divided into 1 sec bins. Red curve is a Poisson curve with rate = median count rate of data. |
 |
 |
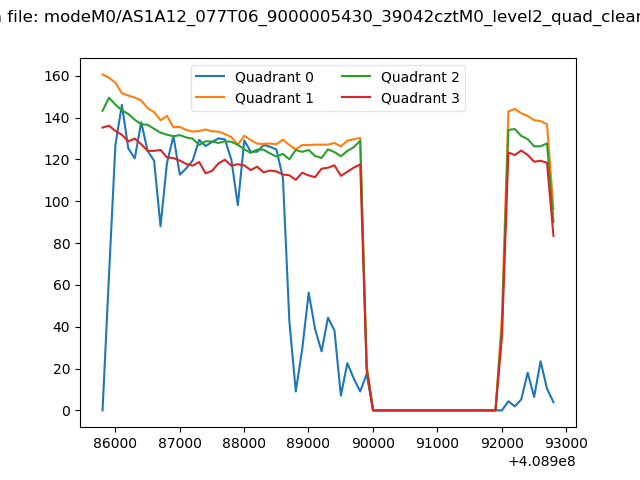
| Quadrant-wise count rates Data is divided into 100 sec bins |
 |
|
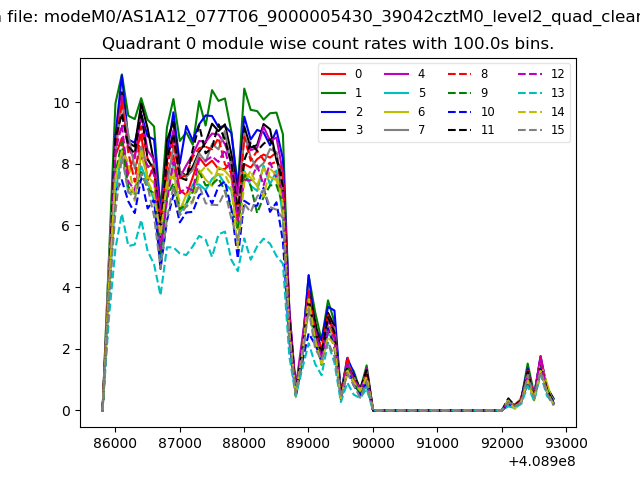
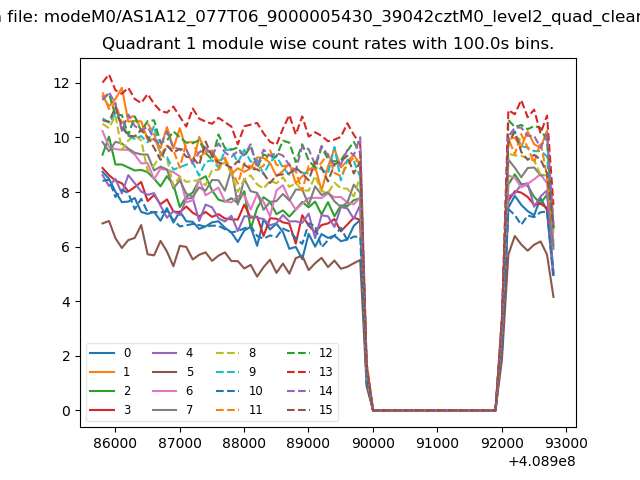
| Module-wise count rates for Quadrant A Data is divided into 100 sec bins |
 |
 |
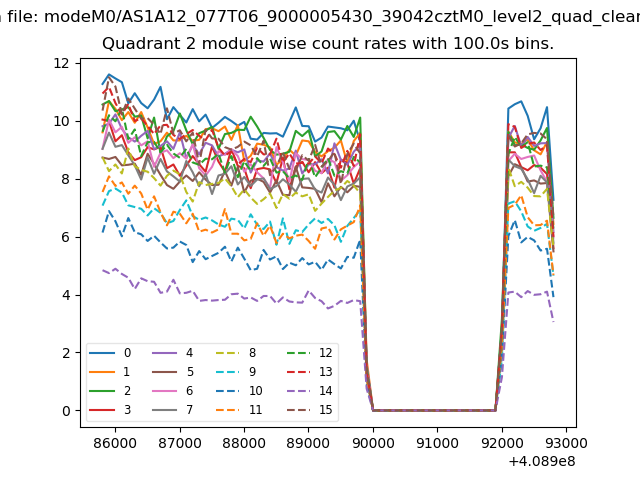
| Module-wise count rates for Quadrant B Data is divided into 100 sec bins |
 |
 |
| Module-wise count rates for Quadrant C Data is divided into 100 sec bins |
 |
 |
| Module-wise count rates for Quadrant D Data is divided into 100 sec bins |
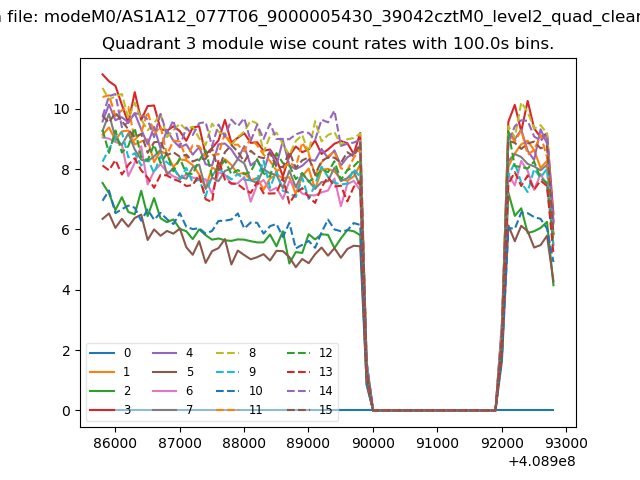 |
 |
| Parameter | Plot |
|---|---|
| CZT HV Monitor | 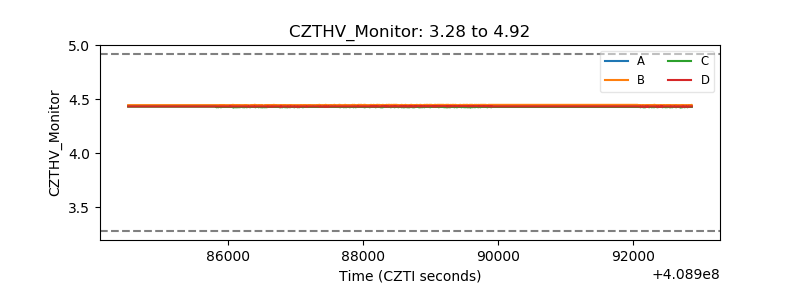 |
| D_VDD | 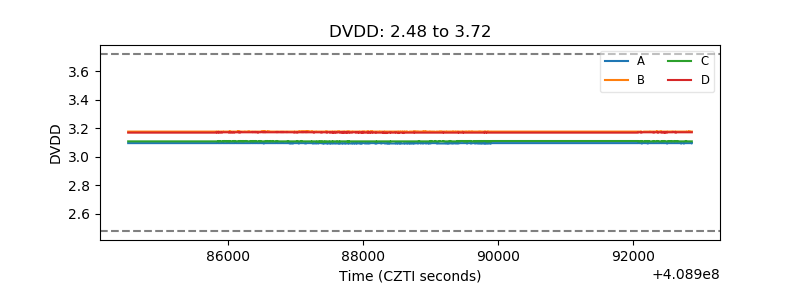 |
| Temperature 1 | 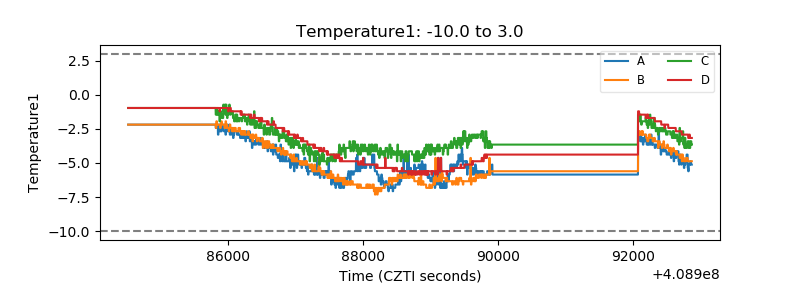 |
| Veto HV Monitor | 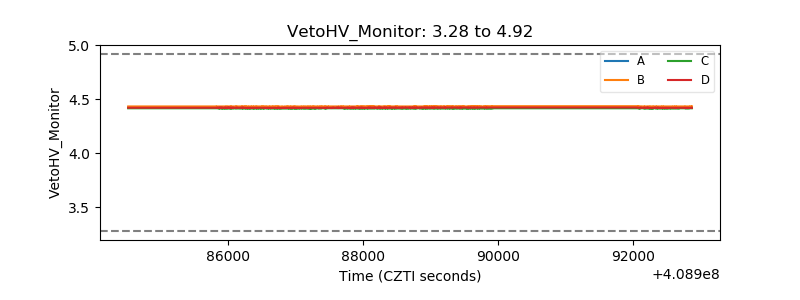 |
| Veto LLD | 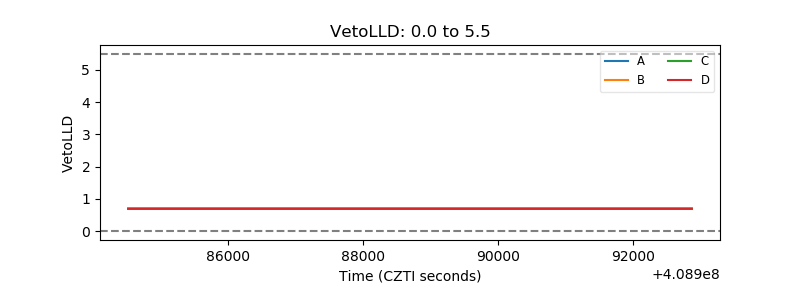 |
| Alpha Counter | 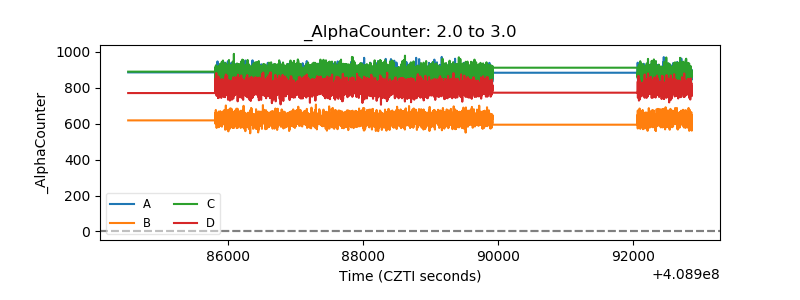 |
| _CPM_Rate | 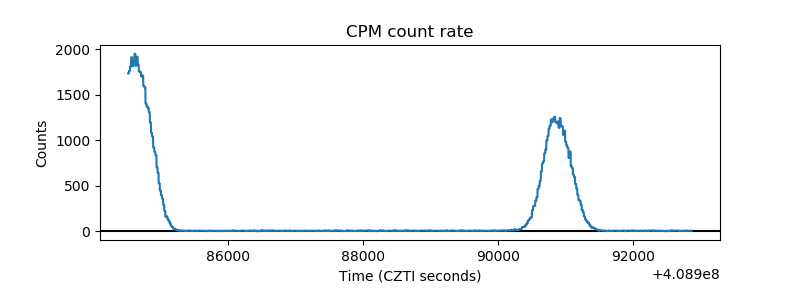 |
| CZT Counter | 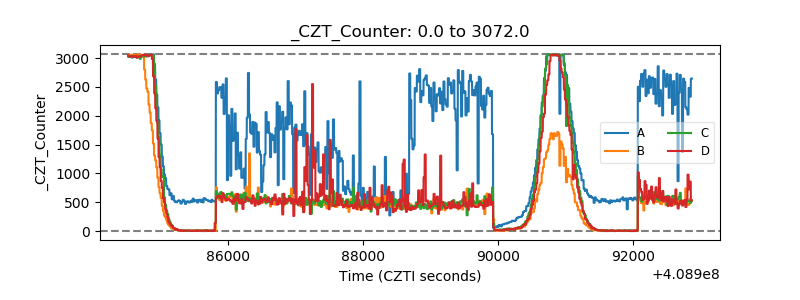 |
| +2.5 Volts monitor | 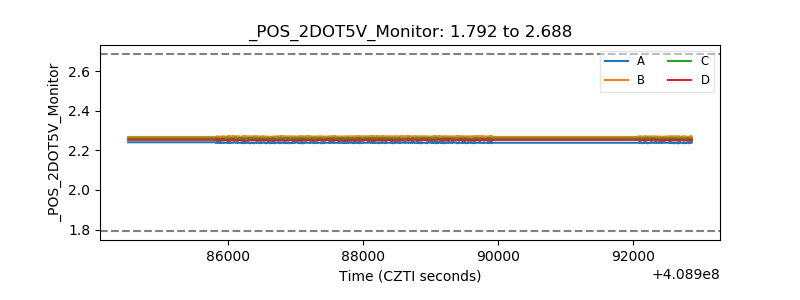 |
| +5 Volts monitor | 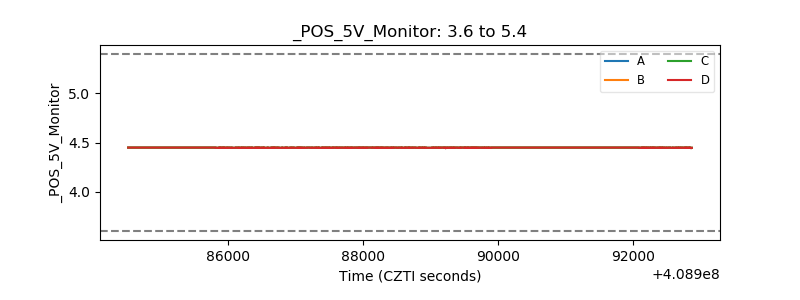 |
| _ROLL_ROT | 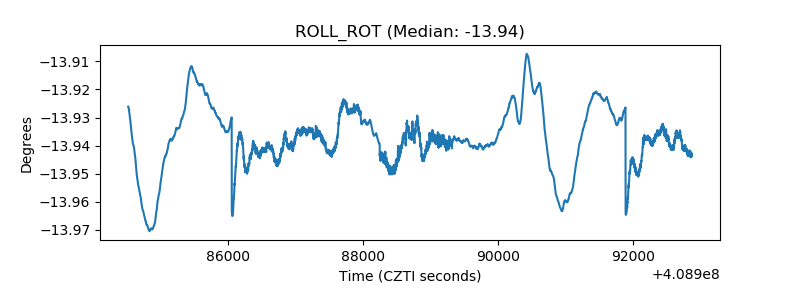 |
| _Roll_DEC | 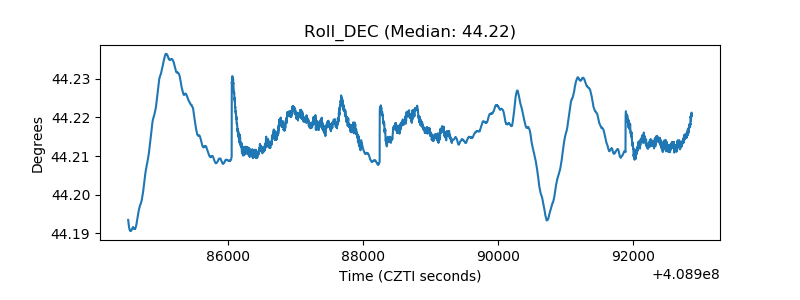 |
| _Roll_RA | 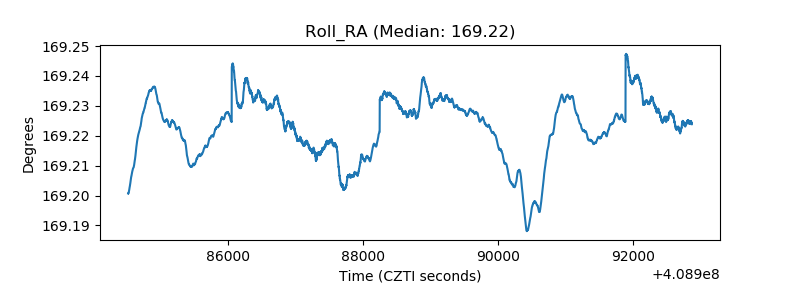 |
| Veto Counter | 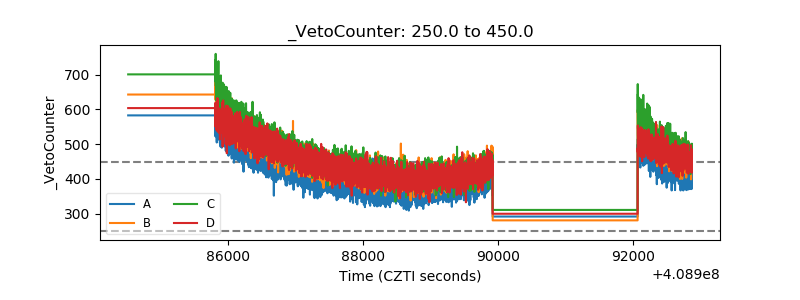 |