| Param | Original file | Final file |
|---|---|---|
| Filename | modeM0/AS1A12_077T06_9000005430_39043cztM0_level2.fits | modeM0/AS1A12_077T06_9000005430_39043cztM0_level2_quad_clean.evt |
| Size (bytes) | 355,343,040 | 84,830,400 |
| Size | 338.9 MB | 80.9 MB |
| Events in quadrant A | 5,277,667 | 473,502 |
| Events in quadrant B | 2,349,389 | 619,617 |
| Events in quadrant C | 2,409,723 | 592,092 |
| Events in quadrant D | 2,738,492 | 543,090 |
| Mode M9 | |||
|---|---|---|---|
| Quadrant | BADHDUFLAG | Total packets | Discarded packets |
| A | 0 | 22 | 0 |
| B | 0 | 22 | 0 |
| C | 0 | 22 | 0 |
| D | 0 | 23 | 0 |
| Mode M0 | |||
|---|---|---|---|
| Quadrant | BADHDUFLAG | Total packets | Discarded packets |
| A | 0 | 18802 | 3 |
| B | 0 | 10004 | 2 |
| C | 0 | 10017 | 2 |
| D | 0 | 11524 | 2 |
| Mode SS | |||
|---|---|---|---|
| Quadrant | BADHDUFLAG | Total packets | Discarded packets |
| A | 0 | 100 | 0 |
| B | 0 | 100 | 0 |
| C | 0 | 100 | 0 |
| D | 0 | 100 | 0 |
| Quadrant | Total seconds | Saturated seconds | Saturation percentage |
|---|---|---|---|
| A | 4852 | 1059 | 21.826051% |
| B | 4852 | 9 | 0.185491% |
| C | 4852 | 5 | 0.103050% |
| D | 4852 | 76 | 1.566364% |
Noise dominated data is calculated using 1-second bins in cleaned event files. If a bin has >2000 counts, and if more than 50% of those come from <1% of pixels, then it is considered to be noise-dominated and hence unusable.
| Quadrant | # 1 sec bins | Bins with >0 counts | Bins with >2000 counts | High rate bins dominated by noise | Noise dominated (total time) | Noise dominated (detector-on time) | Marked lightcurve |
|---|---|---|---|---|---|---|---|
| A | 6945 | 4853 | 1023 | 1023 | 14.73% | 21.08% | 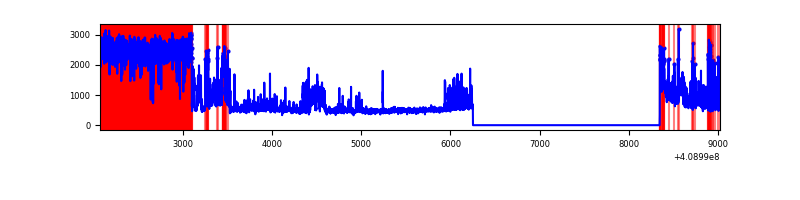 |
| B | 6945 | 4853 | 4 | 4 | 0.06% | 0.08% | 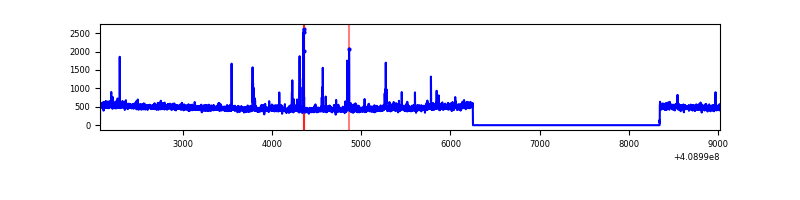 |
| C | 6945 | 4853 | 2 | 2 | 0.03% | 0.04% | 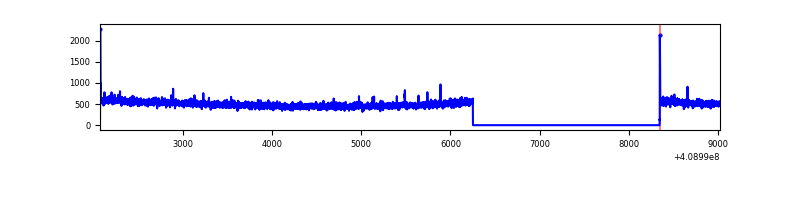 |
| D | 6945 | 4853 | 55 | 55 | 0.79% | 1.13% | 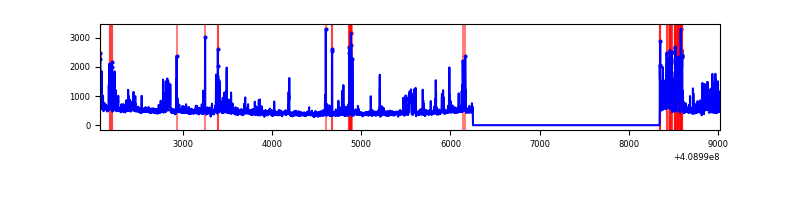 |
Top three noisy pixels from each quadrant. If the there are fewer than three noisy pixels in the level2.evt file, extra rows are filled as -1
| Pixel properties | Quadrant properties | ||||||
|---|---|---|---|---|---|---|---|
| Quadrant | DetID | PixID | Counts | Sigma | Mean | Median | Sigma |
| A | 15 | 222 | 2827303 | 28047.31 | 500 | 491 | 100.8 |
| A | 10 | 83 | 325530 | 3225.0 | 500 | 491 | 100.8 |
| A | 6 | 10 | 159611 | 1578.77 | 500 | 491 | 100.8 |
| B | 0 | 190 | 72074 | 667.01 | 562 | 547 | 107.2 |
| B | 5 | 172 | 38635 | 355.18 | 562 | 547 | 107.2 |
| B | 0 | 230 | 23244 | 211.66 | 562 | 547 | 107.2 |
| C | 15 | 214 | 204662 | 1574.13 | 557 | 561 | 129.7 |
| C | 0 | 10 | 12344 | 90.88 | 557 | 561 | 129.7 |
| C | 15 | 208 | 9955 | 72.45 | 557 | 561 | 129.7 |
| D | 1 | 47 | 142591 | 1050.67 | 551 | 536 | 135.2 |
| D | 12 | 233 | 135889 | 1001.11 | 551 | 536 | 135.2 |
| D | 12 | 227 | 128591 | 947.13 | 551 | 536 | 135.2 |
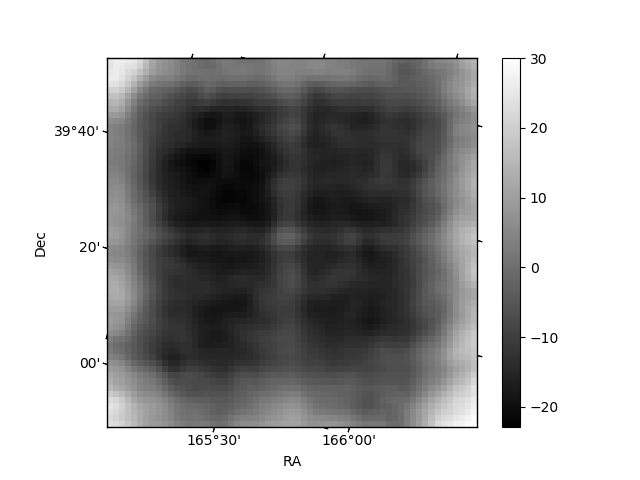
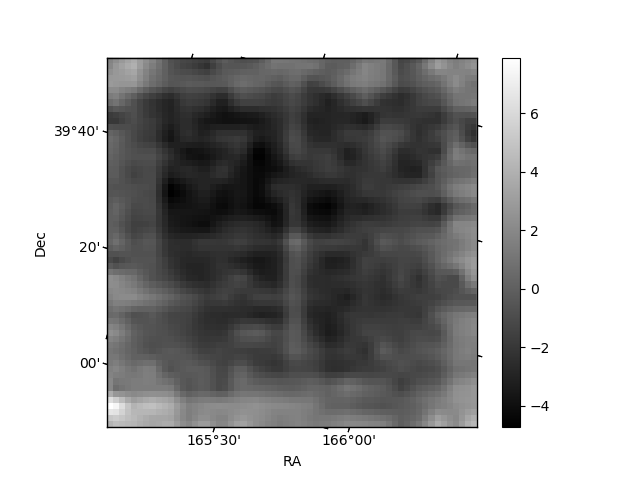
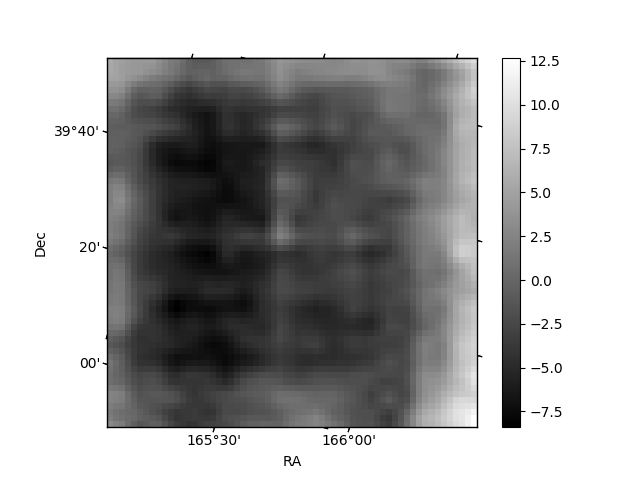
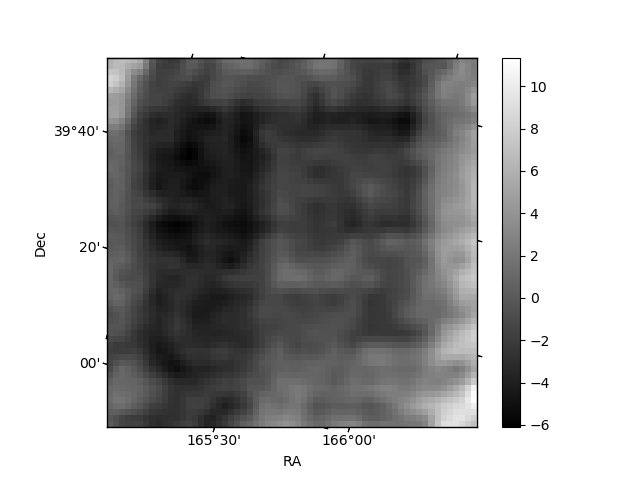
Histogram calculated using DETX and DETY for each event in the final _common_clean file
| Quadrant A | 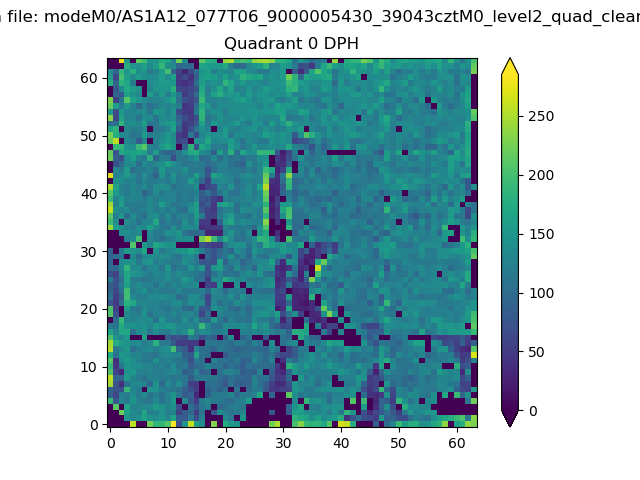 |
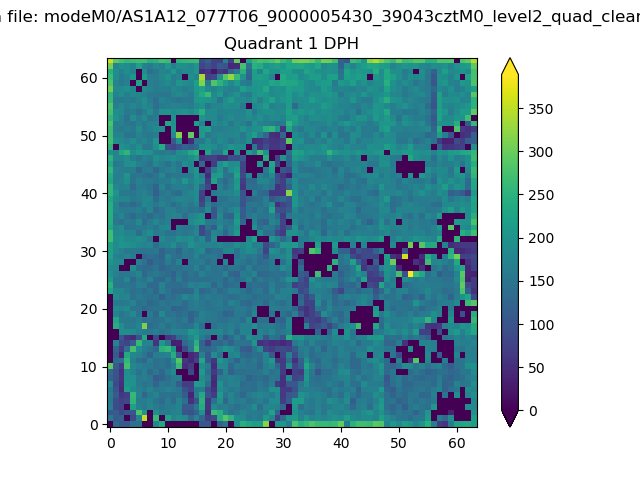 |
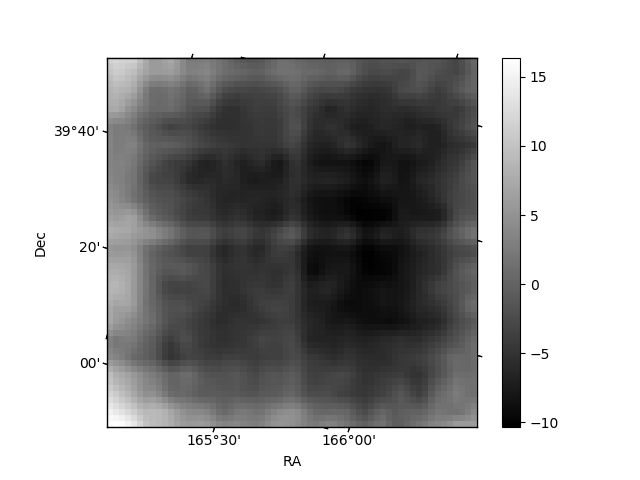
Quadrant B |
|---|---|---|---|
| Quadrant D | 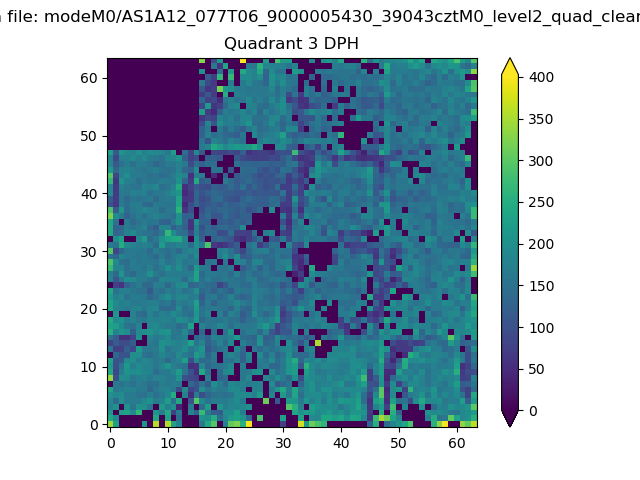 |
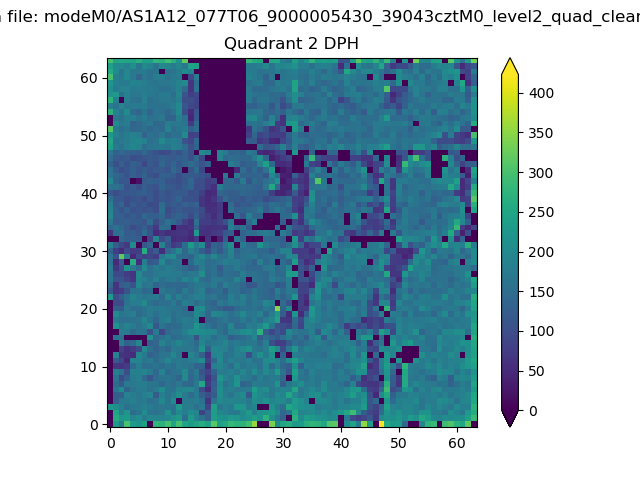 |
Quadrant C |
| Plot type | Count rate plots | Images |
|---|---|---|
| Comparison with Poisson distribution Blue bars denote a histogram of data divided into 1 sec bins. Red curve is a Poisson curve with rate = median count rate of data. |
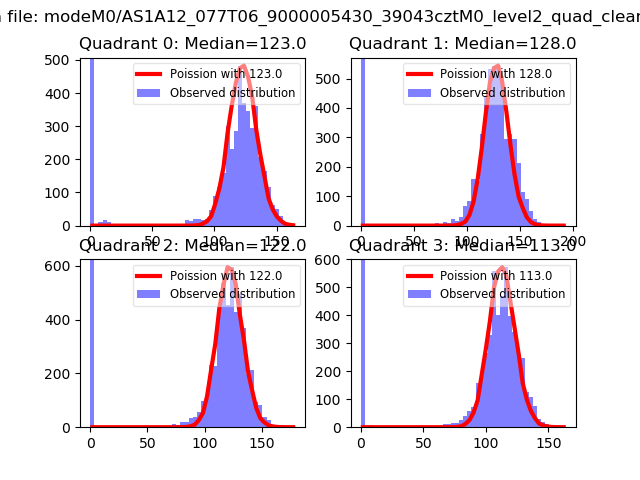 |
 |
| Quadrant-wise count rates Data is divided into 100 sec bins |
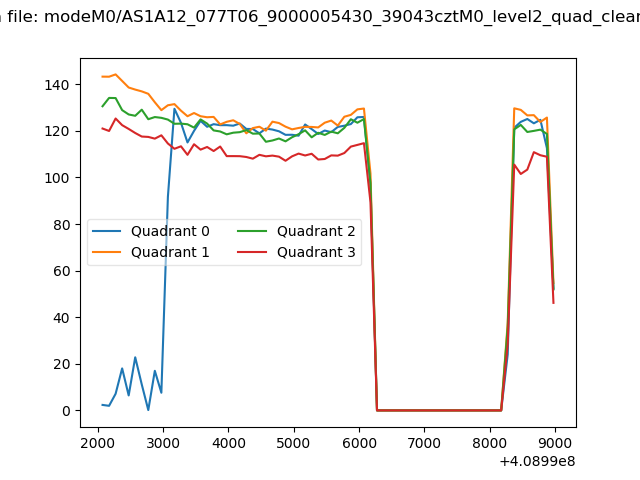 |
|
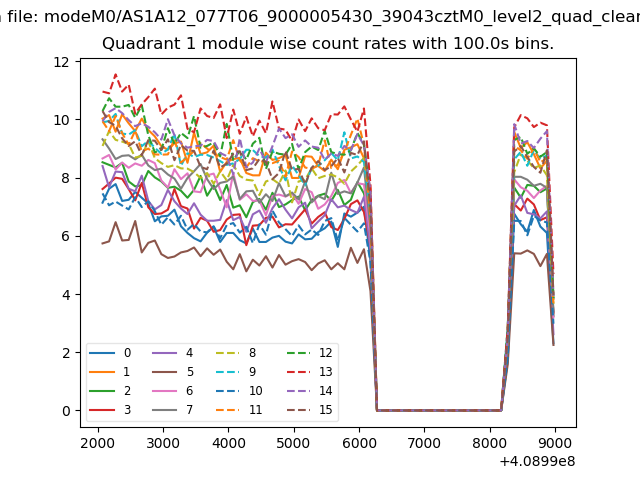
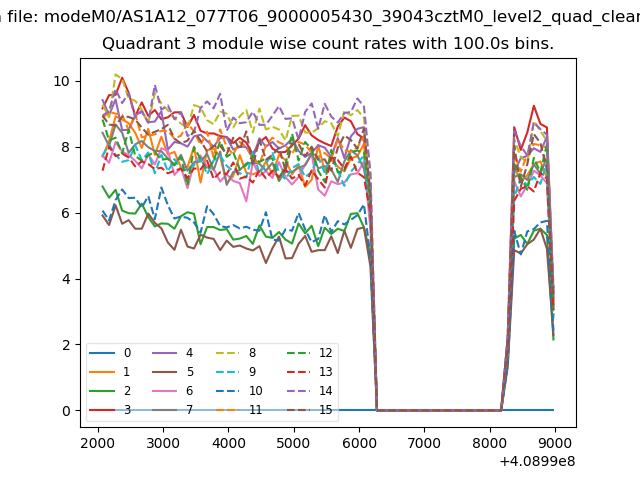
| Module-wise count rates for Quadrant A Data is divided into 100 sec bins |
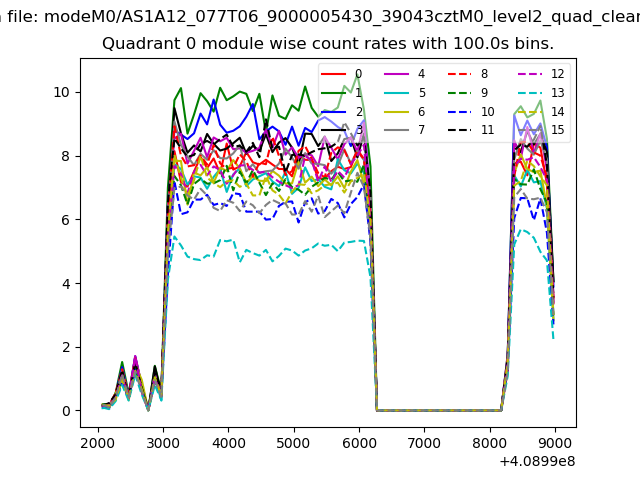 |
 |
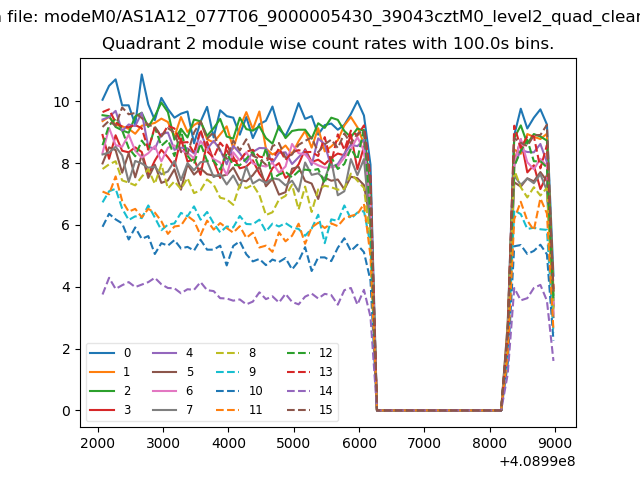
| Module-wise count rates for Quadrant B Data is divided into 100 sec bins |
 |
 |
| Module-wise count rates for Quadrant C Data is divided into 100 sec bins |
 |
 |
| Module-wise count rates for Quadrant D Data is divided into 100 sec bins |
 |
 |
| Parameter | Plot |
|---|---|
| CZT HV Monitor | 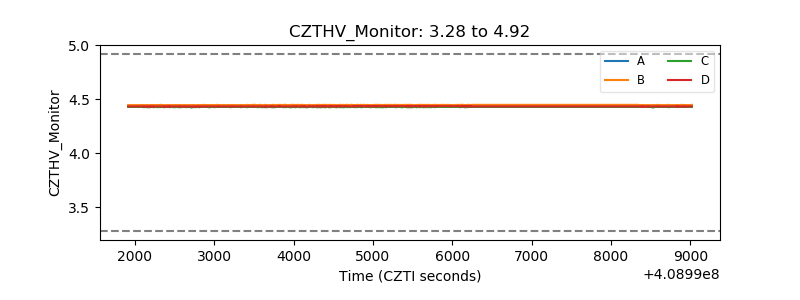 |
| D_VDD | 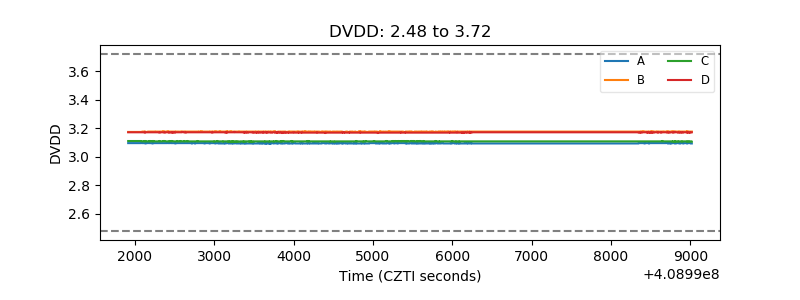 |
| Temperature 1 | 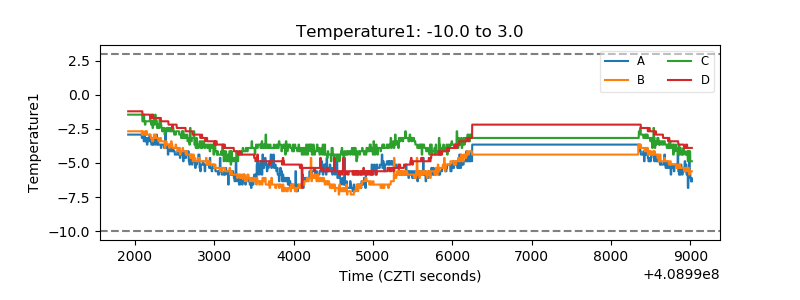 |
| Veto HV Monitor | 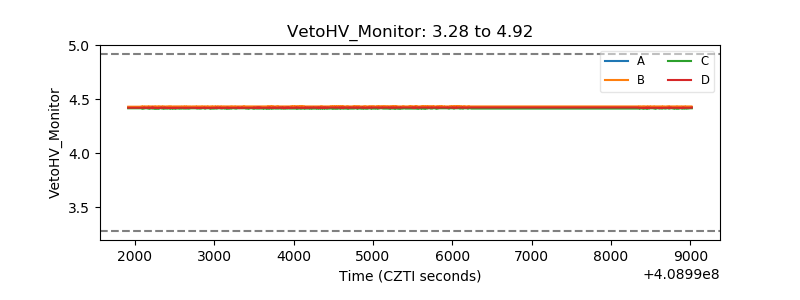 |
| Veto LLD | 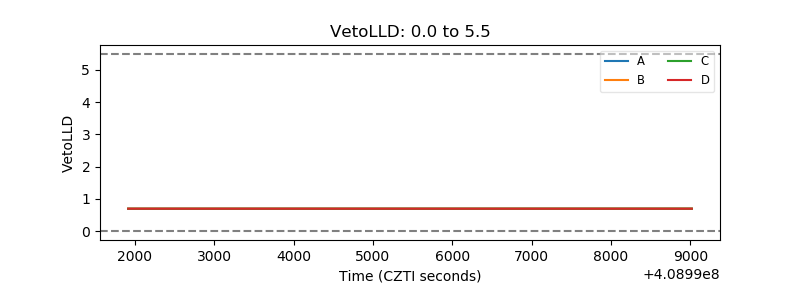 |
| Alpha Counter | 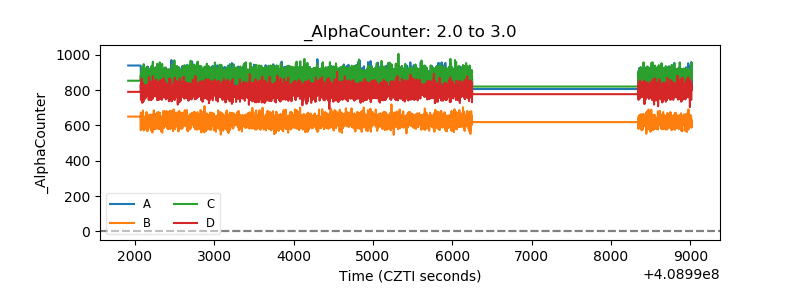 |
| _CPM_Rate | 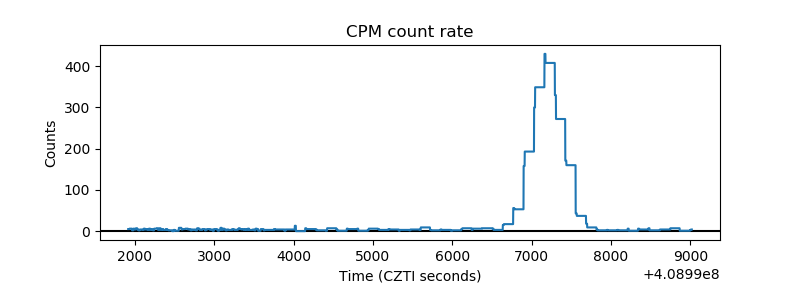 |
| CZT Counter | 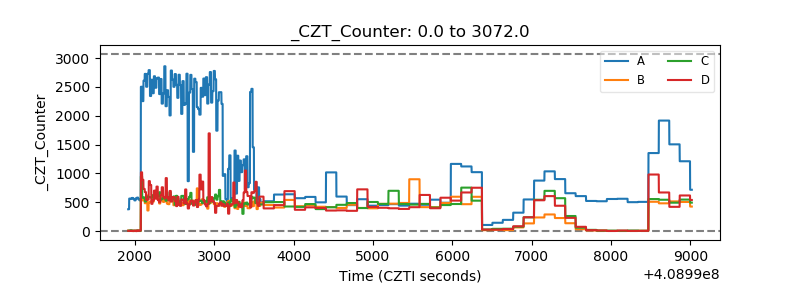 |
| +2.5 Volts monitor | 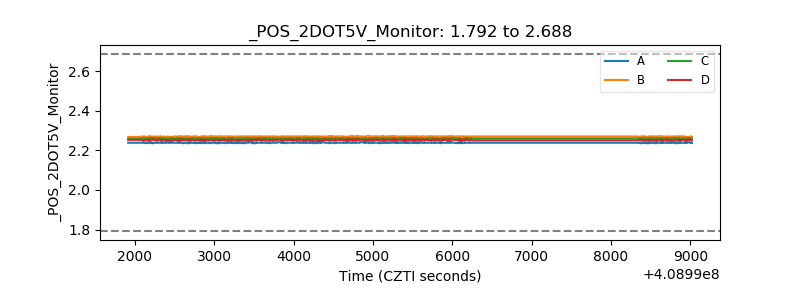 |
| +5 Volts monitor | 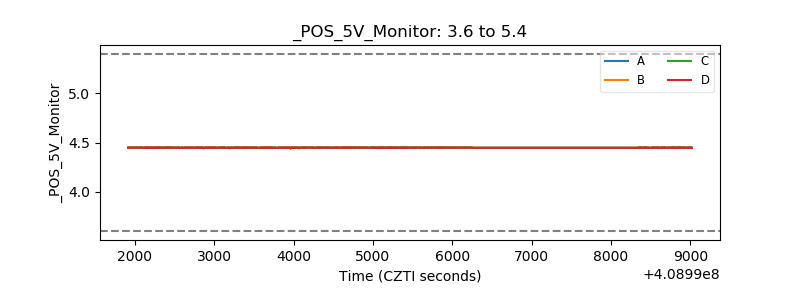 |
| _ROLL_ROT | 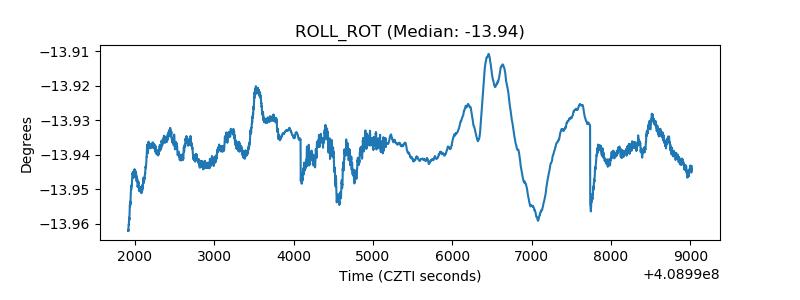 |
| _Roll_DEC | 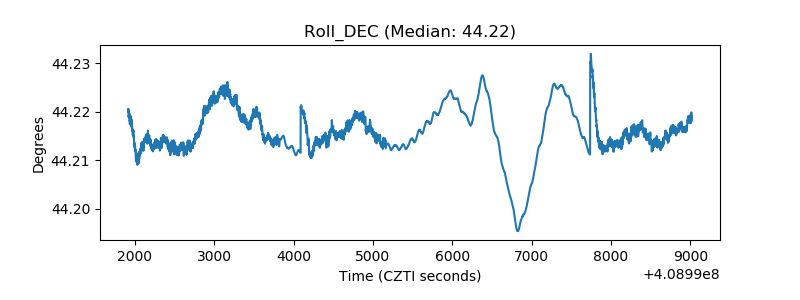 |
| _Roll_RA | 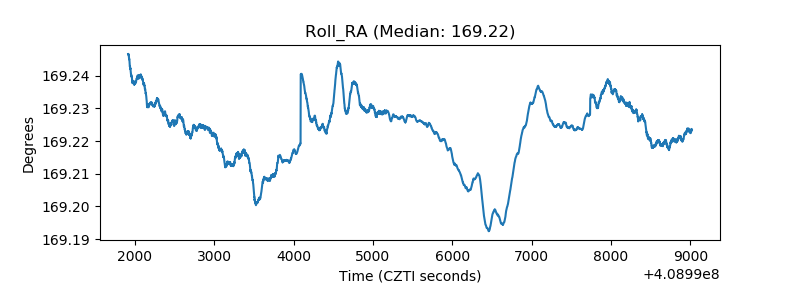 |
| Veto Counter | 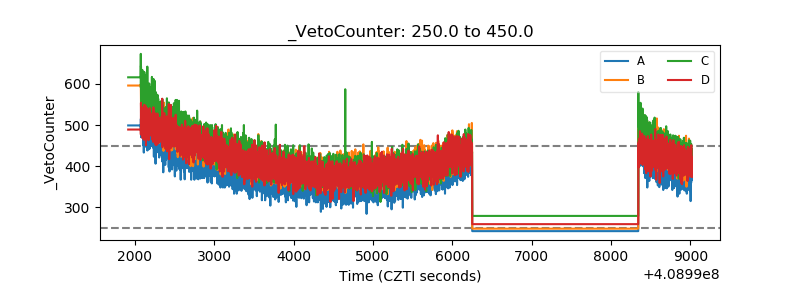 |