| Param | Original file | Final file |
|---|---|---|
| Filename | modeM0/AS1A12_077T06_9000005430_39044cztM0_level2.fits | modeM0/AS1A12_077T06_9000005430_39044cztM0_level2_quad_clean.evt |
| Size (bytes) | 348,030,720 | 91,834,560 |
| Size | 331.9 MB | 87.6 MB |
| Events in quadrant A | 4,123,593 | 609,517 |
| Events in quadrant B | 2,658,516 | 633,413 |
| Events in quadrant C | 2,554,265 | 612,054 |
| Events in quadrant D | 3,133,364 | 554,313 |
| Mode M9 | |||
|---|---|---|---|
| Quadrant | BADHDUFLAG | Total packets | Discarded packets |
| A | 0 | 40 | 0 |
| B | 0 | 40 | 0 |
| C | 0 | 40 | 0 |
| D | 0 | 40 | 0 |
| Mode M0 | |||
|---|---|---|---|
| Quadrant | BADHDUFLAG | Total packets | Discarded packets |
| A | 0 | 15872 | 2 |
| B | 0 | 11334 | 1 |
| C | 0 | 10837 | 1 |
| D | 0 | 13184 | 1 |
| Mode SS | |||
|---|---|---|---|
| Quadrant | BADHDUFLAG | Total packets | Discarded packets |
| A | 0 | 110 | 0 |
| B | 0 | 110 | 0 |
| C | 0 | 110 | 0 |
| D | 0 | 110 | 0 |
| Quadrant | Total seconds | Saturated seconds | Saturation percentage |
|---|---|---|---|
| A | 5306 | 179 | 3.373539% |
| B | 5306 | 42 | 0.791557% |
| C | 5306 | 11 | 0.207312% |
| D | 5306 | 180 | 3.392386% |
Noise dominated data is calculated using 1-second bins in cleaned event files. If a bin has >2000 counts, and if more than 50% of those come from <1% of pixels, then it is considered to be noise-dominated and hence unusable.
| Quadrant | # 1 sec bins | Bins with >0 counts | Bins with >2000 counts | High rate bins dominated by noise | Noise dominated (total time) | Noise dominated (detector-on time) | Marked lightcurve |
|---|---|---|---|---|---|---|---|
| A | 9282 | 5308 | 155 | 155 | 1.67% | 2.92% | 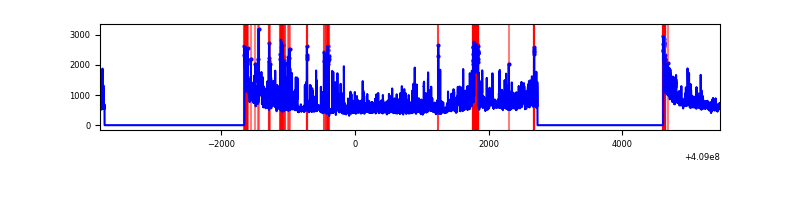 |
| B | 9282 | 5308 | 26 | 26 | 0.28% | 0.49% | 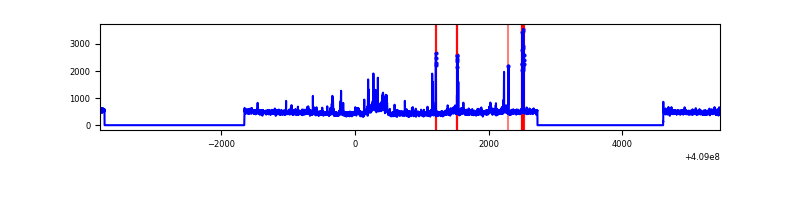 |
| C | 9282 | 5308 | 8 | 8 | 0.09% | 0.15% | 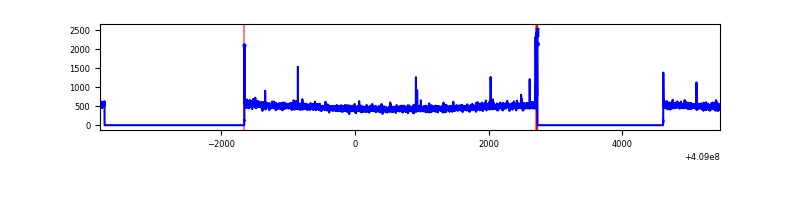 |
| D | 9282 | 5308 | 147 | 147 | 1.58% | 2.77% | 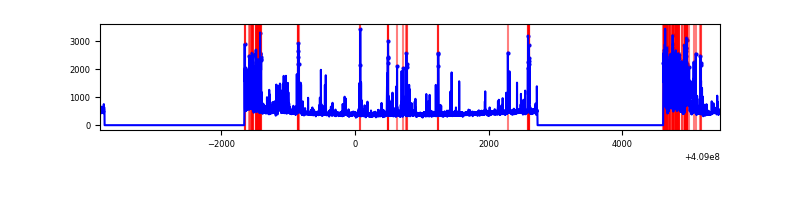 |
Top three noisy pixels from each quadrant. If the there are fewer than three noisy pixels in the level2.evt file, extra rows are filled as -1
| Pixel properties | Quadrant properties | ||||||
|---|---|---|---|---|---|---|---|
| Quadrant | DetID | PixID | Counts | Sigma | Mean | Median | Sigma |
| A | 15 | 222 | 1300358 | 10997.65 | 587 | 577 | 118.2 |
| A | 10 | 83 | 401429 | 3391.67 | 587 | 577 | 118.2 |
| A | 6 | 10 | 59312 | 496.97 | 587 | 577 | 118.2 |
| B | 0 | 190 | 166732 | 1457.55 | 590 | 574 | 114.0 |
| B | 5 | 184 | 101988 | 889.61 | 590 | 574 | 114.0 |
| B | 5 | 172 | 51683 | 448.33 | 590 | 574 | 114.0 |
| C | 15 | 214 | 221859 | 1619.47 | 585 | 590 | 136.6 |
| C | 14 | 254 | 30899 | 221.83 | 585 | 590 | 136.6 |
| C | 15 | 208 | 10354 | 71.46 | 585 | 590 | 136.6 |
| D | 1 | 47 | 392339 | 2755.1 | 575 | 559 | 142.2 |
| D | 12 | 227 | 297661 | 2089.3 | 575 | 559 | 142.2 |
| D | 2 | 249 | 132467 | 927.61 | 575 | 559 | 142.2 |
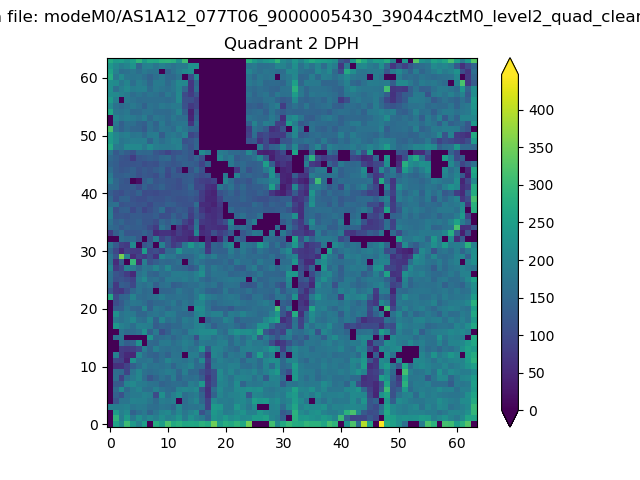
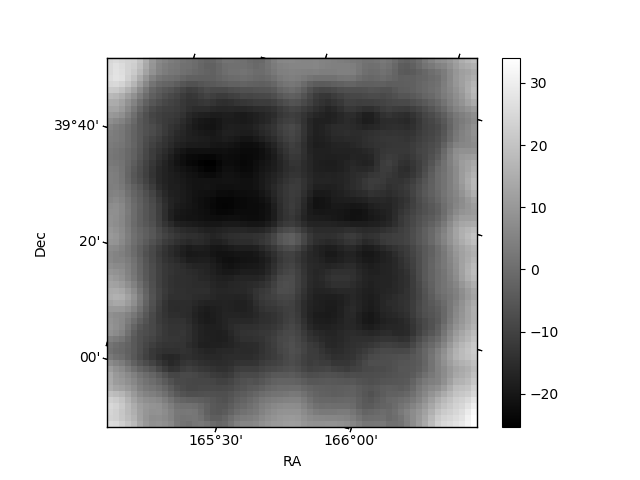
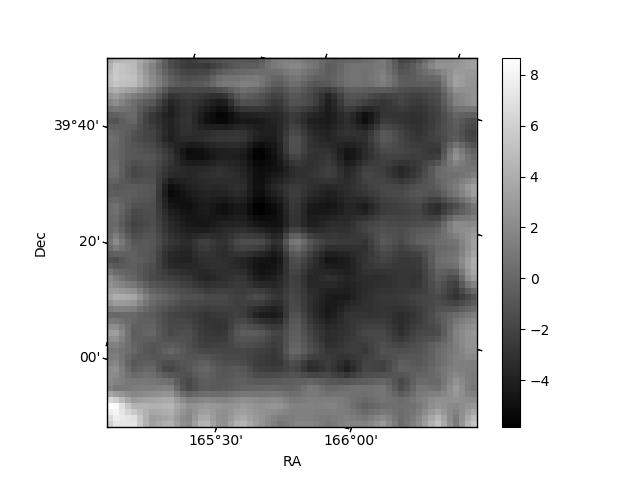
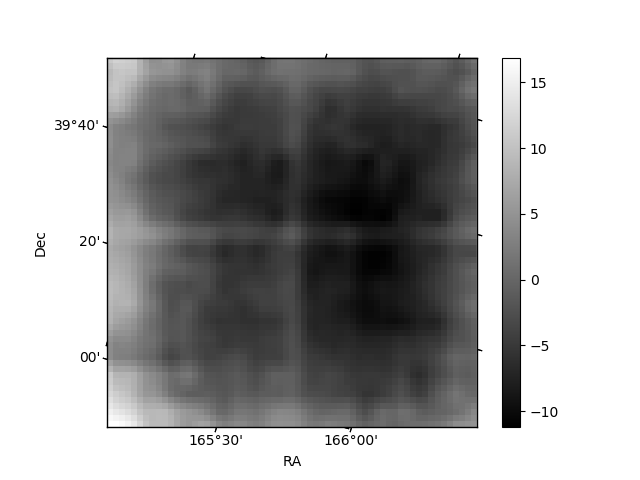
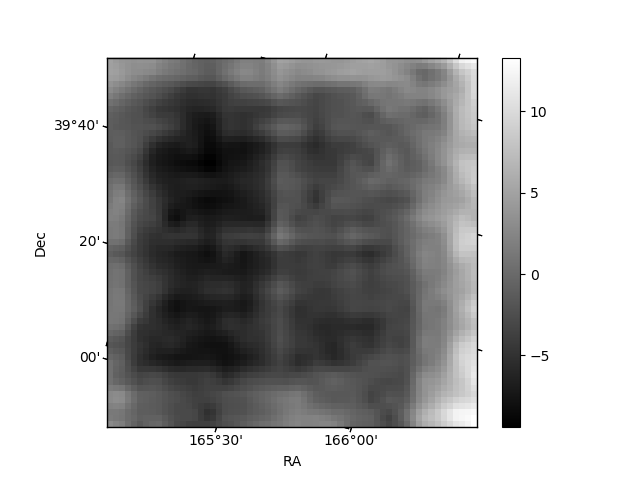
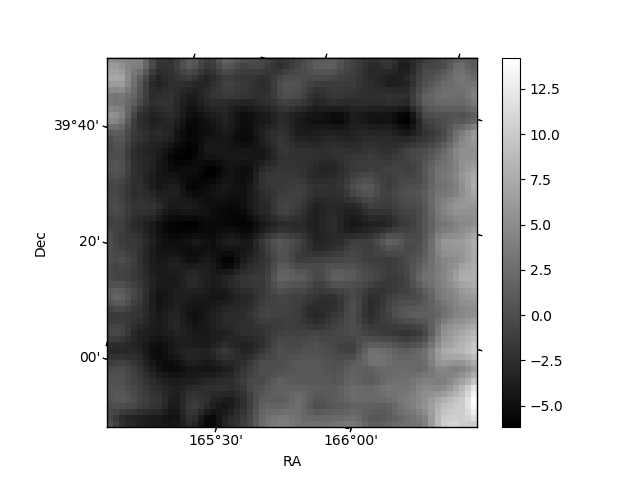
Histogram calculated using DETX and DETY for each event in the final _common_clean file
| Quadrant A | 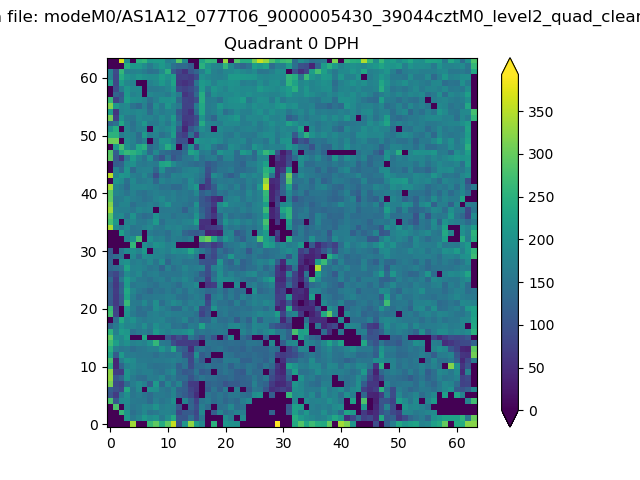 |
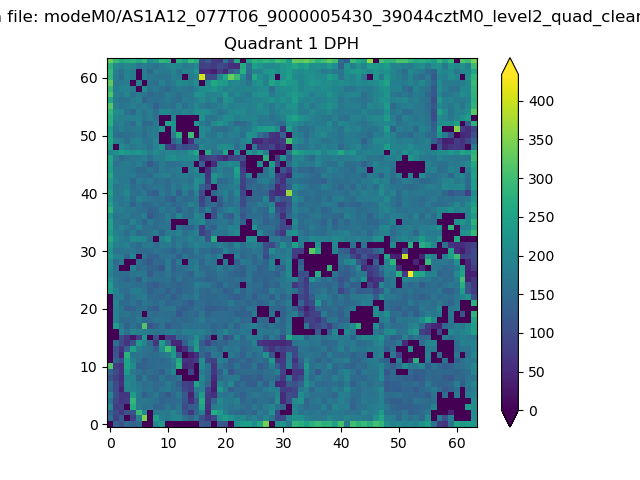 |
Quadrant B |
|---|---|---|---|
| Quadrant D | 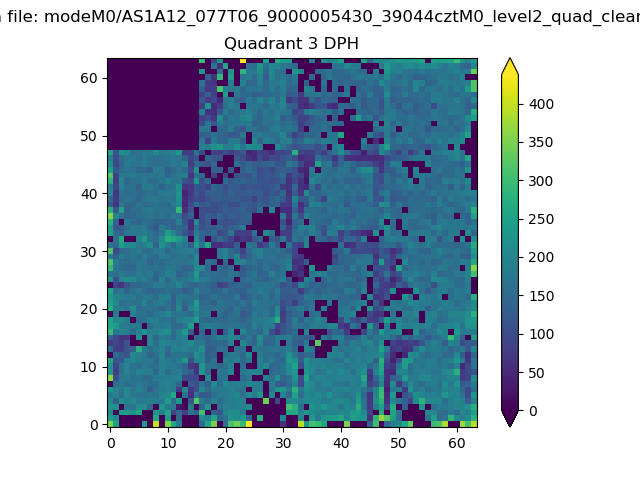 |
 |
Quadrant C |
| Plot type | Count rate plots | Images |
|---|---|---|
| Comparison with Poisson distribution Blue bars denote a histogram of data divided into 1 sec bins. Red curve is a Poisson curve with rate = median count rate of data. |
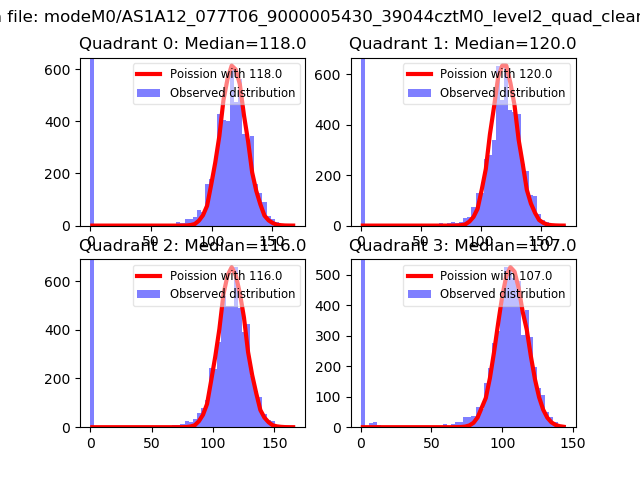 |
 |
| Quadrant-wise count rates Data is divided into 100 sec bins |
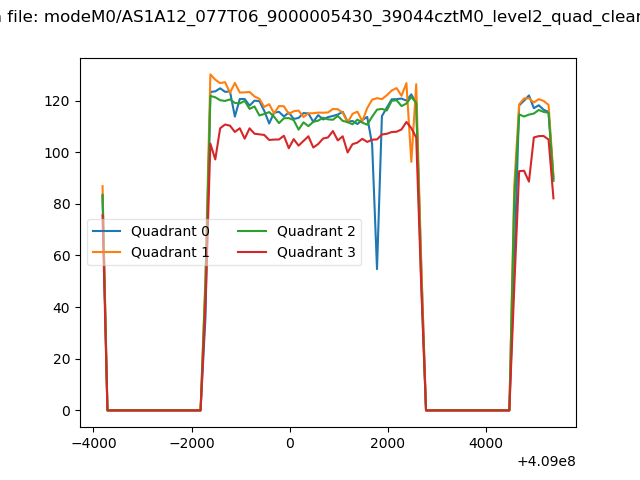 |
|
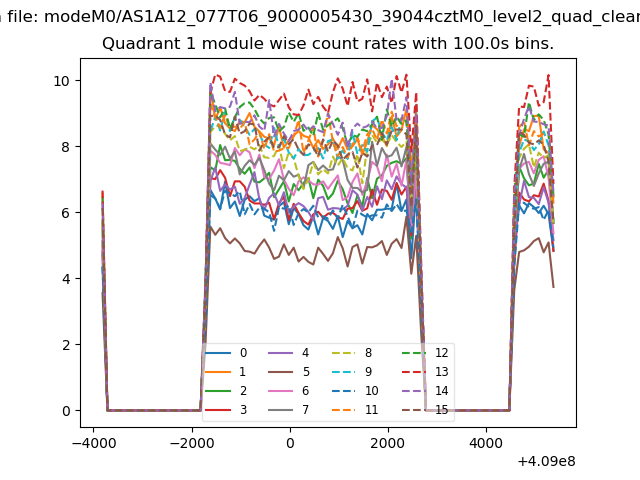
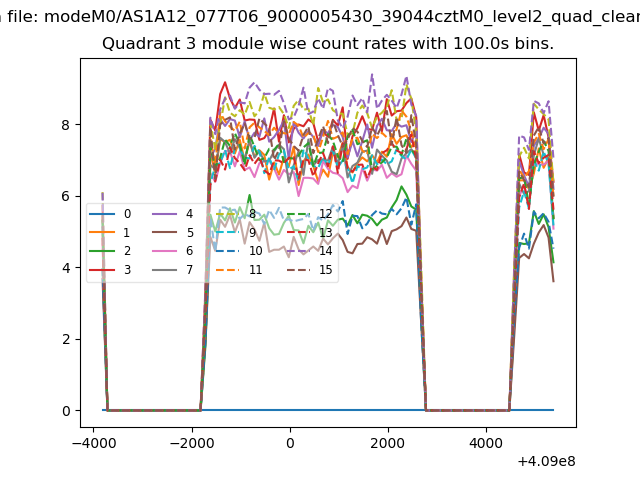
| Module-wise count rates for Quadrant A Data is divided into 100 sec bins |
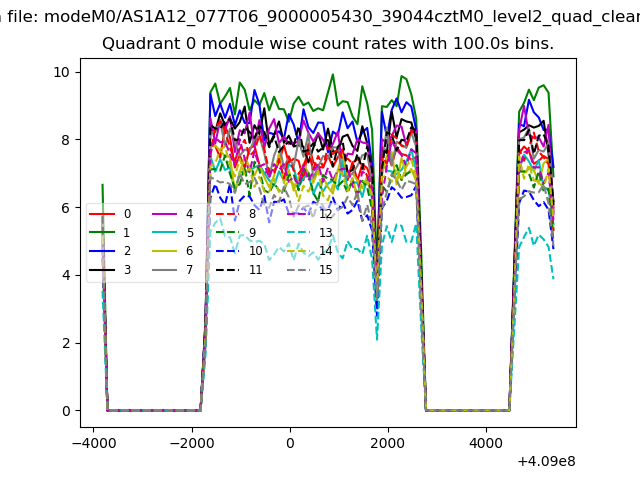 |
 |
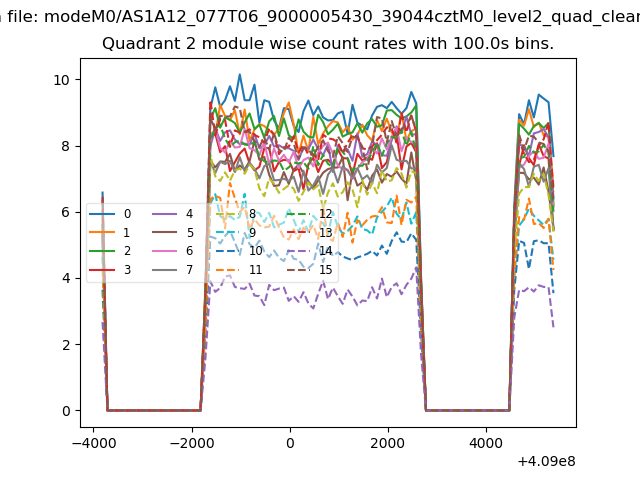
| Module-wise count rates for Quadrant B Data is divided into 100 sec bins |
 |
 |
| Module-wise count rates for Quadrant C Data is divided into 100 sec bins |
 |
 |
| Module-wise count rates for Quadrant D Data is divided into 100 sec bins |
 |
 |
| Parameter | Plot |
|---|---|
| CZT HV Monitor | 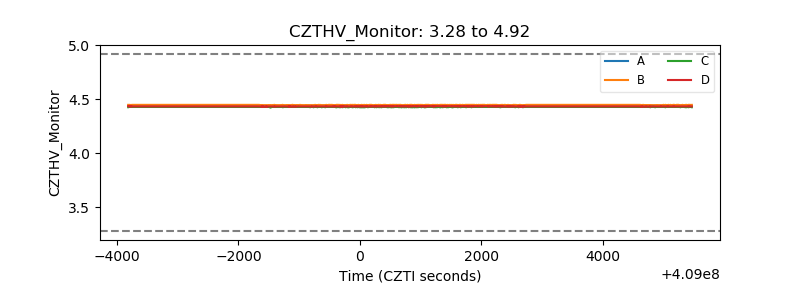 |
| D_VDD | 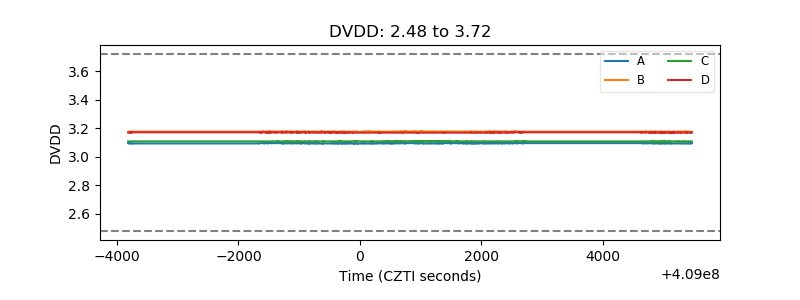 |
| Temperature 1 | 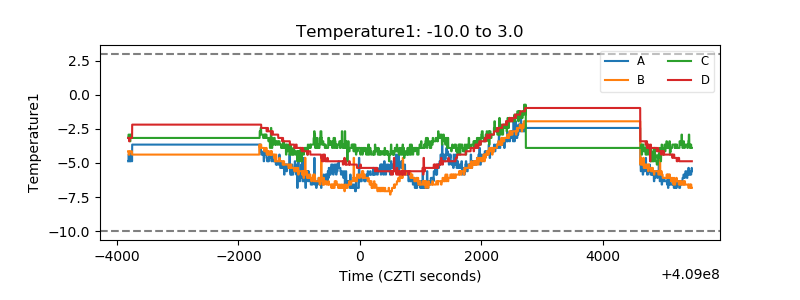 |
| Veto HV Monitor | 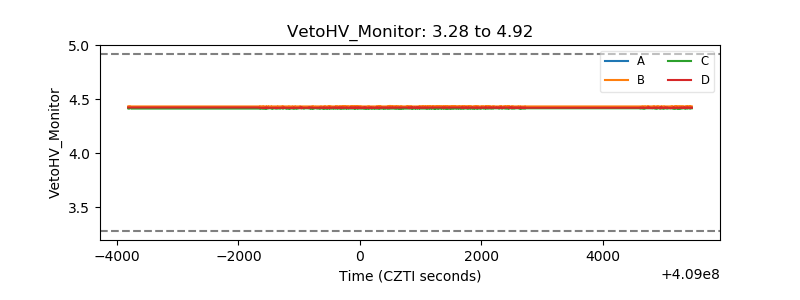 |
| Veto LLD | 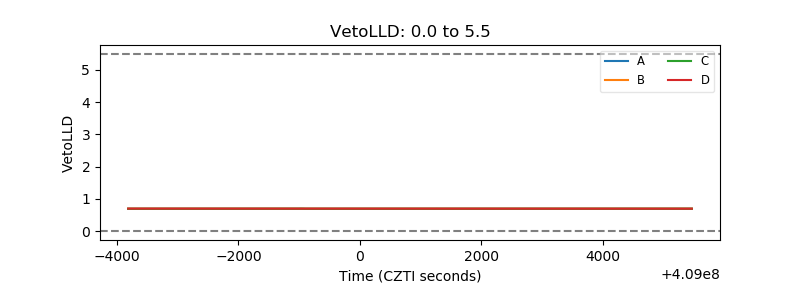 |
| Alpha Counter | 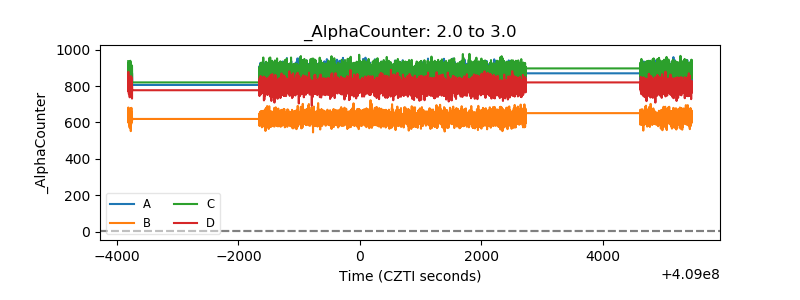 |
| _CPM_Rate | 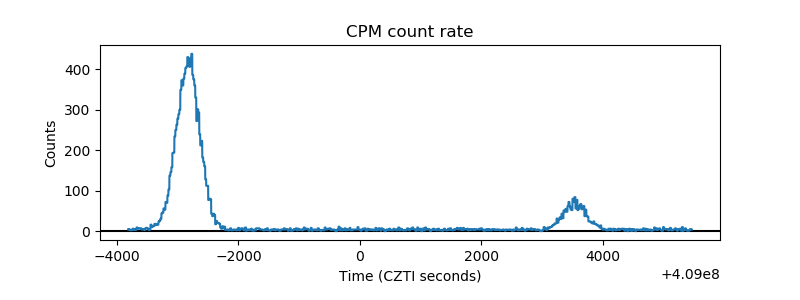 |
| CZT Counter | 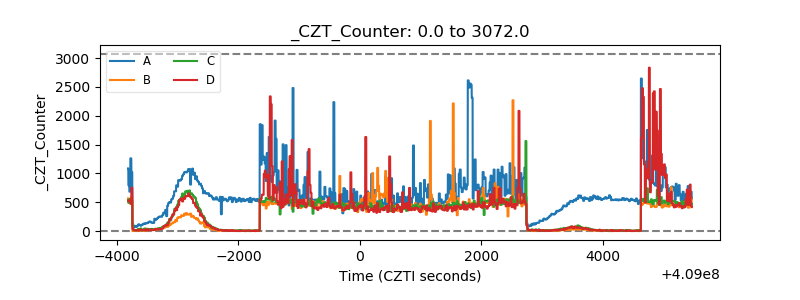 |
| +2.5 Volts monitor | 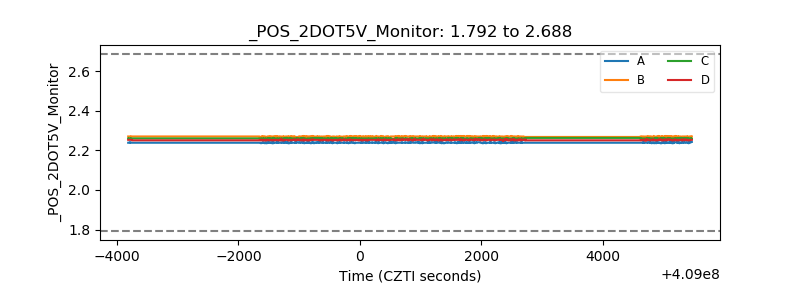 |
| +5 Volts monitor | 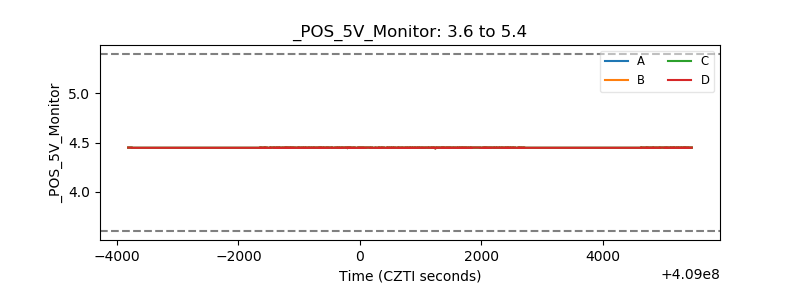 |
| _ROLL_ROT | 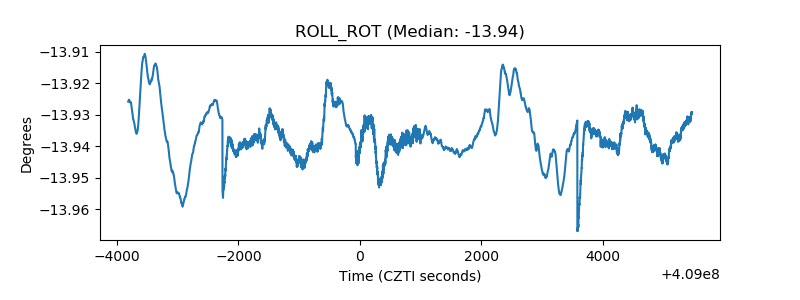 |
| _Roll_DEC | 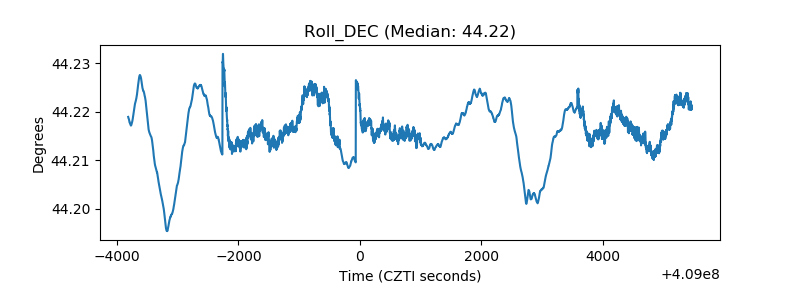 |
| _Roll_RA | 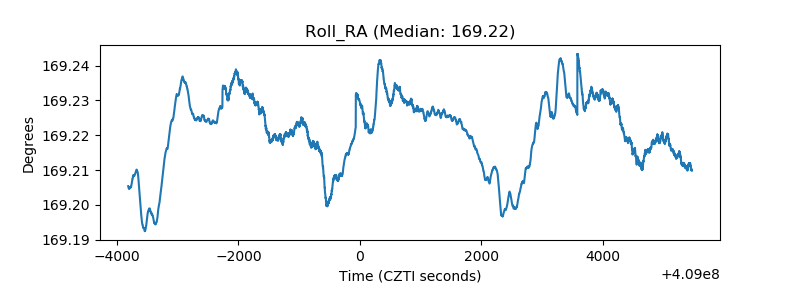 |
| Veto Counter | 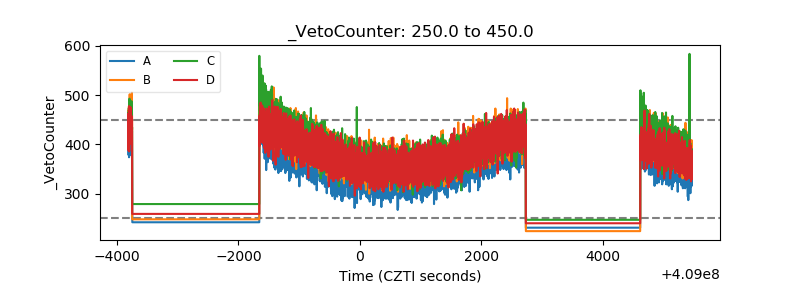 |