| Param | Original file | Final file |
|---|---|---|
| Filename | modeM0/AS1A12_077T06_9000005430_39045cztM0_level2.fits | modeM0/AS1A12_077T06_9000005430_39045cztM0_level2_quad_clean.evt |
| Size (bytes) | 439,689,600 | 91,419,840 |
| Size | 419.3 MB | 87.2 MB |
| Events in quadrant A | 6,881,620 | 542,412 |
| Events in quadrant B | 2,638,945 | 649,076 |
| Events in quadrant C | 2,788,236 | 623,976 |
| Events in quadrant D | 3,533,864 | 562,986 |
| Mode M9 | |||
|---|---|---|---|
| Quadrant | BADHDUFLAG | Total packets | Discarded packets |
| A | 0 | 22 | 0 |
| B | 0 | 22 | 0 |
| C | 0 | 22 | 0 |
| D | 0 | 23 | 0 |
| Mode M0 | |||
|---|---|---|---|
| Quadrant | BADHDUFLAG | Total packets | Discarded packets |
| A | 0 | 24388 | 2 |
| B | 0 | 11615 | 1 |
| C | 0 | 11786 | 1 |
| D | 0 | 14439 | 1 |
| Mode SS | |||
|---|---|---|---|
| Quadrant | BADHDUFLAG | Total packets | Discarded packets |
| A | 0 | 112 | 0 |
| B | 0 | 112 | 0 |
| C | 0 | 112 | 0 |
| D | 0 | 112 | 0 |
| Quadrant | Total seconds | Saturated seconds | Saturation percentage |
|---|---|---|---|
| A | 5574 | 956 | 17.151058% |
| B | 5574 | 37 | 0.663796% |
| C | 5574 | 7 | 0.125583% |
| D | 5574 | 212 | 3.803373% |
Noise dominated data is calculated using 1-second bins in cleaned event files. If a bin has >2000 counts, and if more than 50% of those come from <1% of pixels, then it is considered to be noise-dominated and hence unusable.
| Quadrant | # 1 sec bins | Bins with >0 counts | Bins with >2000 counts | High rate bins dominated by noise | Noise dominated (total time) | Noise dominated (detector-on time) | Marked lightcurve |
|---|---|---|---|---|---|---|---|
| A | 7096 | 5575 | 970 | 970 | 13.67% | 17.40% | 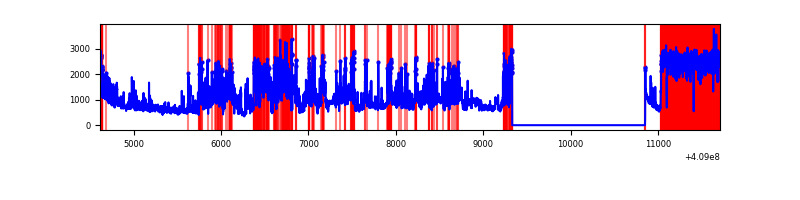 |
| B | 7096 | 5575 | 13 | 13 | 0.18% | 0.23% | 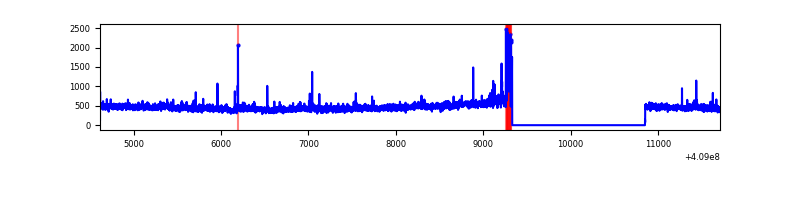 |
| C | 7096 | 5575 | 4 | 4 | 0.06% | 0.07% | 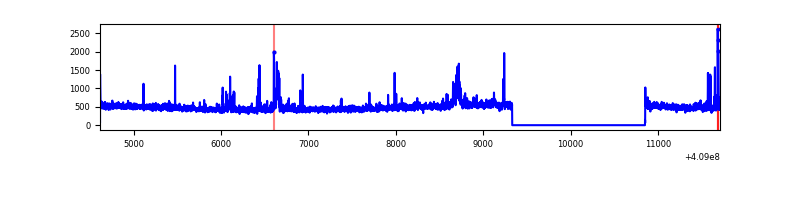 |
| D | 7096 | 5575 | 182 | 182 | 2.56% | 3.26% | 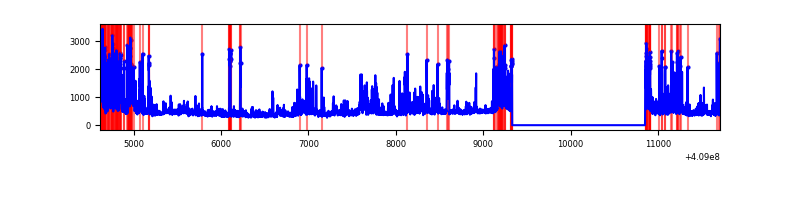 |
Top three noisy pixels from each quadrant. If the there are fewer than three noisy pixels in the level2.evt file, extra rows are filled as -1
| Pixel properties | Quadrant properties | ||||||
|---|---|---|---|---|---|---|---|
| Quadrant | DetID | PixID | Counts | Sigma | Mean | Median | Sigma |
| A | 15 | 222 | 3963278 | 33893.88 | 579 | 568 | 116.9 |
| A | 10 | 83 | 395377 | 3376.88 | 579 | 568 | 116.9 |
| A | 13 | 248 | 217812 | 1858.13 | 579 | 568 | 116.9 |
| B | 0 | 190 | 95882 | 804.34 | 613 | 596 | 118.5 |
| B | 5 | 172 | 82420 | 690.7 | 613 | 596 | 118.5 |
| B | 0 | 230 | 35307 | 293.01 | 613 | 596 | 118.5 |
| C | 15 | 214 | 233545 | 1650.4 | 603 | 607 | 141.1 |
| C | 15 | 208 | 71317 | 500.99 | 603 | 607 | 141.1 |
| C | 14 | 254 | 48590 | 339.97 | 603 | 607 | 141.1 |
| D | 1 | 47 | 572949 | 3945.08 | 592 | 577 | 145.1 |
| D | 12 | 227 | 396212 | 2726.92 | 592 | 577 | 145.1 |
| D | 2 | 249 | 88212 | 604.03 | 592 | 577 | 145.1 |
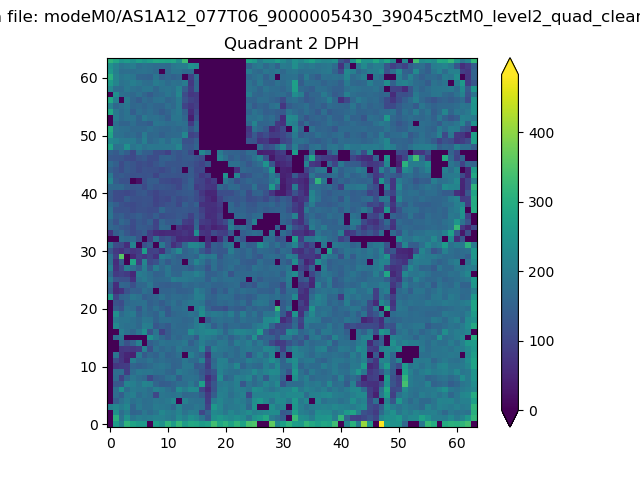
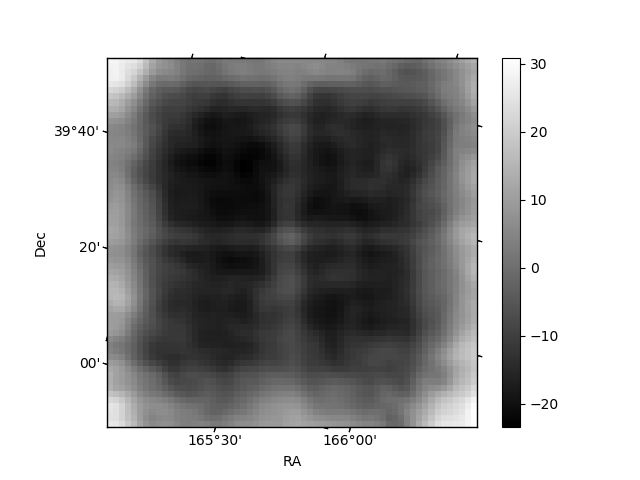
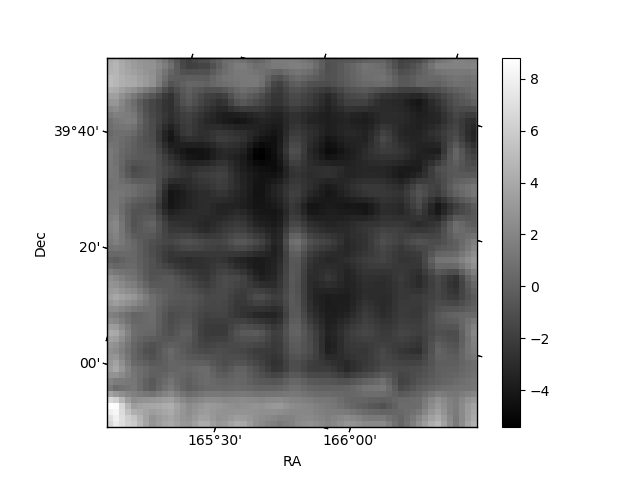
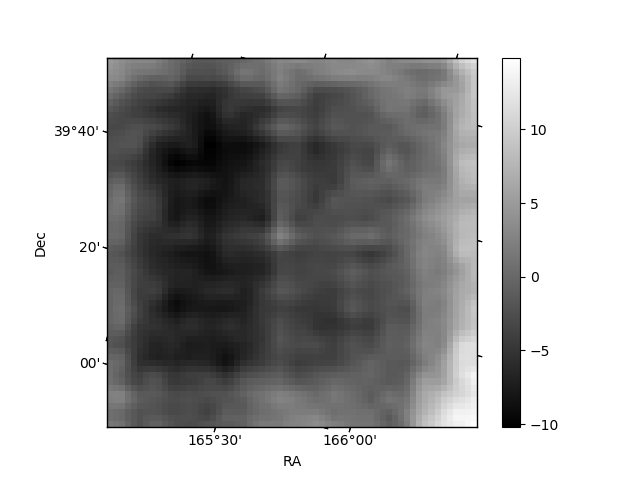
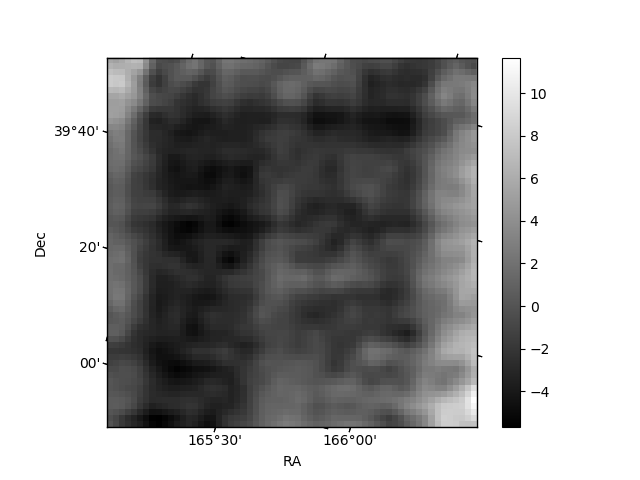
Histogram calculated using DETX and DETY for each event in the final _common_clean file
| Quadrant A | 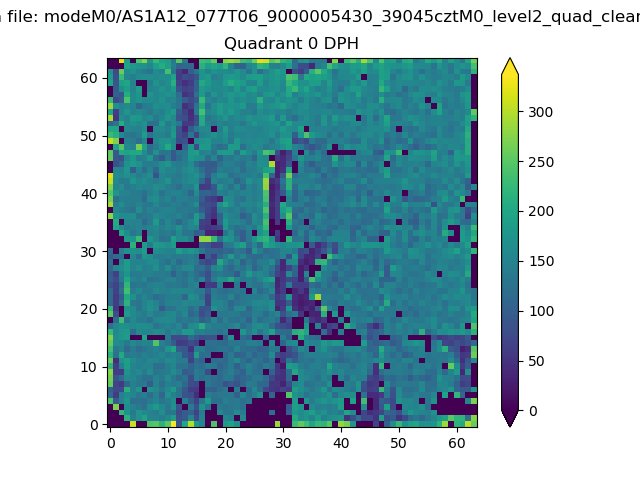 |
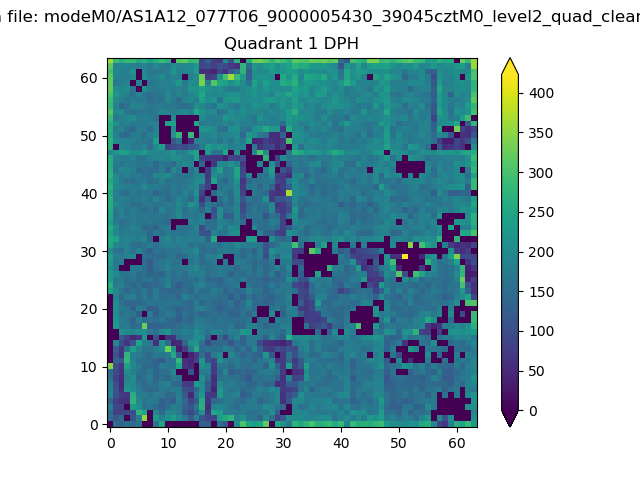 |
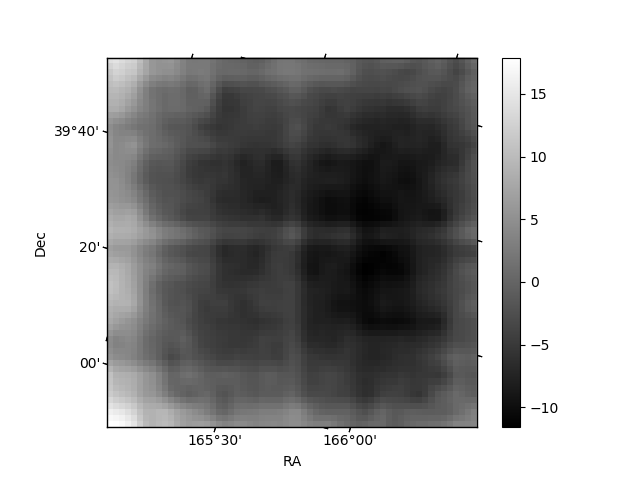
Quadrant B |
|---|---|---|---|
| Quadrant D | 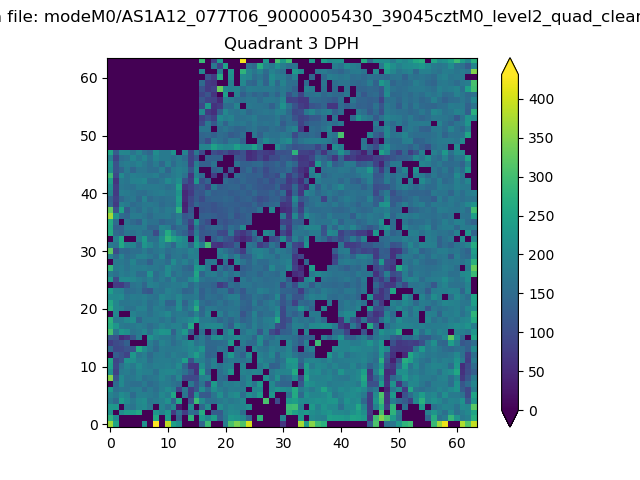 |
 |
Quadrant C |
| Plot type | Count rate plots | Images |
|---|---|---|
| Comparison with Poisson distribution Blue bars denote a histogram of data divided into 1 sec bins. Red curve is a Poisson curve with rate = median count rate of data. |
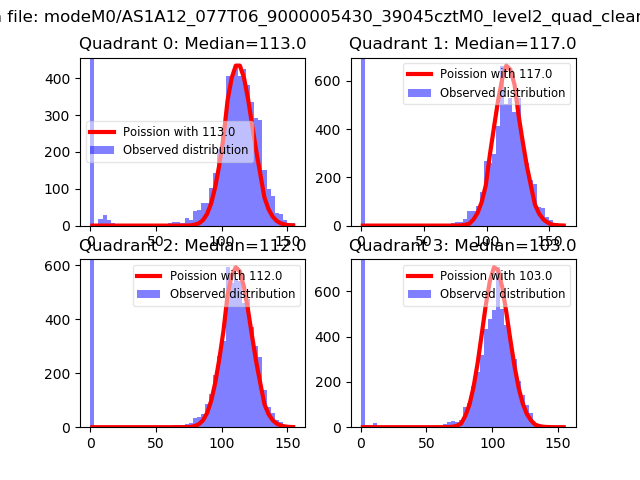 |
 |
| Quadrant-wise count rates Data is divided into 100 sec bins |
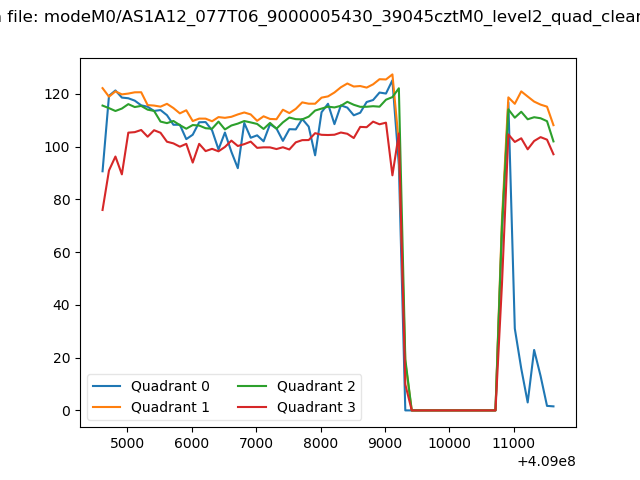 |
|
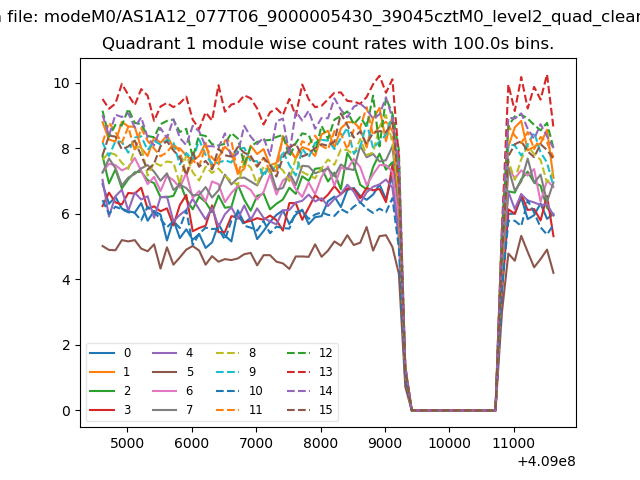
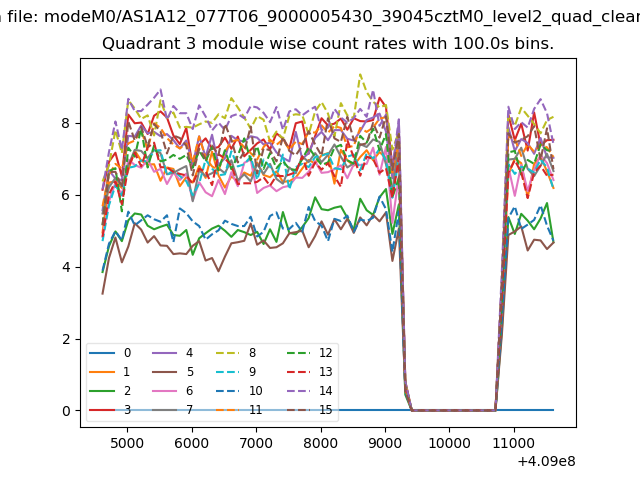
| Module-wise count rates for Quadrant A Data is divided into 100 sec bins |
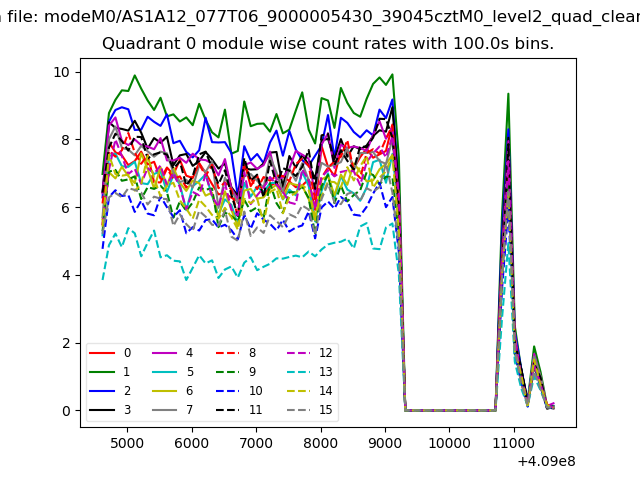 |
 |
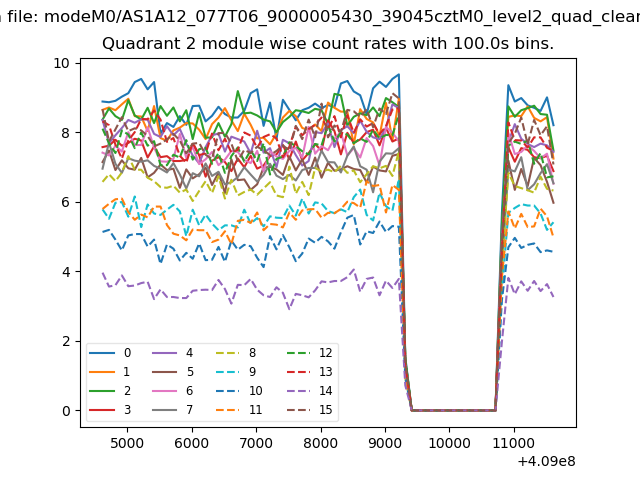
| Module-wise count rates for Quadrant B Data is divided into 100 sec bins |
 |
 |
| Module-wise count rates for Quadrant C Data is divided into 100 sec bins |
 |
 |
| Module-wise count rates for Quadrant D Data is divided into 100 sec bins |
 |
 |
| Parameter | Plot |
|---|---|
| CZT HV Monitor | 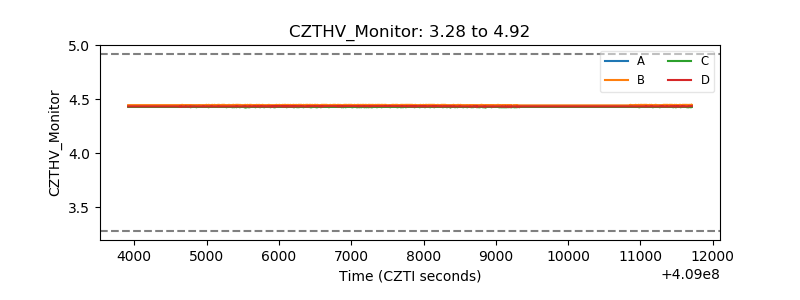 |
| D_VDD | 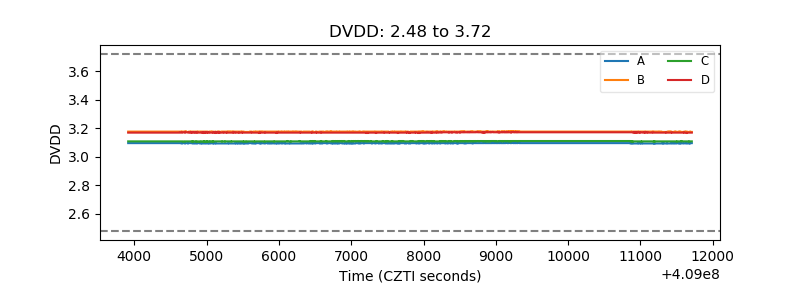 |
| Temperature 1 | 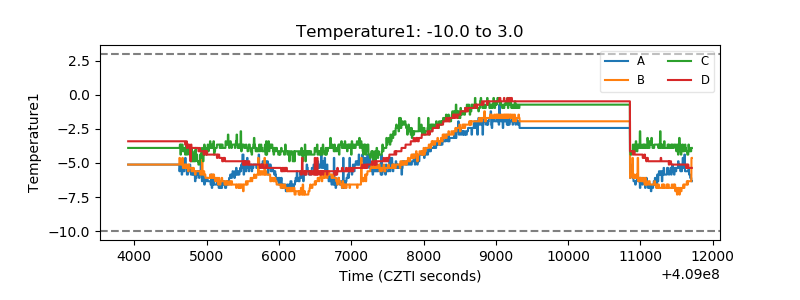 |
| Veto HV Monitor | 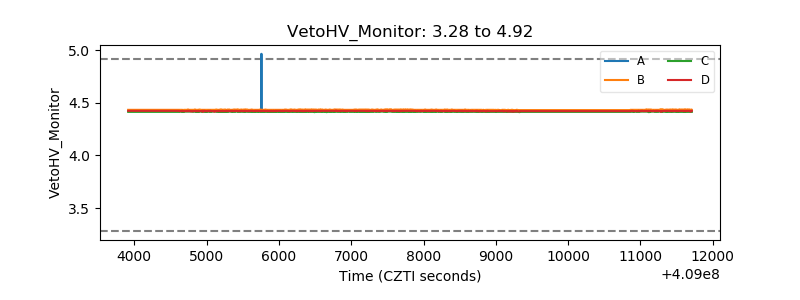 |
| Veto LLD | 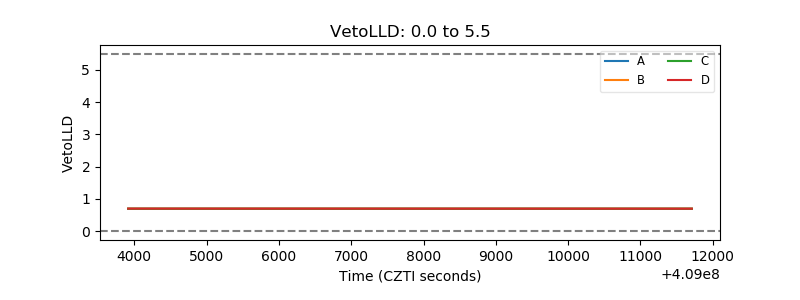 |
| Alpha Counter | 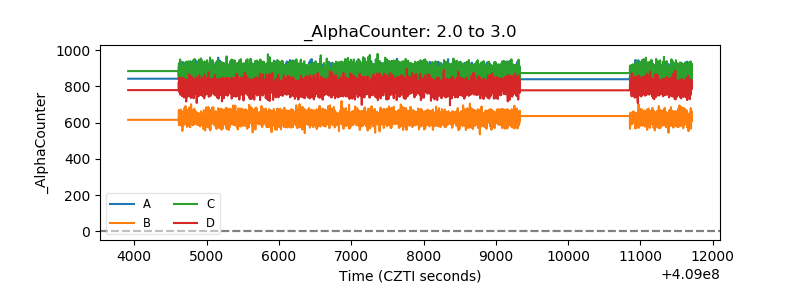 |
| _CPM_Rate | 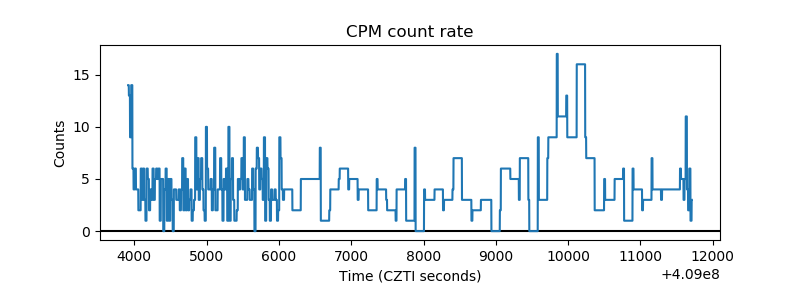 |
| CZT Counter | 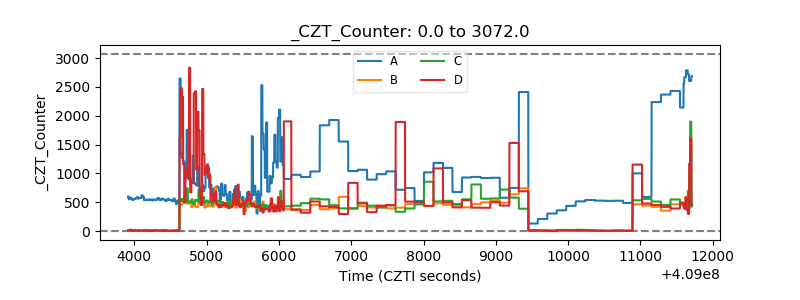 |
| +2.5 Volts monitor | 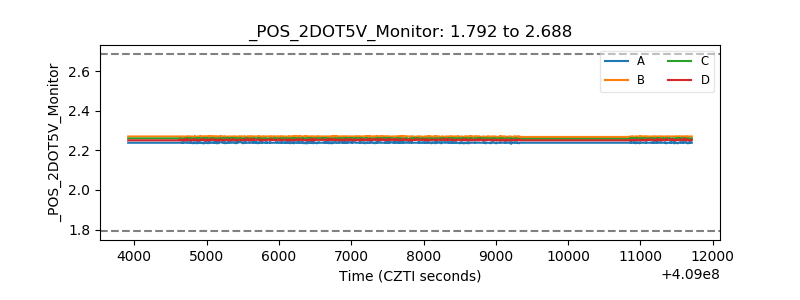 |
| +5 Volts monitor | 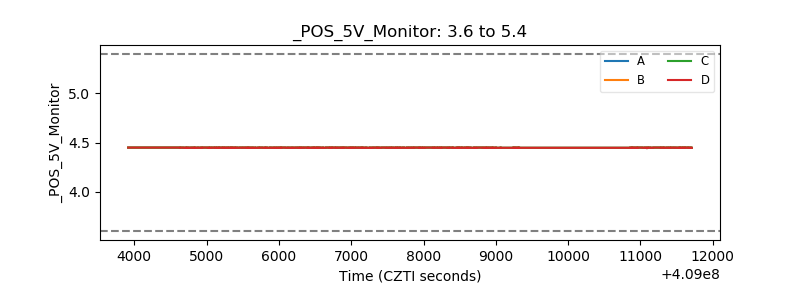 |
| _ROLL_ROT | 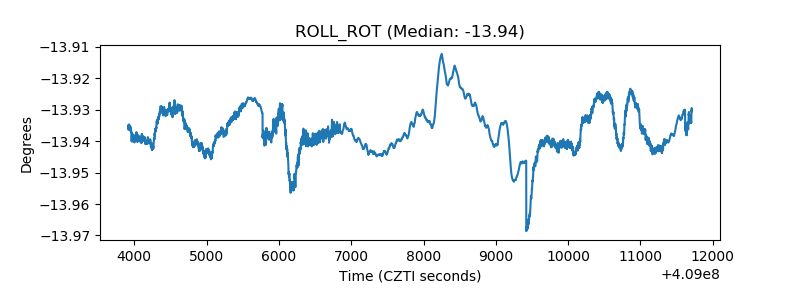 |
| _Roll_DEC | 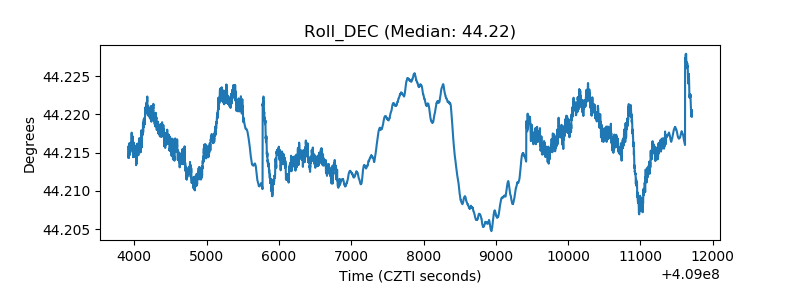 |
| _Roll_RA | 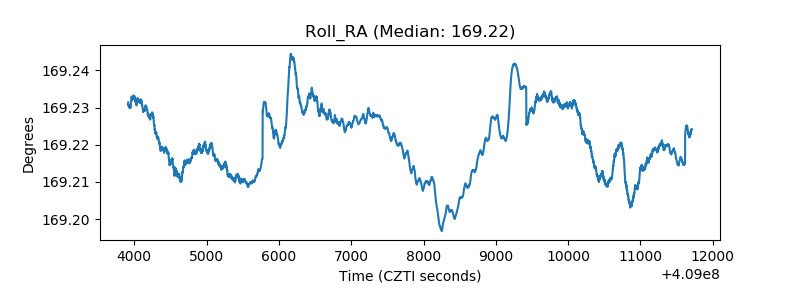 |
| Veto Counter | 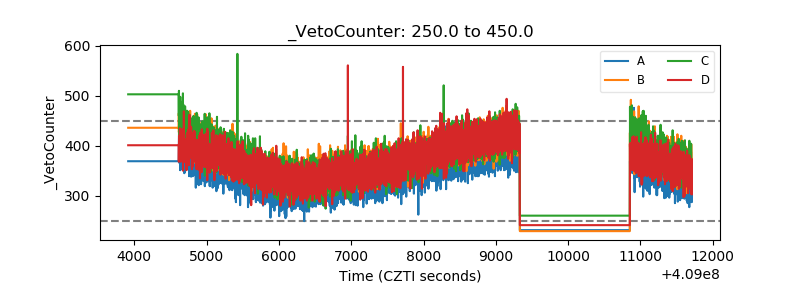 |