| Param | Original file | Final file |
|---|---|---|
| Filename | modeM0/AS1A12_077T06_9000005430_39046cztM0_level2.fits | modeM0/AS1A12_077T06_9000005430_39046cztM0_level2_quad_clean.evt |
| Size (bytes) | 655,597,440 | 79,035,840 |
| Size | 625.2 MB | 75.4 MB |
| Events in quadrant A | 14,446,333 | 58,675 |
| Events in quadrant B | 2,766,703 | 680,564 |
| Events in quadrant C | 2,883,147 | 647,223 |
| Events in quadrant D | 3,710,929 | 593,547 |
| Mode M9 | |||
|---|---|---|---|
| Quadrant | BADHDUFLAG | Total packets | Discarded packets |
| A | 0 | 26 | 0 |
| B | 0 | 26 | 0 |
| C | 0 | 26 | 0 |
| D | 0 | 27 | 0 |
| Mode M0 | |||
|---|---|---|---|
| Quadrant | BADHDUFLAG | Total packets | Discarded packets |
| A | 0 | 46927 | 3 |
| B | 0 | 12334 | 2 |
| C | 0 | 12371 | 2 |
| D | 0 | 15436 | 2 |
| Mode SS | |||
|---|---|---|---|
| Quadrant | BADHDUFLAG | Total packets | Discarded packets |
| A | 0 | 118 | 0 |
| B | 0 | 118 | 0 |
| C | 0 | 118 | 0 |
| D | 0 | 118 | 0 |
| Quadrant | Total seconds | Saturated seconds | Saturation percentage |
|---|---|---|---|
| A | 5919 | 5505 | 93.005575% |
| B | 5919 | 13 | 0.219632% |
| C | 5919 | 22 | 0.371684% |
| D | 5919 | 175 | 2.956581% |
Noise dominated data is calculated using 1-second bins in cleaned event files. If a bin has >2000 counts, and if more than 50% of those come from <1% of pixels, then it is considered to be noise-dominated and hence unusable.
| Quadrant | # 1 sec bins | Bins with >0 counts | Bins with >2000 counts | High rate bins dominated by noise | Noise dominated (total time) | Noise dominated (detector-on time) | Marked lightcurve |
|---|---|---|---|---|---|---|---|
| A | 7232 | 5920 | 5383 | 5383 | 74.43% | 90.93% | 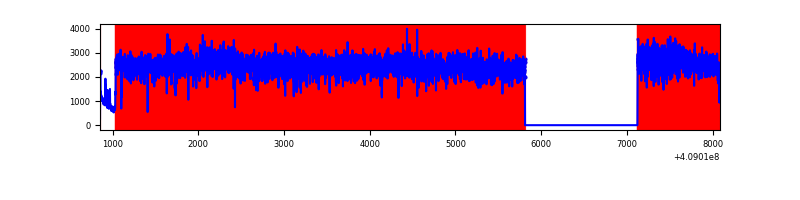 |
| B | 7232 | 5920 | 3 | 3 | 0.04% | 0.05% | 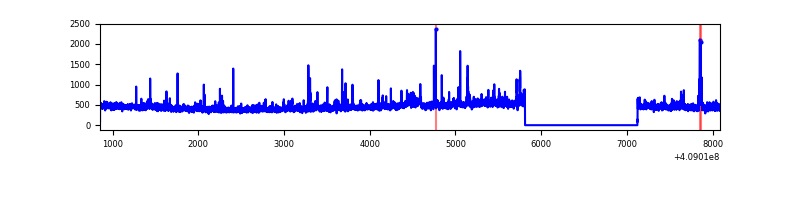 |
| C | 7232 | 5920 | 22 | 22 | 0.30% | 0.37% | 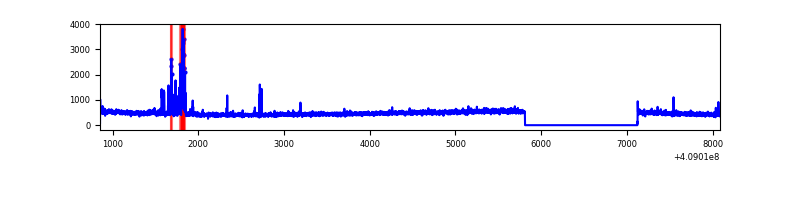 |
| D | 7232 | 5920 | 149 | 149 | 2.06% | 2.52% | 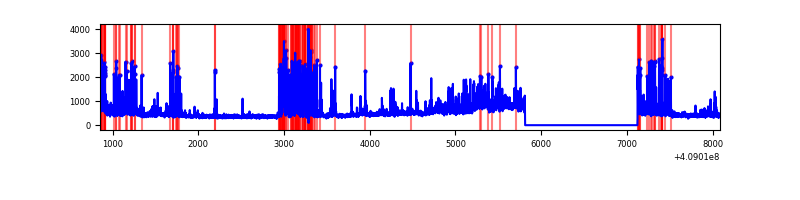 |
Top three noisy pixels from each quadrant. If the there are fewer than three noisy pixels in the level2.evt file, extra rows are filled as -1
| Pixel properties | Quadrant properties | ||||||
|---|---|---|---|---|---|---|---|
| Quadrant | DetID | PixID | Counts | Sigma | Mean | Median | Sigma |
| A | 15 | 222 | 12630441 | 163482.34 | 375 | 367 | 77.3 |
| A | 10 | 83 | 262529 | 3393.4 | 375 | 367 | 77.3 |
| A | 13 | 210 | 62887 | 809.25 | 375 | 367 | 77.3 |
| B | 0 | 190 | 145689 | 1162.6 | 648 | 628 | 124.8 |
| B | 0 | 230 | 23349 | 182.1 | 648 | 628 | 124.8 |
| B | 5 | 172 | 17900 | 138.43 | 648 | 628 | 124.8 |
| C | 15 | 214 | 245812 | 1646.99 | 635 | 638 | 148.9 |
| C | 15 | 208 | 146036 | 976.73 | 635 | 638 | 148.9 |
| C | 14 | 254 | 4438 | 25.53 | 635 | 638 | 148.9 |
| D | 2 | 249 | 497547 | 3225.07 | 628 | 610 | 154.1 |
| D | 1 | 47 | 326192 | 2112.99 | 628 | 610 | 154.1 |
| D | 12 | 227 | 267418 | 1731.56 | 628 | 610 | 154.1 |
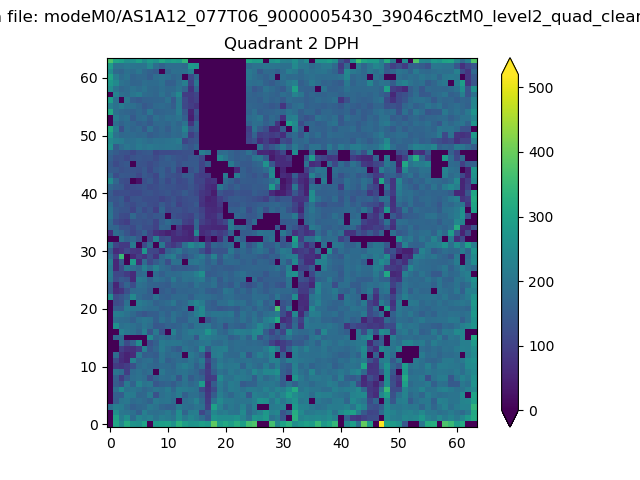
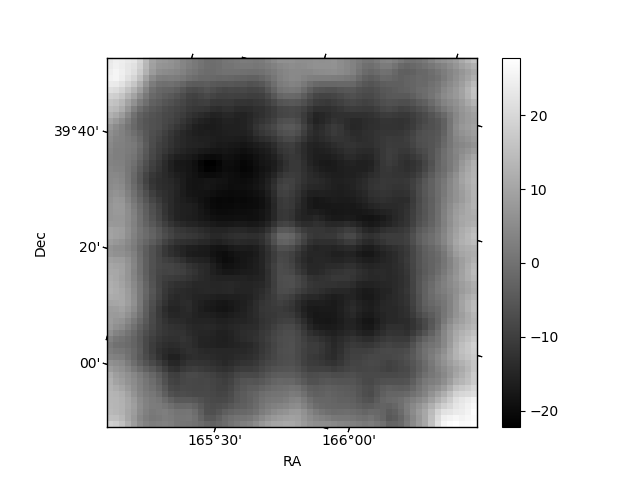
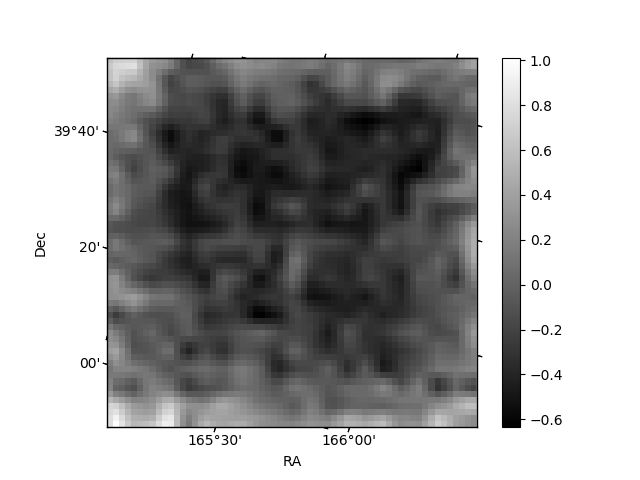
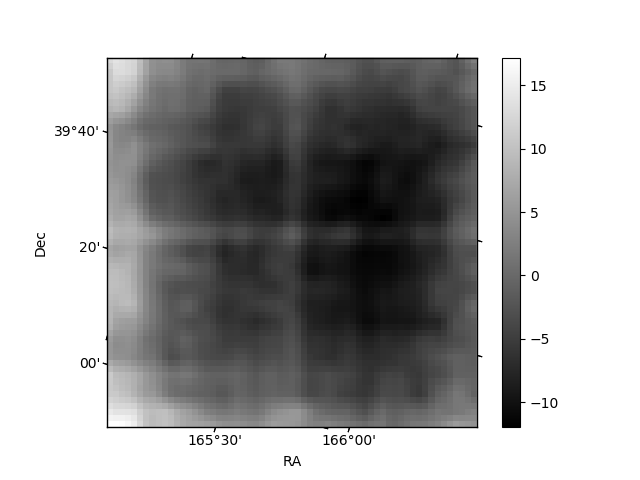
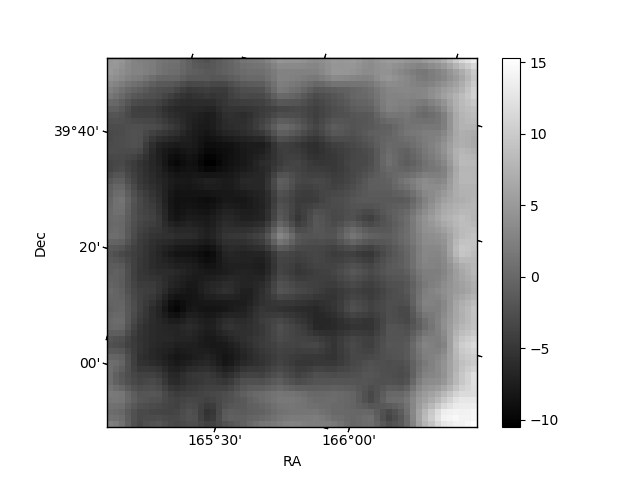
Histogram calculated using DETX and DETY for each event in the final _common_clean file
| Quadrant A | 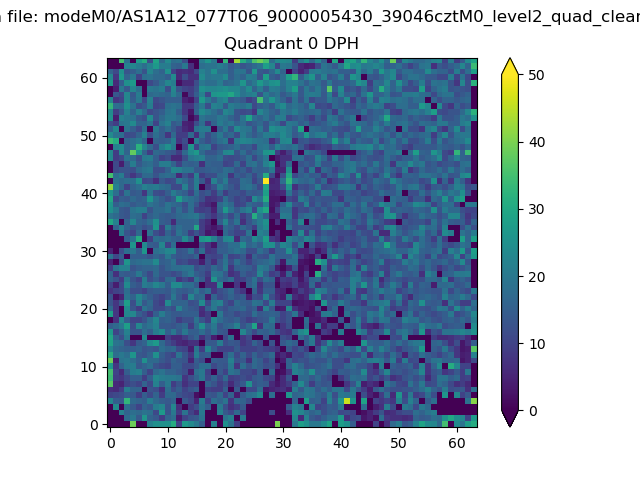 |
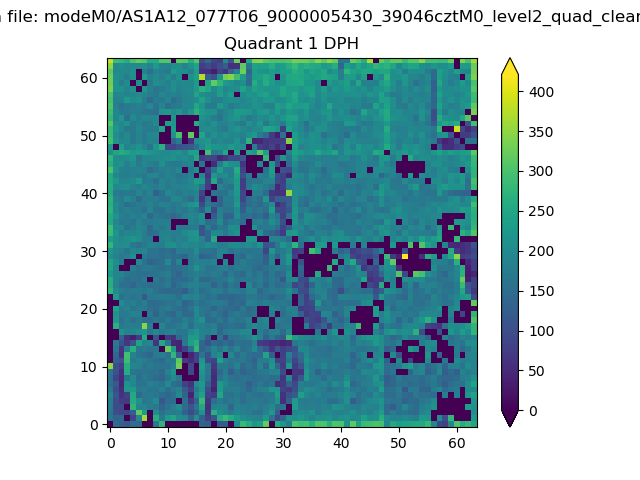 |
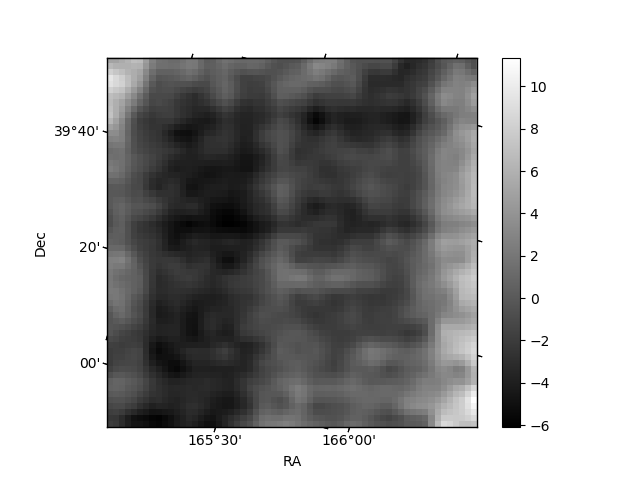
Quadrant B |
|---|---|---|---|
| Quadrant D | 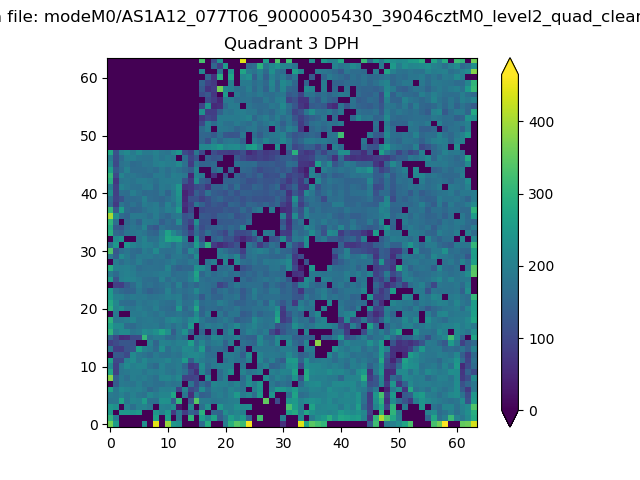 |
 |
Quadrant C |
| Plot type | Count rate plots | Images |
|---|---|---|
| Comparison with Poisson distribution Blue bars denote a histogram of data divided into 1 sec bins. Red curve is a Poisson curve with rate = median count rate of data. |
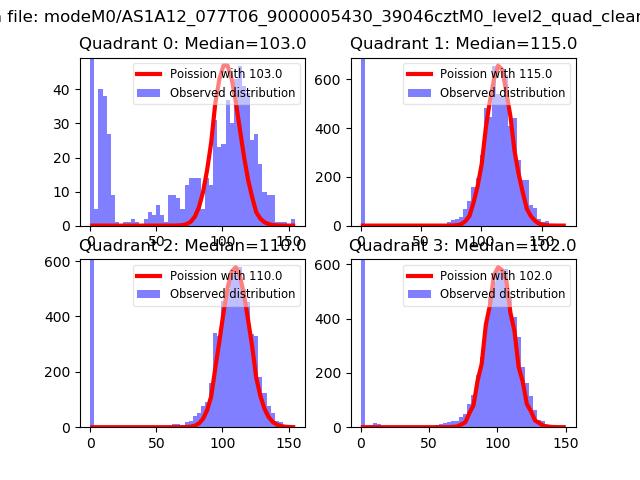 |
 |
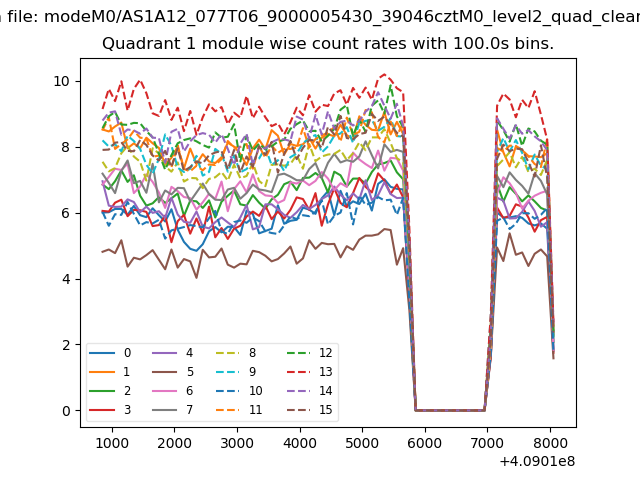
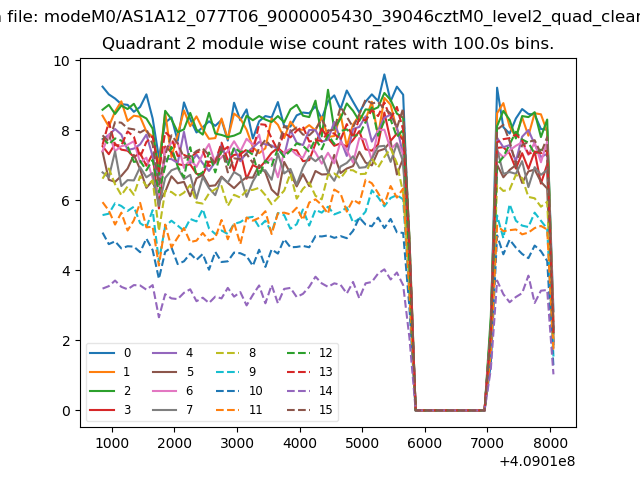
| Quadrant-wise count rates Data is divided into 100 sec bins |
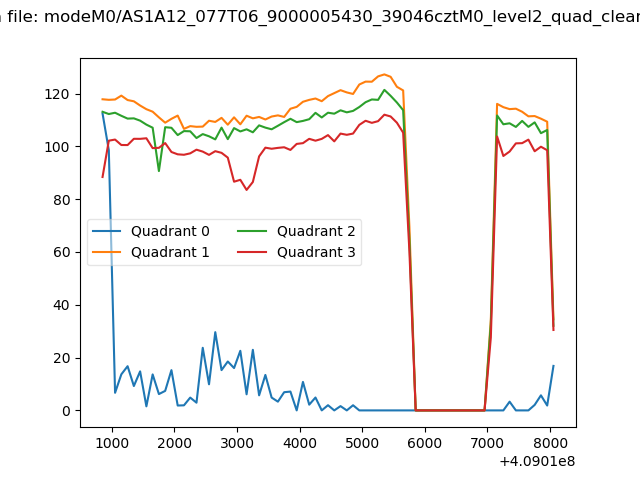 |
|
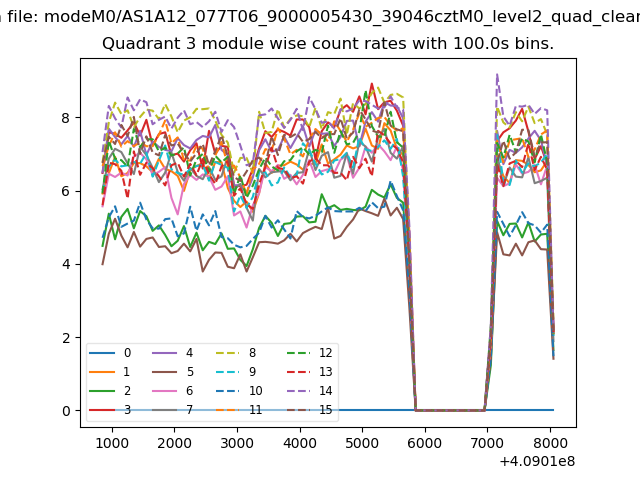
| Module-wise count rates for Quadrant A Data is divided into 100 sec bins |
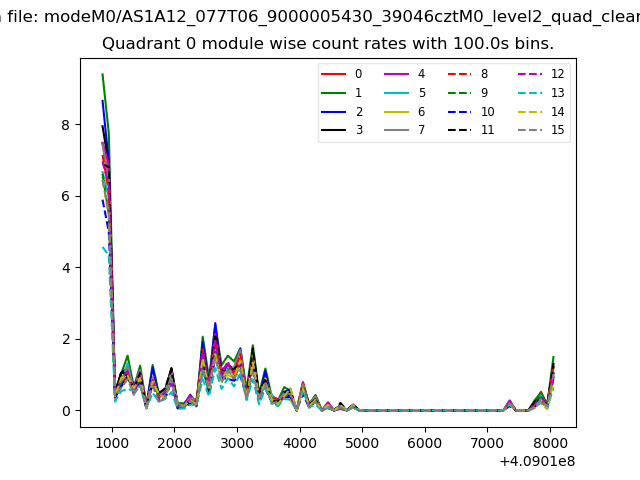 |
 |
| Module-wise count rates for Quadrant B Data is divided into 100 sec bins |
 |
 |
| Module-wise count rates for Quadrant C Data is divided into 100 sec bins |
 |
 |
| Module-wise count rates for Quadrant D Data is divided into 100 sec bins |
 |
 |
| Parameter | Plot |
|---|---|
| CZT HV Monitor | 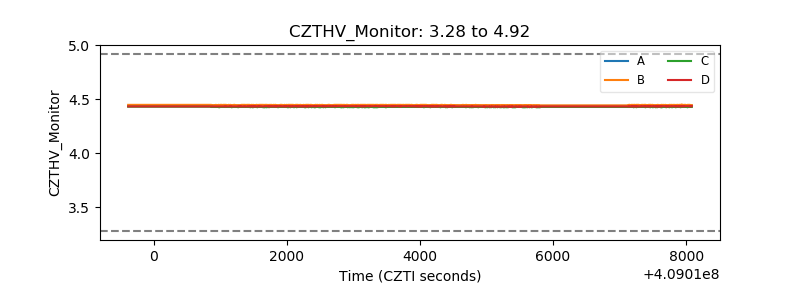 |
| D_VDD | 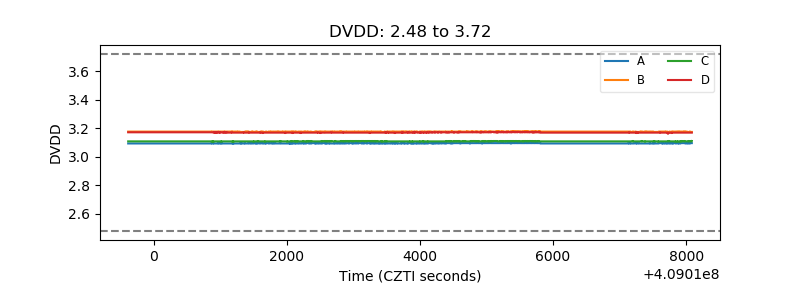 |
| Temperature 1 | 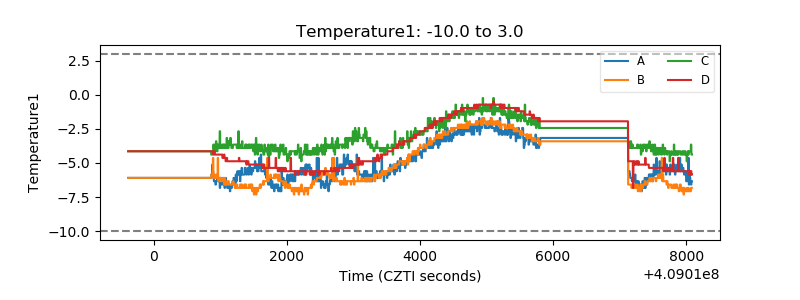 |
| Veto HV Monitor | 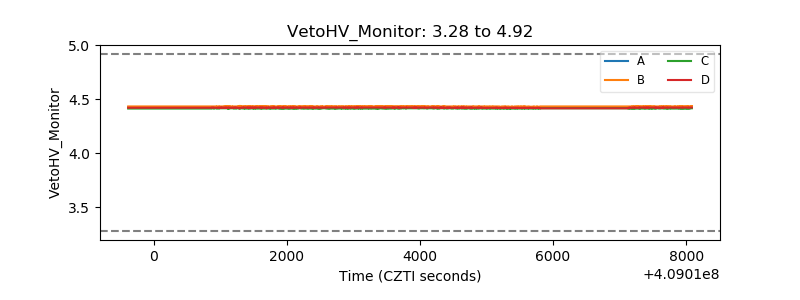 |
| Veto LLD | 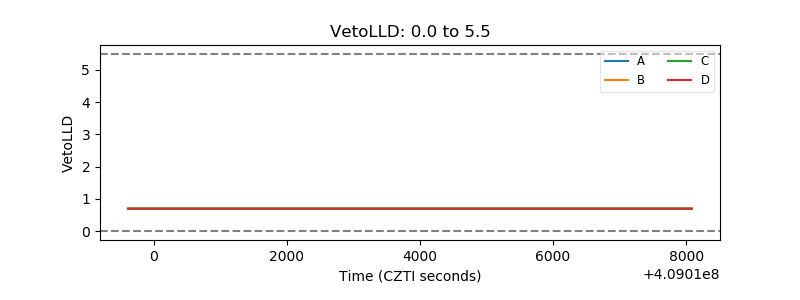 |
| Alpha Counter | 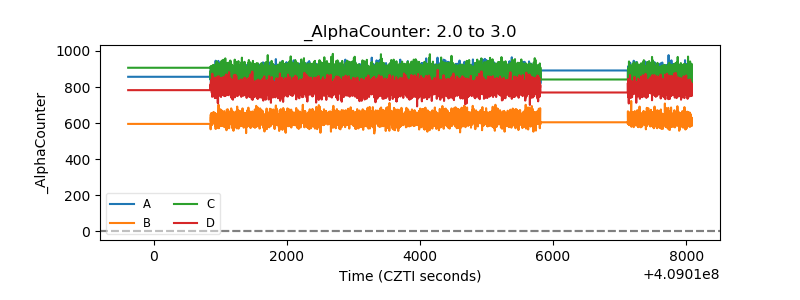 |
| _CPM_Rate | 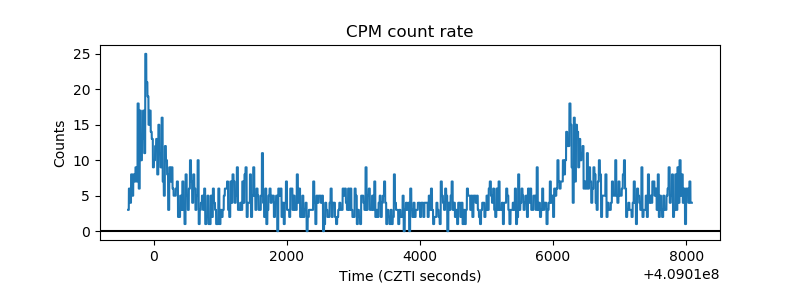 |
| CZT Counter | 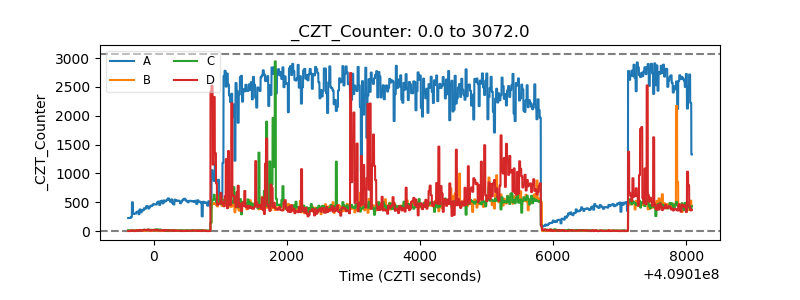 |
| +2.5 Volts monitor | 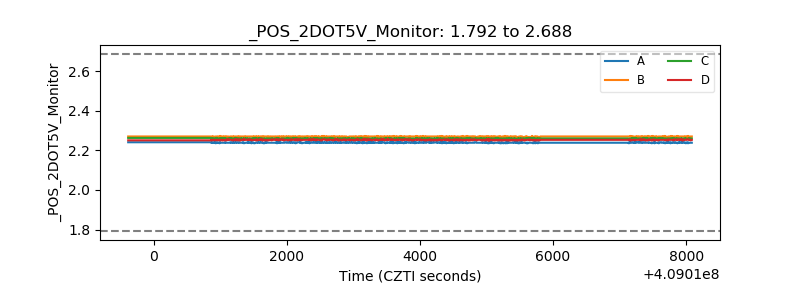 |
| +5 Volts monitor | 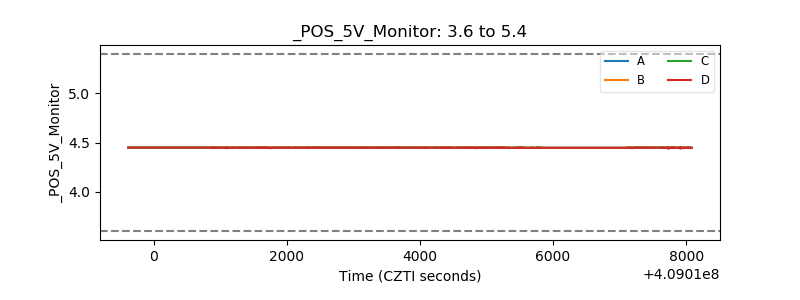 |
| _ROLL_ROT | 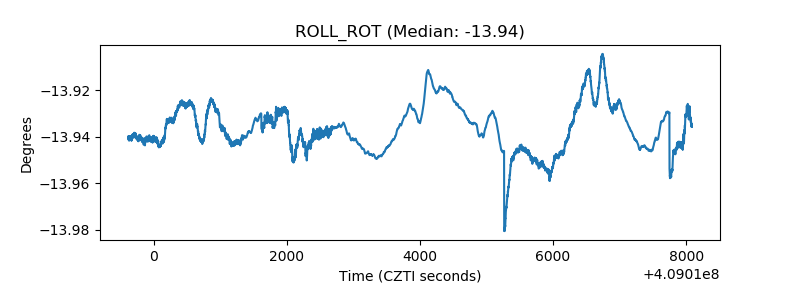 |
| _Roll_DEC | 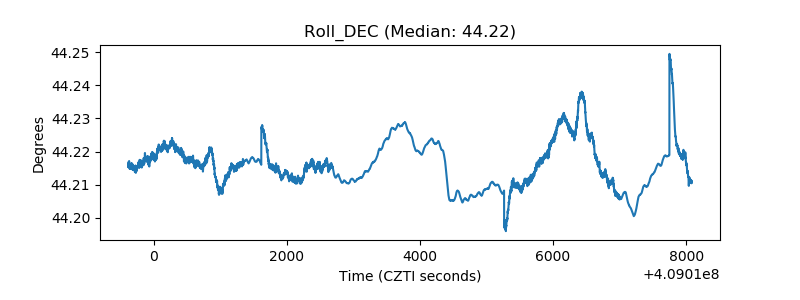 |
| _Roll_RA | 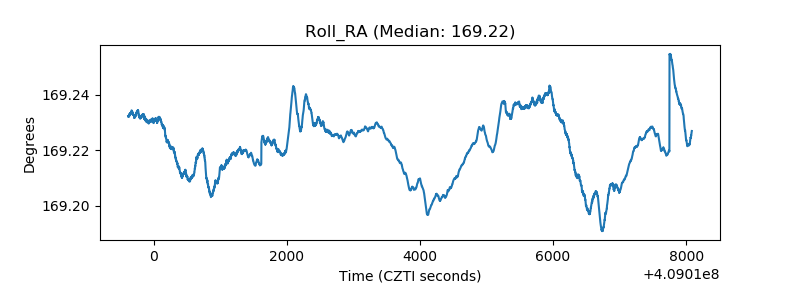 |
| Veto Counter | 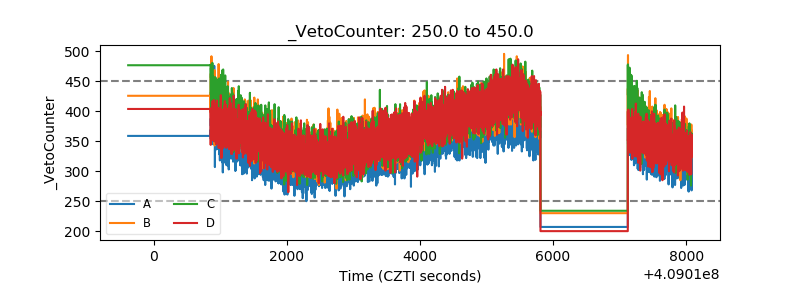 |