| Param | Original file | Final file |
|---|---|---|
| Filename | modeM0/AS1A12_077T06_9000005430_39047cztM0_level2.fits | modeM0/AS1A12_077T06_9000005430_39047cztM0_level2_quad_clean.evt |
| Size (bytes) | 722,188,800 | 81,930,240 |
| Size | 688.7 MB | 78.1 MB |
| Events in quadrant A | 15,481,310 | 57,468 |
| Events in quadrant B | 3,123,222 | 707,367 |
| Events in quadrant C | 3,086,326 | 677,943 |
| Events in quadrant D | 4,555,153 | 601,146 |
| Mode M9 | |||
|---|---|---|---|
| Quadrant | BADHDUFLAG | Total packets | Discarded packets |
| A | 0 | 27 | 0 |
| B | 0 | 27 | 0 |
| C | 0 | 27 | 0 |
| D | 0 | 27 | 0 |
| Mode M0 | |||
|---|---|---|---|
| Quadrant | BADHDUFLAG | Total packets | Discarded packets |
| A | 0 | 50311 | 42 |
| B | 0 | 13541 | 2 |
| C | 0 | 13218 | 2 |
| D | 0 | 18068 | 2 |
| Mode SS | |||
|---|---|---|---|
| Quadrant | BADHDUFLAG | Total packets | Discarded packets |
| A | 0 | 128 | 0 |
| B | 0 | 128 | 0 |
| C | 0 | 128 | 0 |
| D | 0 | 128 | 0 |
| Quadrant | Total seconds | Saturated seconds | Saturation percentage |
|---|---|---|---|
| A | 6256 | 5827 | 93.142583% |
| B | 6261 | 80 | 1.277751% |
| C | 6261 | 53 | 0.846510% |
| D | 6261 | 405 | 6.468615% |
Noise dominated data is calculated using 1-second bins in cleaned event files. If a bin has >2000 counts, and if more than 50% of those come from <1% of pixels, then it is considered to be noise-dominated and hence unusable.
| Quadrant | # 1 sec bins | Bins with >0 counts | Bins with >2000 counts | High rate bins dominated by noise | Noise dominated (total time) | Noise dominated (detector-on time) | Marked lightcurve |
|---|---|---|---|---|---|---|---|
| A | 8858 | 6263 | 5672 | 5672 | 64.03% | 90.56% | 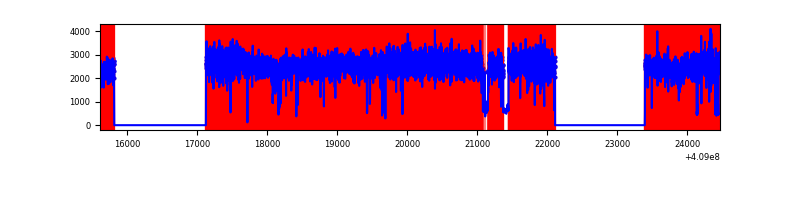 |
| B | 8858 | 6263 | 59 | 59 | 0.67% | 0.94% | 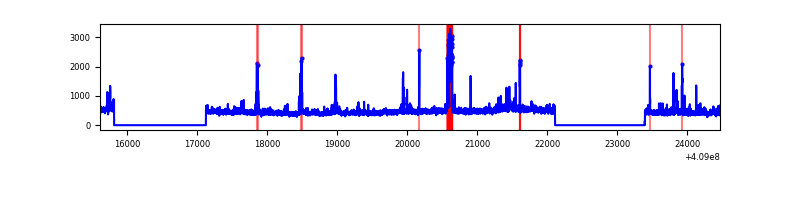 |
| C | 8858 | 6263 | 50 | 50 | 0.56% | 0.80% | 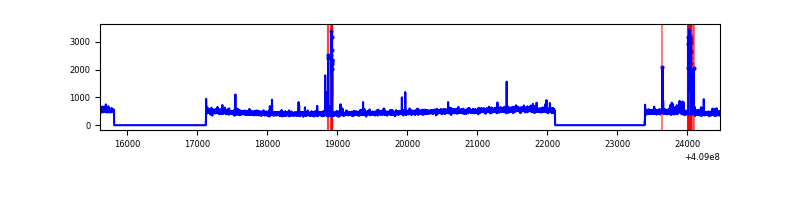 |
| D | 8858 | 6263 | 355 | 355 | 4.01% | 5.67% | 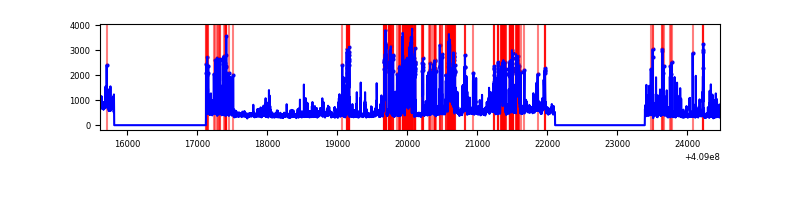 |
Top three noisy pixels from each quadrant. If the there are fewer than three noisy pixels in the level2.evt file, extra rows are filled as -1
| Pixel properties | Quadrant properties | ||||||
|---|---|---|---|---|---|---|---|
| Quadrant | DetID | PixID | Counts | Sigma | Mean | Median | Sigma |
| A | 15 | 222 | 13740876 | 193008.4 | 349 | 342 | 71.2 |
| A | 10 | 83 | 239621 | 3361.07 | 349 | 342 | 71.2 |
| A | 13 | 248 | 96747 | 1354.17 | 349 | 342 | 71.2 |
| B | 0 | 190 | 333577 | 2517.23 | 682 | 662 | 132.3 |
| B | 0 | 230 | 55383 | 413.76 | 682 | 662 | 132.3 |
| B | 5 | 172 | 27372 | 201.96 | 682 | 662 | 132.3 |
| C | 15 | 214 | 259695 | 1667.26 | 669 | 673 | 155.4 |
| C | 14 | 254 | 169658 | 1087.71 | 669 | 673 | 155.4 |
| C | 15 | 208 | 27462 | 172.43 | 669 | 673 | 155.4 |
| D | 12 | 227 | 573393 | 3617.9 | 651 | 632 | 158.3 |
| D | 1 | 47 | 565954 | 3570.91 | 651 | 632 | 158.3 |
| D | 2 | 249 | 461001 | 2907.97 | 651 | 632 | 158.3 |
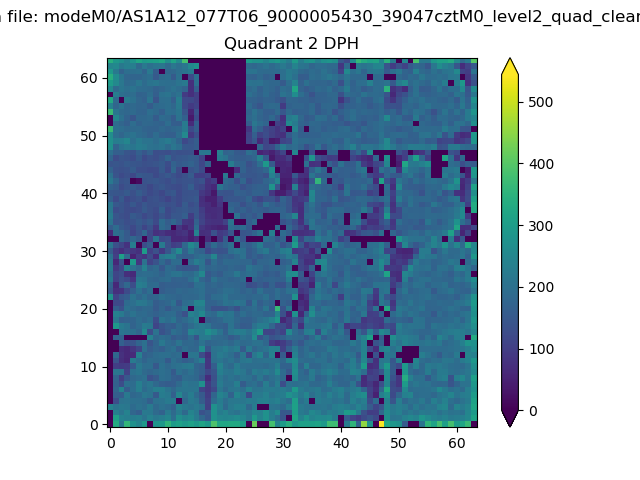
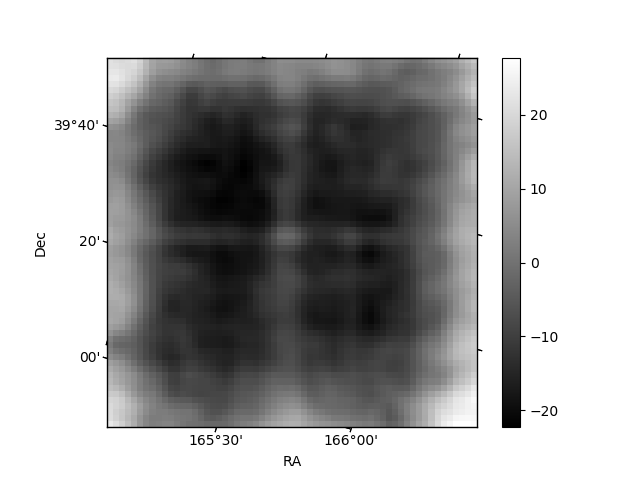
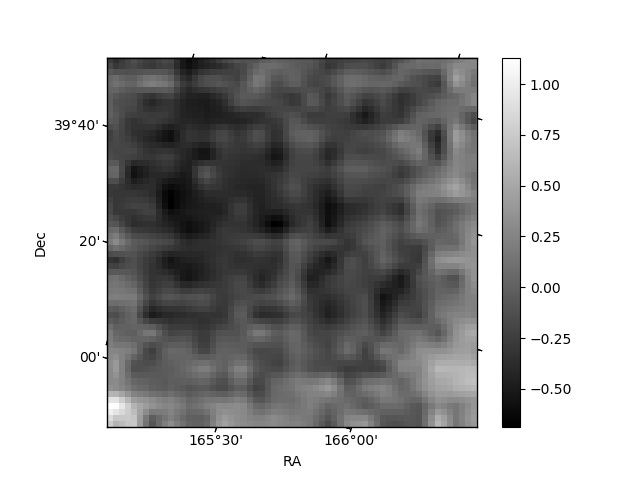
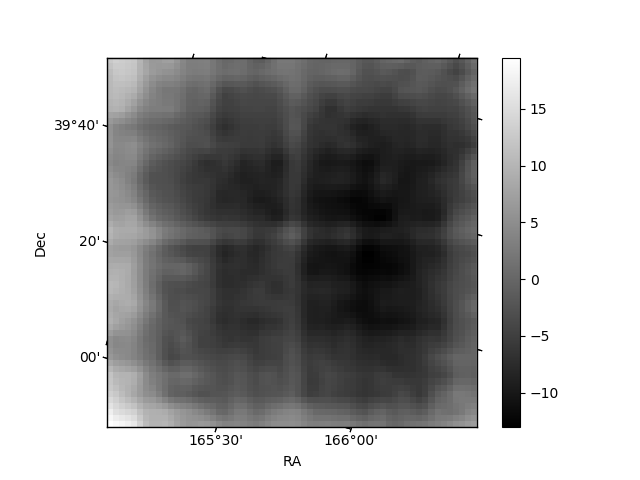
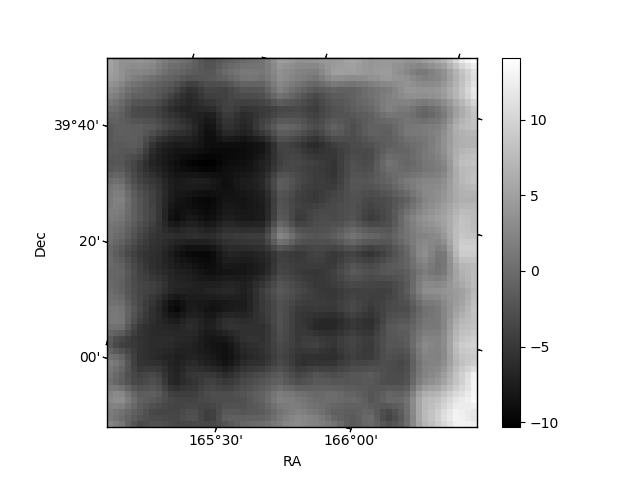
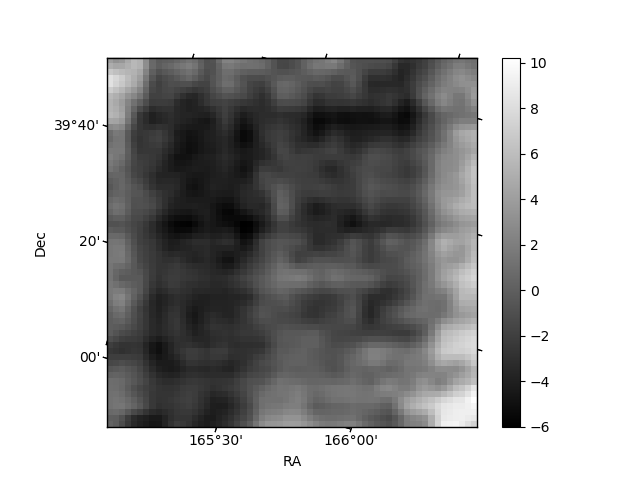
Histogram calculated using DETX and DETY for each event in the final _common_clean file
| Quadrant A | 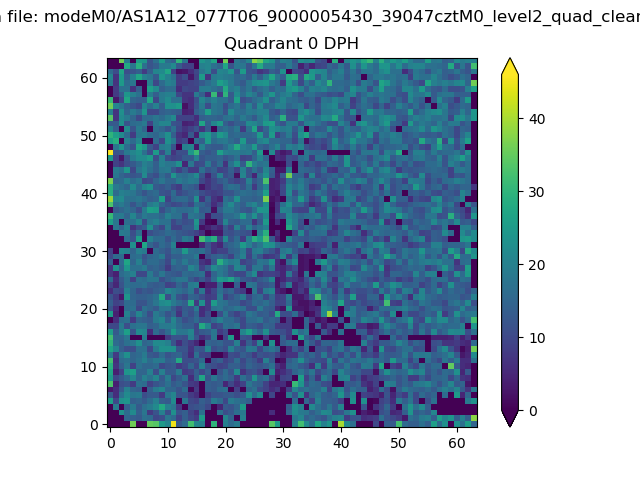 |
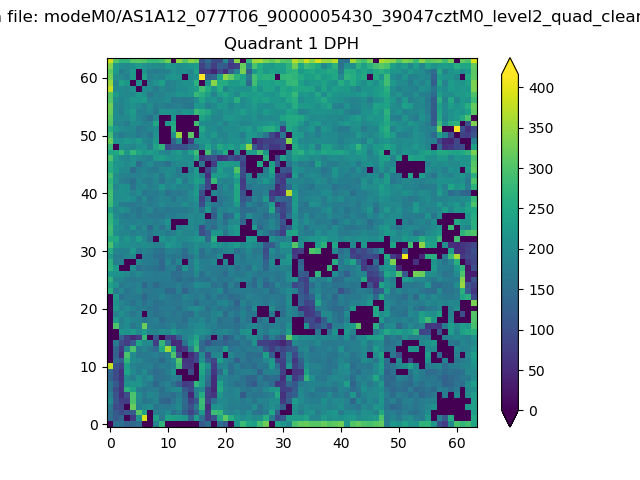 |
Quadrant B |
|---|---|---|---|
| Quadrant D | 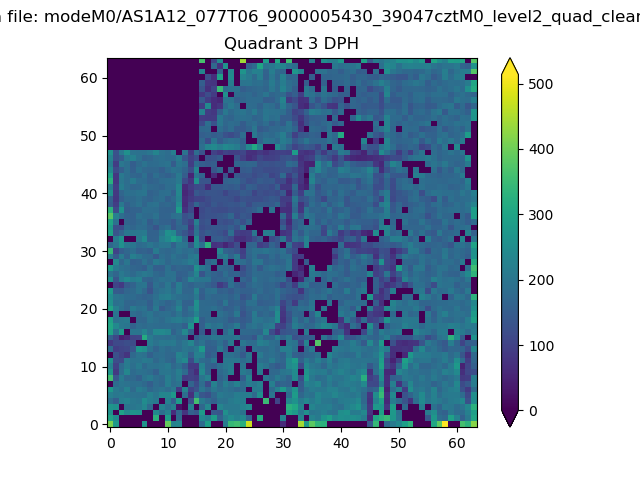 |
 |
Quadrant C |
| Plot type | Count rate plots | Images |
|---|---|---|
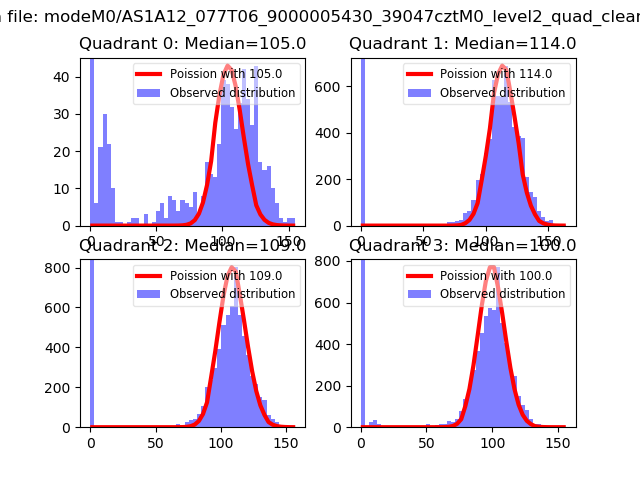
| Comparison with Poisson distribution Blue bars denote a histogram of data divided into 1 sec bins. Red curve is a Poisson curve with rate = median count rate of data. |
 |
 |
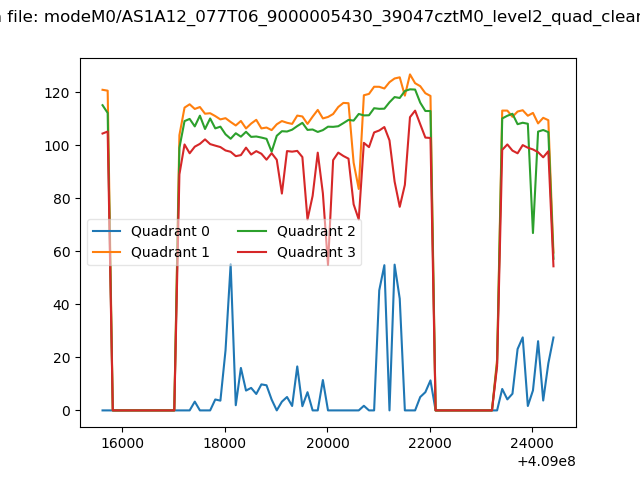
| Quadrant-wise count rates Data is divided into 100 sec bins |
 |
|
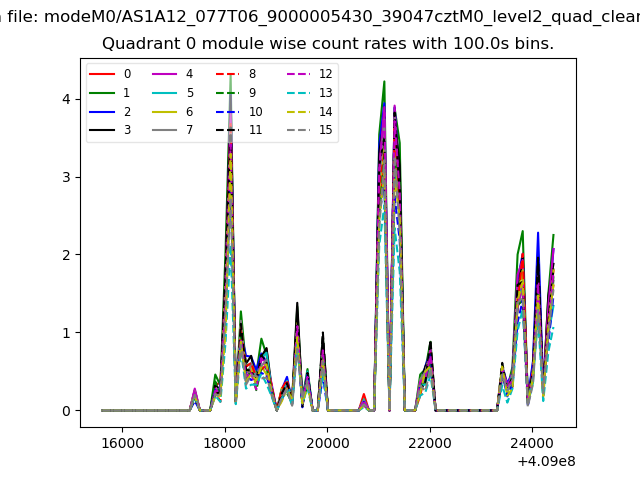
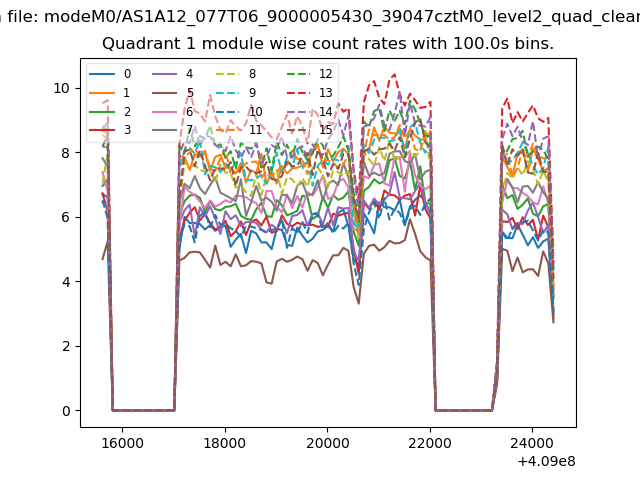
| Module-wise count rates for Quadrant A Data is divided into 100 sec bins |
 |
 |
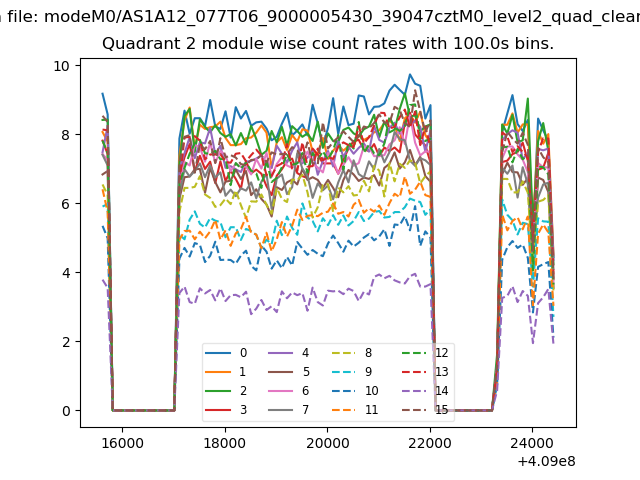
| Module-wise count rates for Quadrant B Data is divided into 100 sec bins |
 |
 |
| Module-wise count rates for Quadrant C Data is divided into 100 sec bins |
 |
 |
| Module-wise count rates for Quadrant D Data is divided into 100 sec bins |
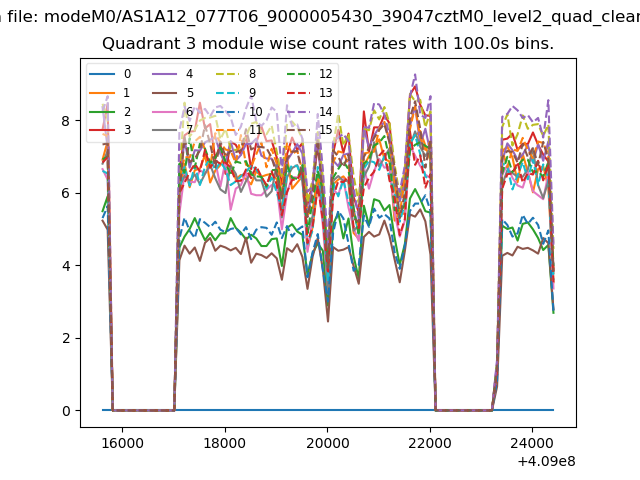 |
 |
| Parameter | Plot |
|---|---|
| CZT HV Monitor | 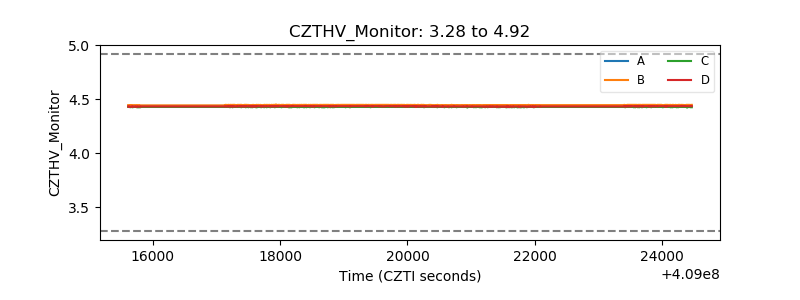 |
| D_VDD | 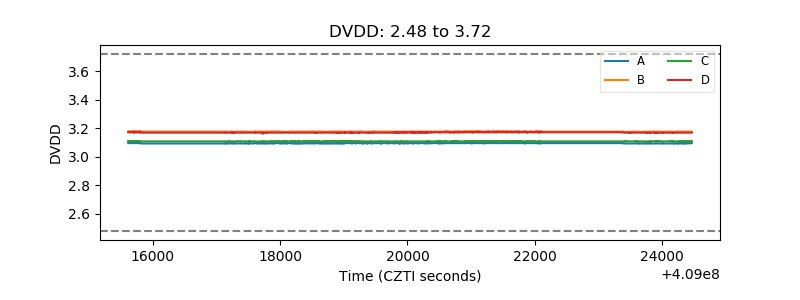 |
| Temperature 1 | 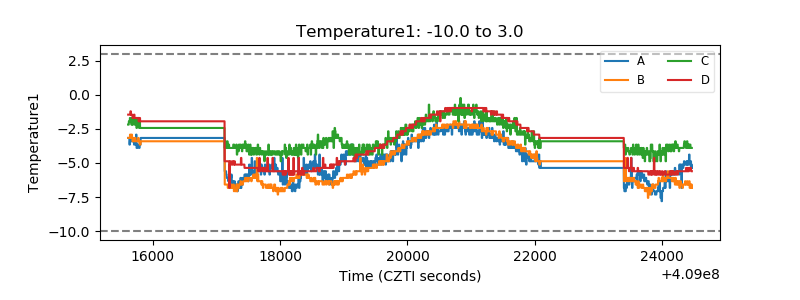 |
| Veto HV Monitor | 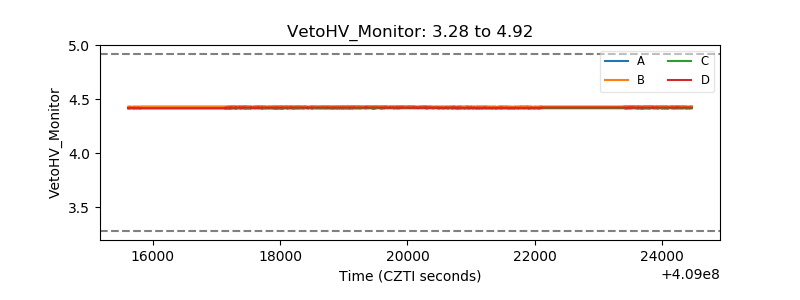 |
| Veto LLD | 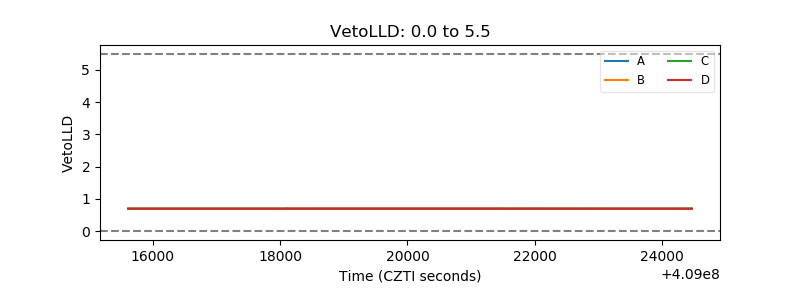 |
| Alpha Counter | 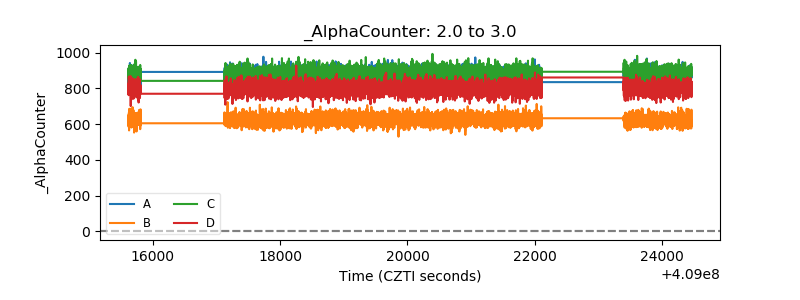 |
| _CPM_Rate | 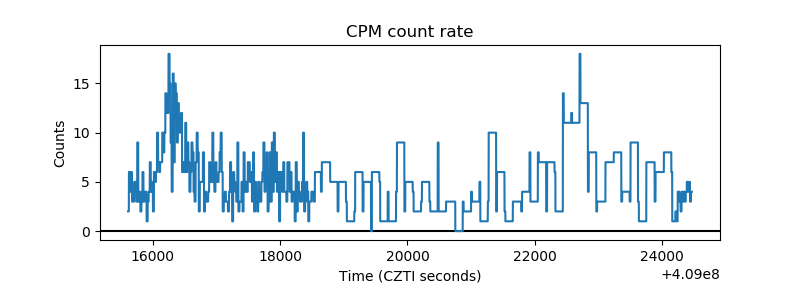 |
| CZT Counter | 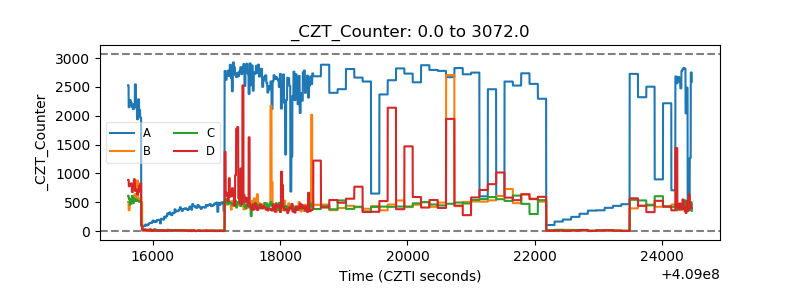 |
| +2.5 Volts monitor | 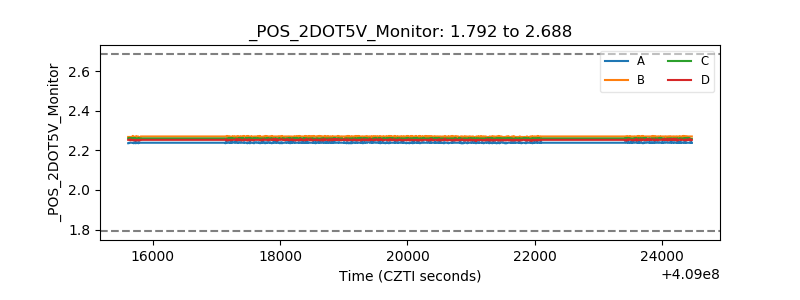 |
| +5 Volts monitor | 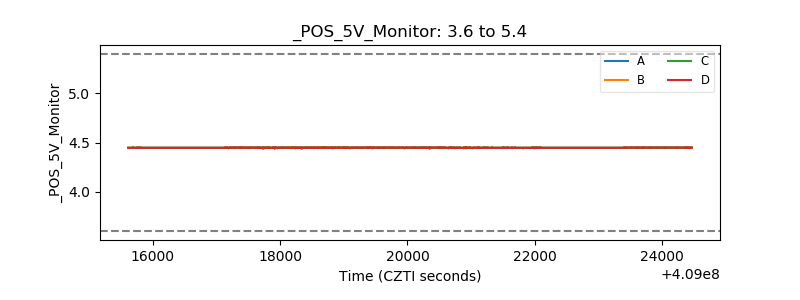 |
| _ROLL_ROT | 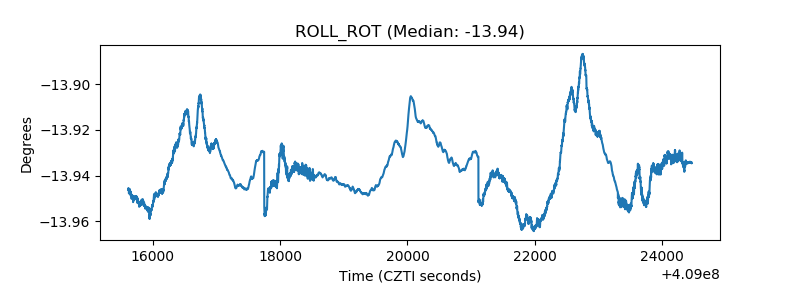 |
| _Roll_DEC | 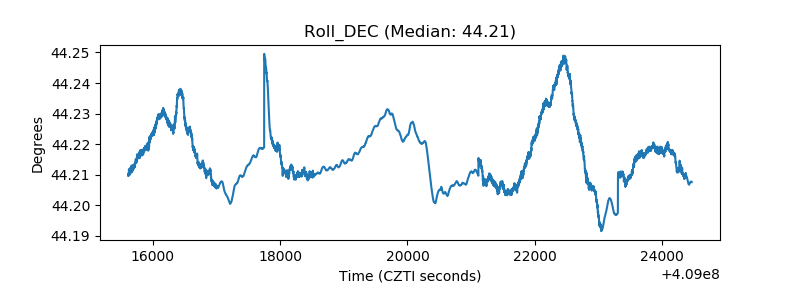 |
| _Roll_RA | 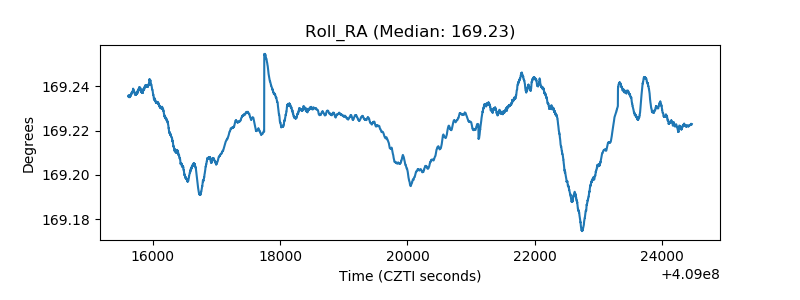 |
| Veto Counter | 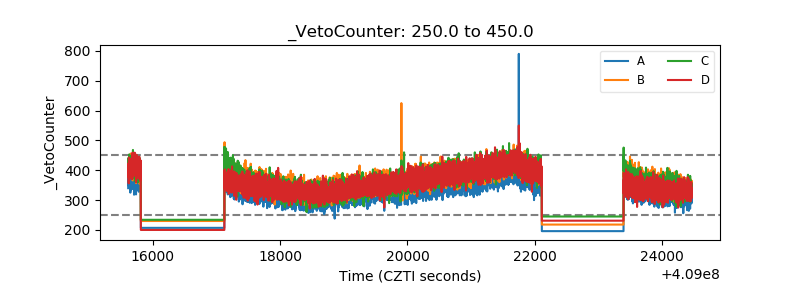 |