| Param | Original file | Final file |
|---|---|---|
| Filename | modeM0/AS1A12_077T06_9000005430_39049cztM0_level2.fits | modeM0/AS1A12_077T06_9000005430_39049cztM0_level2_quad_clean.evt |
| Size (bytes) | 1,107,717,120 | 163,661,760 |
| Size | 1.0 GB | 156.1 MB |
| Events in quadrant A | 20,740,138 | 614,751 |
| Events in quadrant B | 5,356,517 | 1,276,055 |
| Events in quadrant C | 5,522,640 | 1,213,352 |
| Events in quadrant D | 8,514,250 | 1,072,422 |
| Mode M9 | |||
|---|---|---|---|
| Quadrant | BADHDUFLAG | Total packets | Discarded packets |
| A | 0 | 41 | 0 |
| B | 0 | 41 | 0 |
| C | 0 | 41 | 0 |
| D | 0 | 41 | 0 |
| Mode M0 | |||
|---|---|---|---|
| Quadrant | BADHDUFLAG | Total packets | Discarded packets |
| A | 0 | 69389 | 4 |
| B | 0 | 23644 | 3 |
| C | 0 | 23526 | 3 |
| D | 0 | 33384 | 3 |
| Mode SS | |||
|---|---|---|---|
| Quadrant | BADHDUFLAG | Total packets | Discarded packets |
| A | 0 | 232 | 0 |
| B | 0 | 232 | 0 |
| C | 0 | 232 | 0 |
| D | 0 | 232 | 0 |
| Quadrant | Total seconds | Saturated seconds | Saturation percentage |
|---|---|---|---|
| A | 11246 | 6045 | 53.752445% |
| B | 11246 | 55 | 0.489063% |
| C | 11246 | 51 | 0.453495% |
| D | 11246 | 719 | 6.393384% |
Noise dominated data is calculated using 1-second bins in cleaned event files. If a bin has >2000 counts, and if more than 50% of those come from <1% of pixels, then it is considered to be noise-dominated and hence unusable.
| Quadrant | # 1 sec bins | Bins with >0 counts | Bins with >2000 counts | High rate bins dominated by noise | Noise dominated (total time) | Noise dominated (detector-on time) | Marked lightcurve |
|---|---|---|---|---|---|---|---|
| A | 15306 | 11249 | 5695 | 5695 | 37.21% | 50.63% | 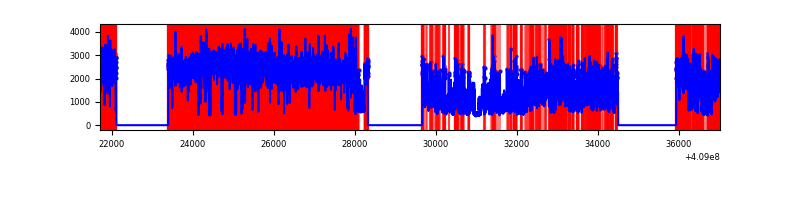 |
| B | 15306 | 11249 | 22 | 22 | 0.14% | 0.20% | 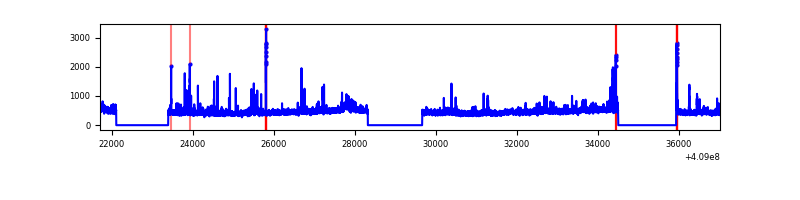 |
| C | 15306 | 11249 | 44 | 44 | 0.29% | 0.39% | 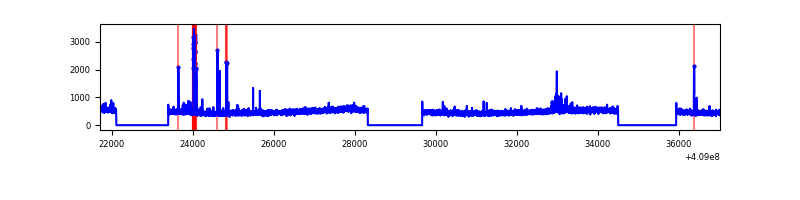 |
| D | 15306 | 11249 | 646 | 646 | 4.22% | 5.74% | 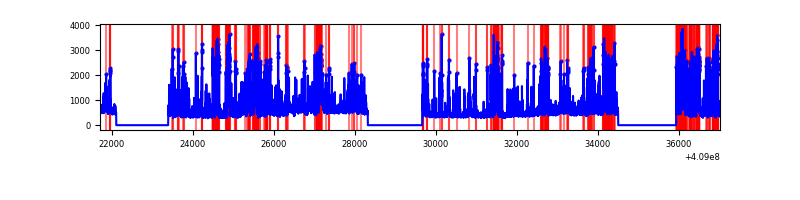 |
Top three noisy pixels from each quadrant. If the there are fewer than three noisy pixels in the level2.evt file, extra rows are filled as -1
| Pixel properties | Quadrant properties | ||||||
|---|---|---|---|---|---|---|---|
| Quadrant | DetID | PixID | Counts | Sigma | Mean | Median | Sigma |
| A | 15 | 222 | 15782406 | 82933.22 | 952 | 932 | 190.3 |
| A | 10 | 83 | 611177 | 3206.9 | 952 | 932 | 190.3 |
| A | 13 | 248 | 375033 | 1965.94 | 952 | 932 | 190.3 |
| B | 0 | 190 | 318530 | 1330.64 | 1245 | 1211 | 238.5 |
| B | 5 | 172 | 109077 | 452.32 | 1245 | 1211 | 238.5 |
| B | 12 | 111 | 30476 | 122.72 | 1245 | 1211 | 238.5 |
| C | 15 | 214 | 464015 | 1643.92 | 1219 | 1227 | 281.5 |
| C | 14 | 254 | 170195 | 600.21 | 1219 | 1227 | 281.5 |
| C | 15 | 208 | 111332 | 391.12 | 1219 | 1227 | 281.5 |
| D | 2 | 249 | 1093616 | 3747.24 | 1193 | 1156 | 291.5 |
| D | 1 | 47 | 1037751 | 3555.61 | 1193 | 1156 | 291.5 |
| D | 13 | 249 | 680965 | 2331.81 | 1193 | 1156 | 291.5 |
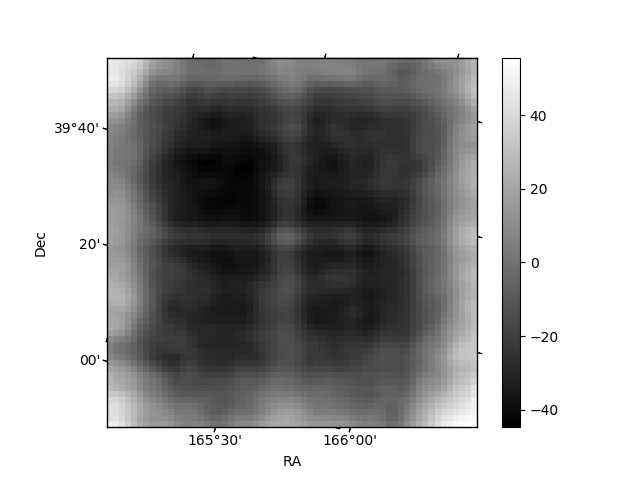
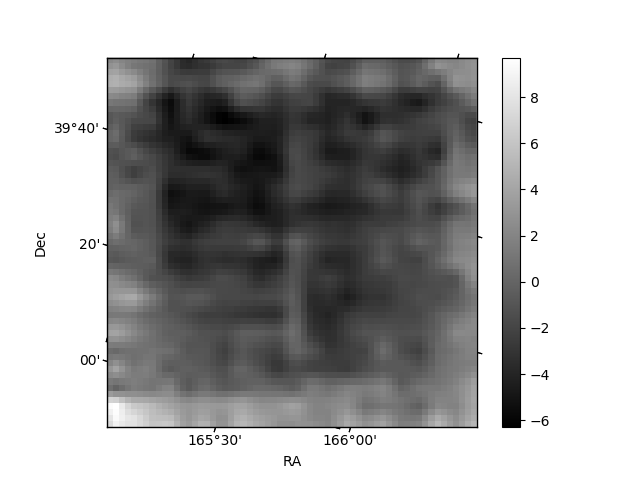
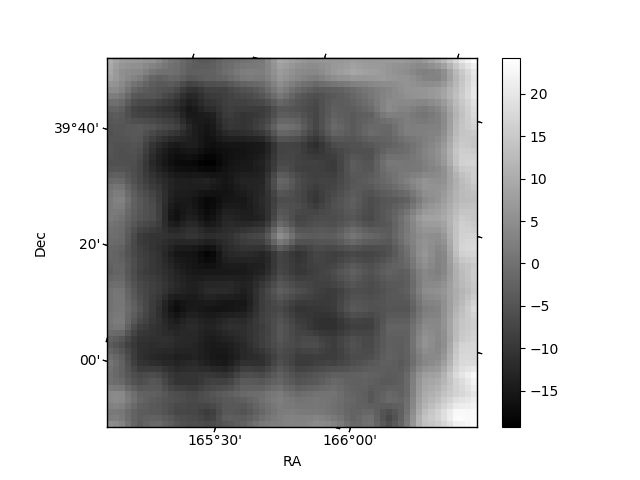
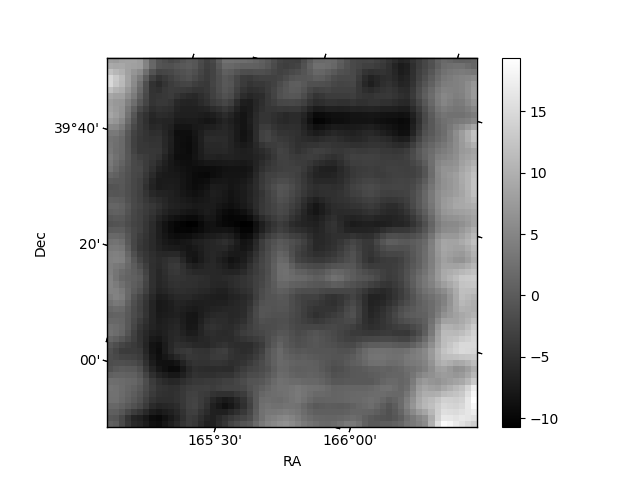
Histogram calculated using DETX and DETY for each event in the final _common_clean file
| Quadrant A | 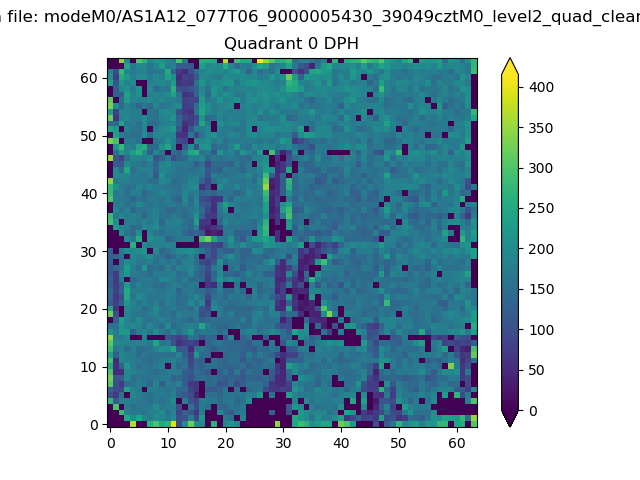 |
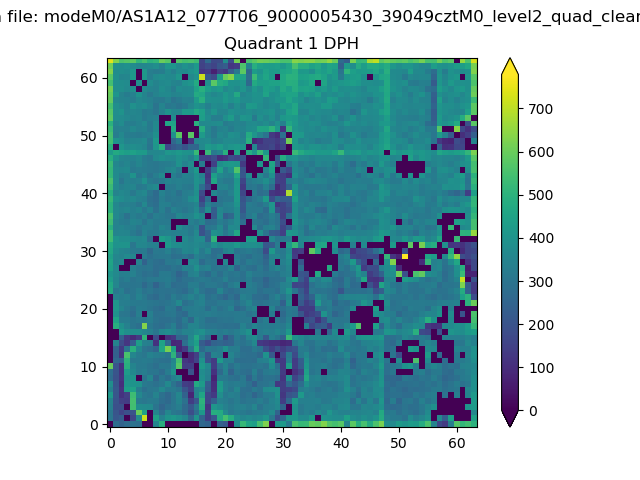 |
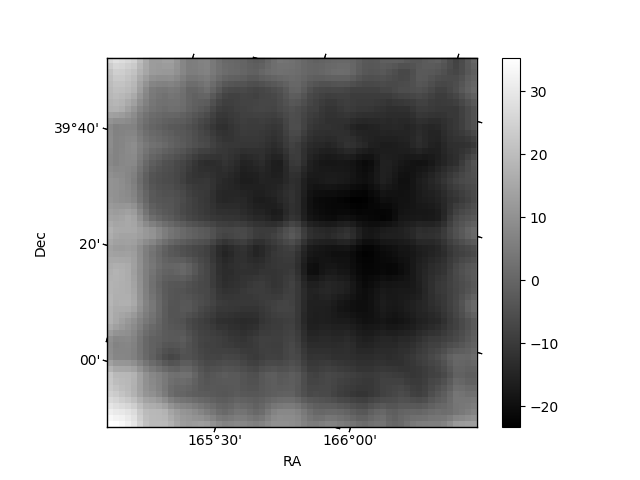
Quadrant B |
|---|---|---|---|
| Quadrant D | 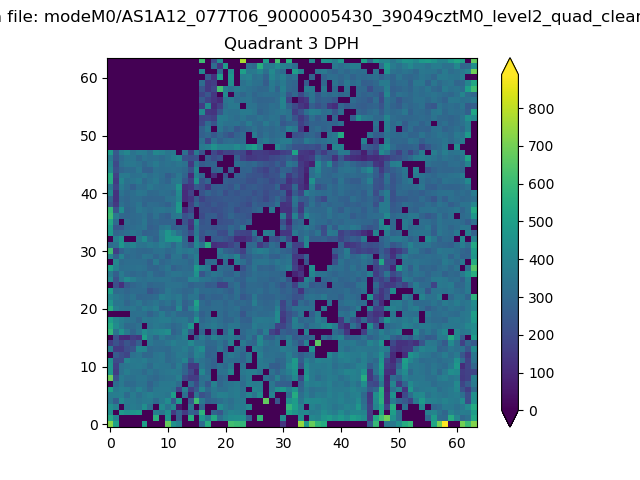 |
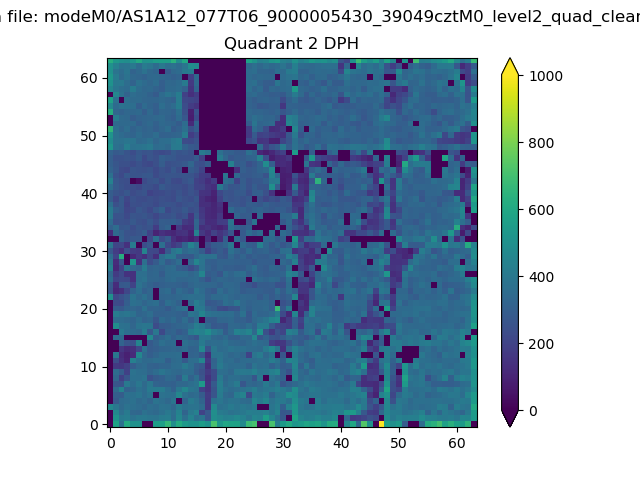 |
Quadrant C |
| Plot type | Count rate plots | Images |
|---|---|---|
| Comparison with Poisson distribution Blue bars denote a histogram of data divided into 1 sec bins. Red curve is a Poisson curve with rate = median count rate of data. |
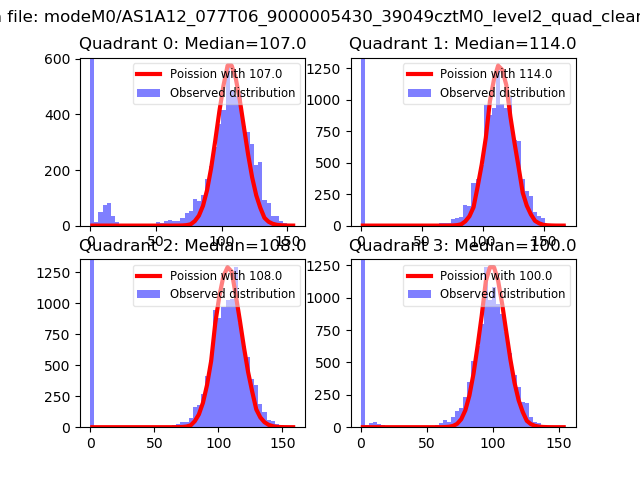 |
 |
| Quadrant-wise count rates Data is divided into 100 sec bins |
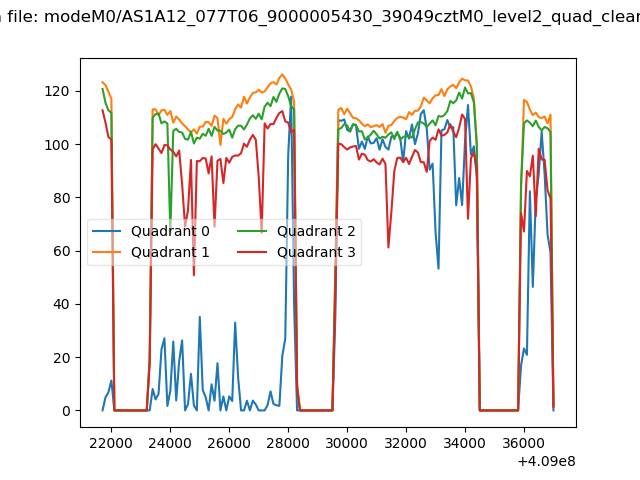 |
|
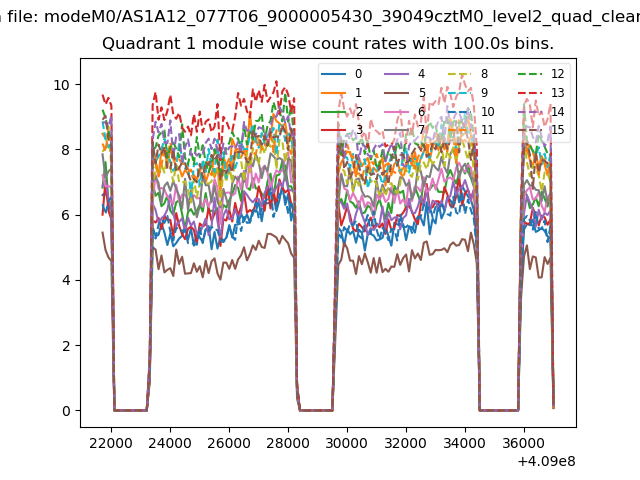
| Module-wise count rates for Quadrant A Data is divided into 100 sec bins |
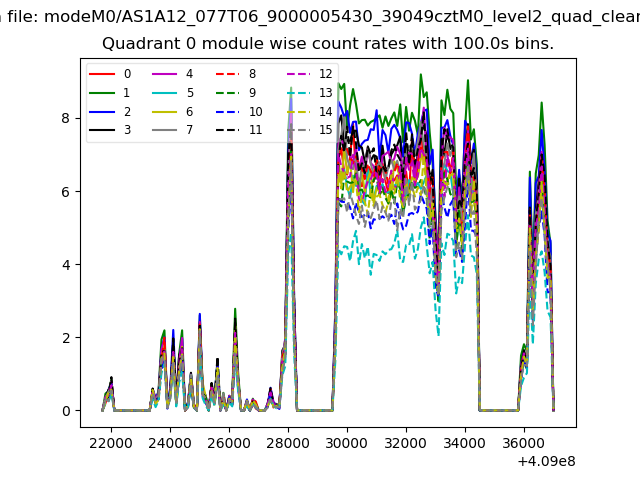 |
 |
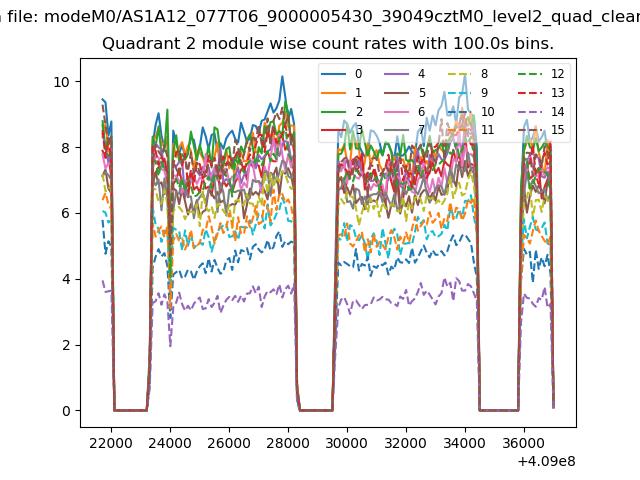
| Module-wise count rates for Quadrant B Data is divided into 100 sec bins |
 |
 |
| Module-wise count rates for Quadrant C Data is divided into 100 sec bins |
 |
 |
| Module-wise count rates for Quadrant D Data is divided into 100 sec bins |
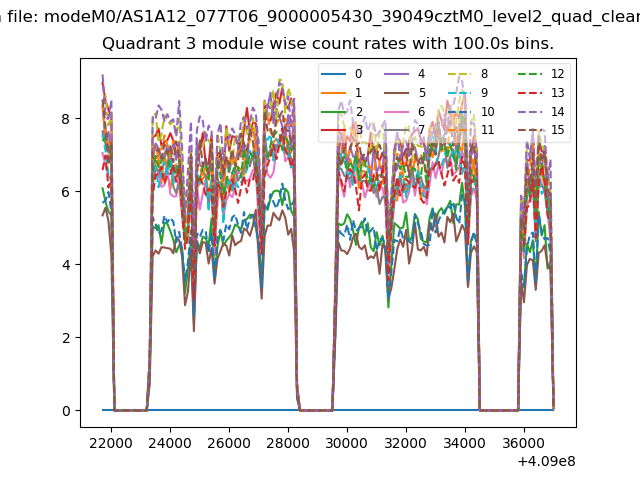 |
 |
| Parameter | Plot |
|---|---|
| CZT HV Monitor | 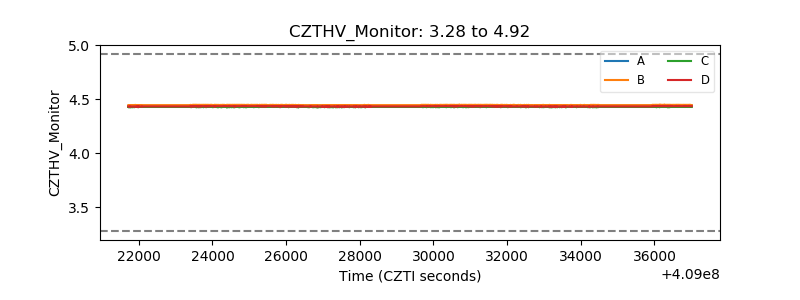 |
| D_VDD | 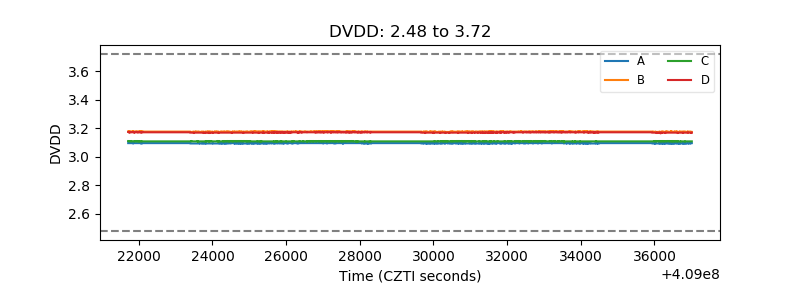 |
| Temperature 1 | 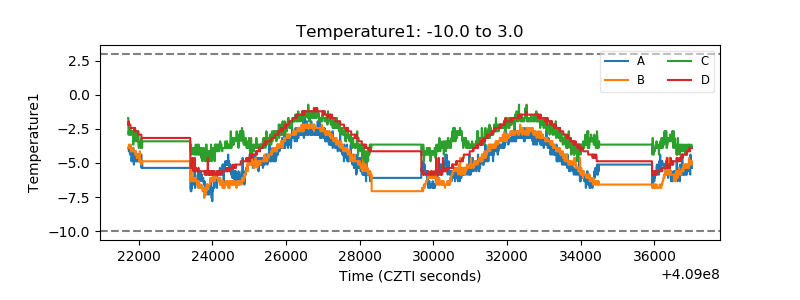 |
| Veto HV Monitor | 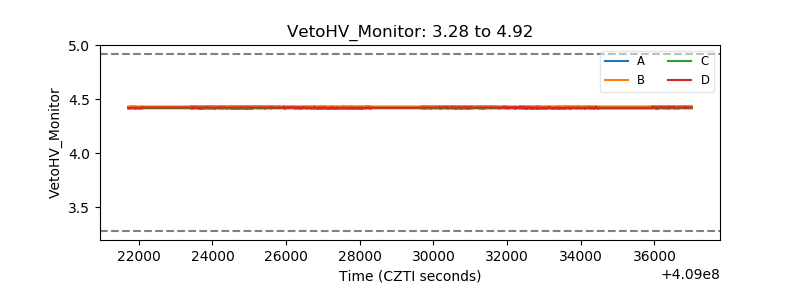 |
| Veto LLD | 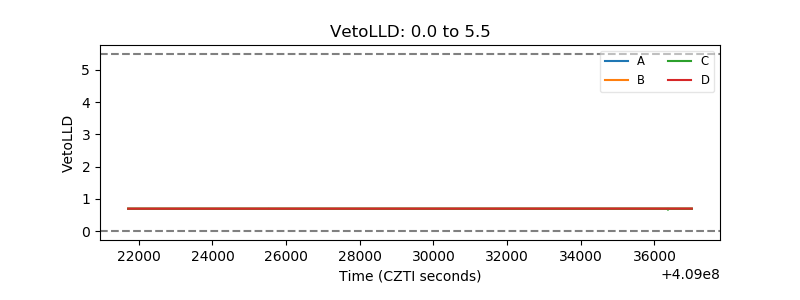 |
| Alpha Counter | 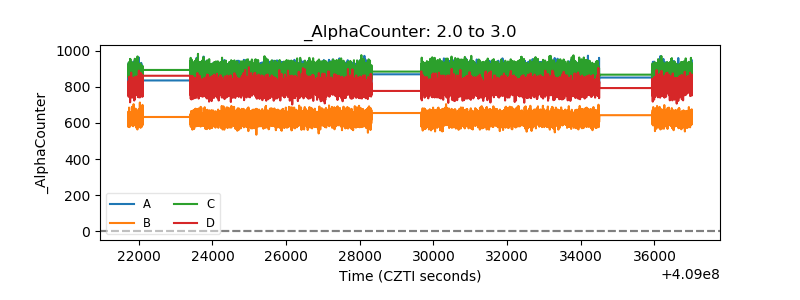 |
| _CPM_Rate | 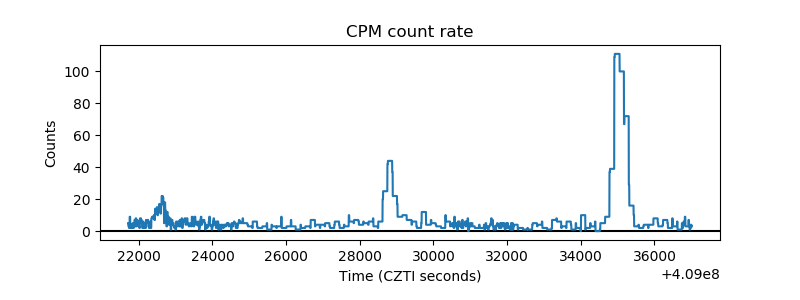 |
| CZT Counter | 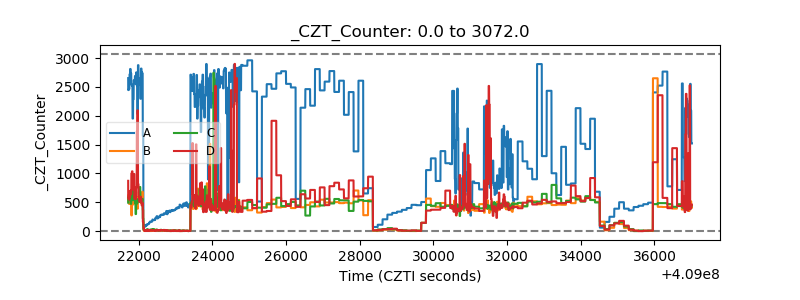 |
| +2.5 Volts monitor | 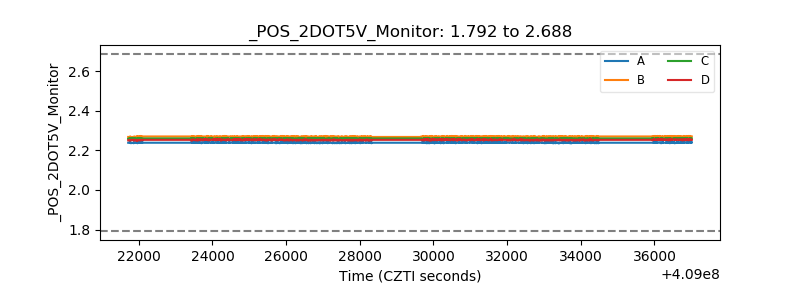 |
| +5 Volts monitor | 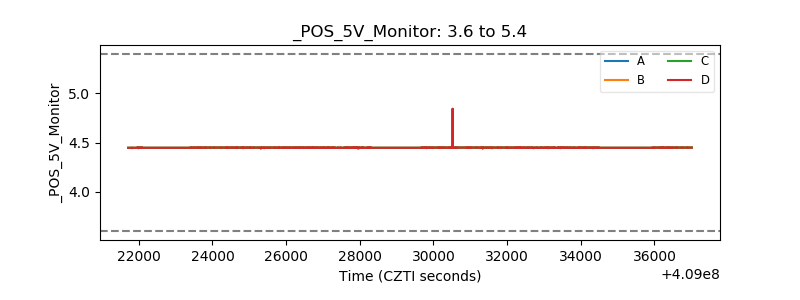 |
| _ROLL_ROT | 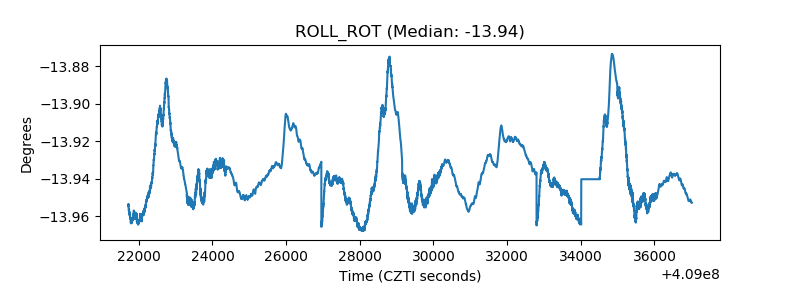 |
| _Roll_DEC | 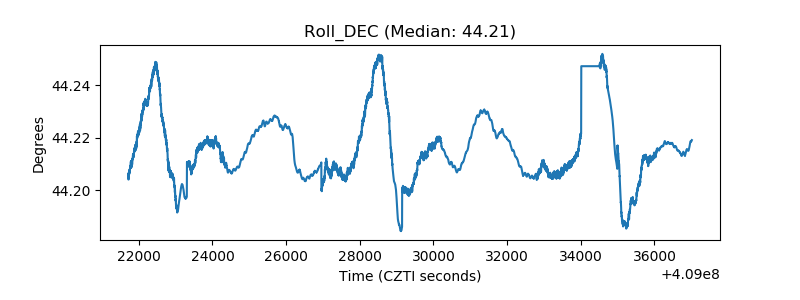 |
| _Roll_RA | 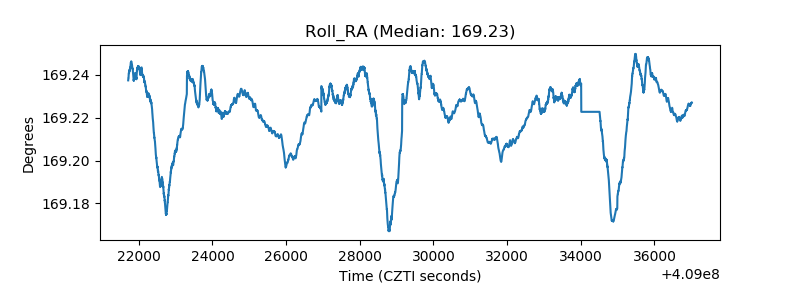 |
| Veto Counter | 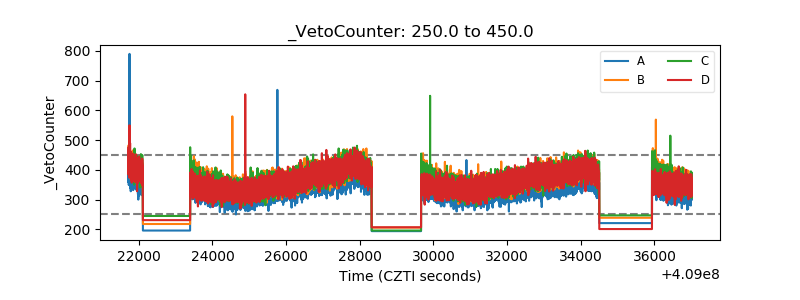 |